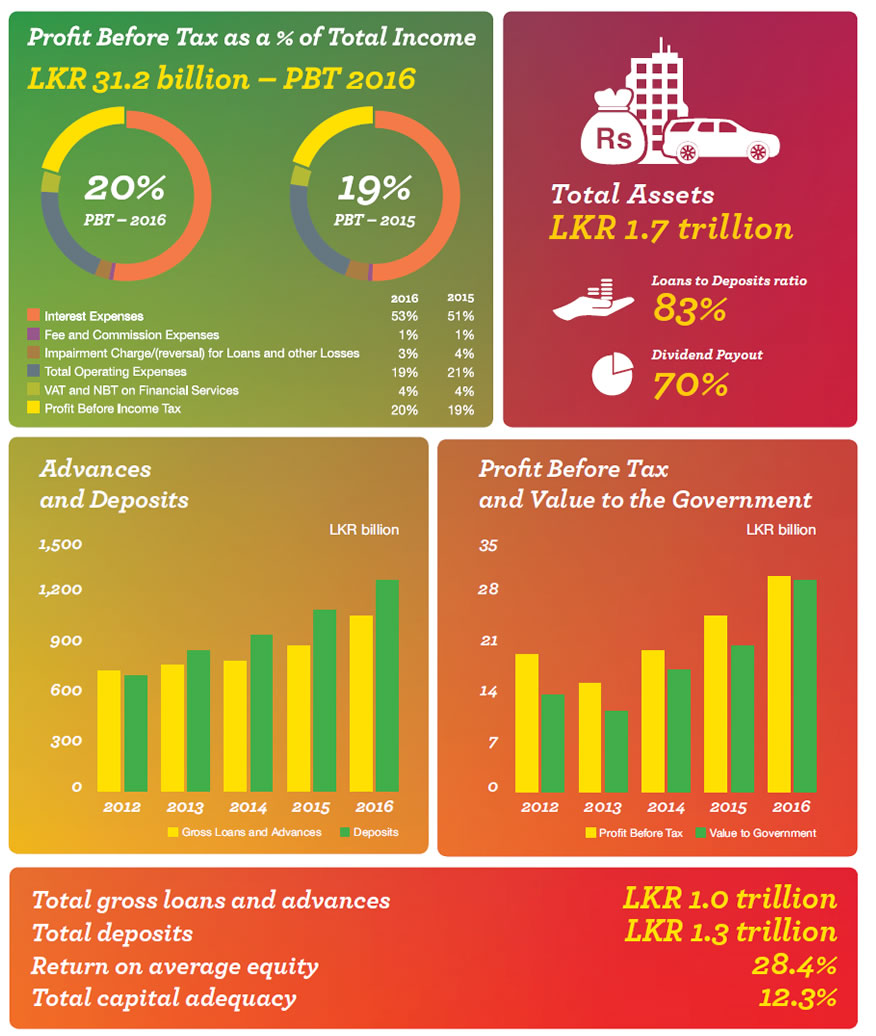
| Bank | Group | |||||
| As at 31 December | 2016 | 2015 | Change % | 2016 | 2015 | Change % |
| Results of Operations (LKR million) | ||||||
| Total income | 154,121 | 131,502 | 17.2 | 159,701 | 137,984 | 15.7 |
| Net interest income | 53,957 | 46,326 | 16.5 | 56,606 | 48,702 | 16.2 |
| Profit before financial VAT, NBT and tax | 37,454 | 30,095 | 24.5 | 36,431 | 30,256 | 20.4 |
| Profit before tax | 31,189 | 25,279 | 23.4 | 30,117 | 25,477 | 18.2 |
| Profit after tax | 24,791 | 17,357 | 42.8 | 23,386 | 17,387 | 34.5 |
| Value to the Government | 30,064 | 21,129 | 42.3 | 30,554 | 21,594 | 41.5 |
| Financial Position (LKR million) | ||||||
| Total assets | 1,669,291 | 1,568,289 | 6.4 | 1,716,557 | 1,610,199 | 6.6 |
| Gross loans and advances | 1,047,190 | 869,316 | 20.5 | 1,075,952 | 895,939 | 20.1 |
| Loans and advances net of provisioning for impairment |
1,000,083 | 826,790 | 21.5 | 1,027,768 | 851,905 | 20.6 |
| Customer deposits | 1,256,589 | 1,082,337 | 16.1 | 1,273,631 | 1,097,951 | 16.0 |
| Total liabilities | 1,576,442 | 1,486,804 | 6.0 | 1,613,202 | 1,517,125 | 6.3 |
| Total equity | 92,850 | 81,485 | 13.9 | 103,355 | 93,074 | 11.0 |
| Per Share Data (LKR) | ||||||
| Basic earnings per share | 2,479 | 2,437 | 1.7 | 2,350 | 2,439 | (3.7) |
| Net assets value per share | 9,285 | 8,148 | 13.9 | 10,248 | 9,206 | 11.3 |
| Performance Ratios (%) | ||||||
| Return on average assets | 1.9 | 1.7 | 0.2 | 1.8 | 1.7 | 0.1 |
| Return on average equity | 28.4 | 22.2 | 6.2 | 23.8 | 19.5 | 4.3 |
| Interest margin | 3.3 | 3.3 | 0.0 | 3.4 | 3.4 | 0.0 |
| Cost to income | 43.0 | 44.7 | (1.7) | 46.7 | 47.4 | (0.7) |
| Loans to deposits | 83.3 | 80.3 | 3.0 | 84.5 | 81.6 | 2.9 |
| Debt to equity | 124.5 | 228.2 | (103.7) | – | – | – |
| Impairment provision as a percentage of gross loans and advances |
4.5 | 4.9 | (0.4) | 4.5 | 4.9 | (0.4) |
| Statutory Ratios (%) | ||||||
| Liquid assets ratio (Domestic) (minimum requirement 20%) |
21.6 | 28.2 | (6.6) | – | – | – |
| Core capital adequacy ratio (minimum requirement 5%) |
8.7 | 9.1 | (0.4) | 8.8 | 9.4 | (0.6) |
| Total capital adequacy ratio (minimum requirement 10%) |
12.3 | 13.1 | (0.8) | 12.5 | 13.3 | (0.8) |