


Supplementary Information
Annex 1: Investor Relations
Dear Stakeholder,
We take this opportunity to convey our sincere gratitude to our loyal investors for electing to invest in the Bank's capital, both equity and debt, and wish to assure that we are taking every possible step to optimise returns for your investments through prudent and sustained growth. As one of the few Domestic Systemically Important Banks and the largest private sector Bank in the country, we are fully aware of our responsibility to present you with timely, relevant, and balanced view of the Bank's fundamentals in terms of operational results, financial position, and cash flows enabling you to make informed decisions. We trust that the information presented in this Annual Report helps investors to comprehend the Bank's underlying strengths and it also bolsters confidence and loyalty, bringing together a loyal group of investors with a long-term view of their investment.
The Bank always strives to encourage effective two-way communication with our valued investors promoting mutual trust and confidence besides ensuring the rights conferred on the investors by various statutes. We believe that these initiatives have enabled the Bank to actively engage with our investors in a consistent, comprehensive and accurate manner, often going beyond the minimum regulations and in the underlying spirit, promoting its reputation. The Bank follows a multi-faceted approach to engage with its stakeholders, including the Annual Report, which is the Bank's main investor communications tool, and the Annual General Meeting which is an opportunity available for the investor community to engage with the Bank. We firmly believe that these engagements will certainly help our investors to gain insight into the Bank's performance, strategic direction, and approach to governance and risk management strategies adopted.
This year too, the Bank took several initiatives to produce a concise integrated Annual Report which can be seen throughout each section of this Report, with due consideration being given to the valuable feedback given by our shareholders in response to the results of the surveys conducted and feedback provided in the past. Continuing this journey, this year too we have made arrangements to enclose a stakeholder feedback form in this Annual Report in order to seek your valuable suggestions and opinion for further improvements. Your comments and opinions are of great value to us. Many are taken on board and incorporated into our strategies for long-term value creation. The investor relations section of our website is another popular channel available for stakeholders and the Bank continues to ensure that its pages are updated in a timely manner along with the rest of the site.
Investor relations tools
Figure - 28

We firmly believe that the Bank's efforts to have an effective communication and active engagement with important stakeholder groups have made the Bank's shares a creditable investment proposition, despite a very challenging economic and operating environment prevailed throughout the year primarily due to the outbreak of COVID-19 in the first quarter of the year. As you are aware, the stock market witnessed an unprecedented setback in its activities after being closed for almost two months and due to limiting trading of shares for just one hour a day initially by the regulators which was later relaxed by increasing the trading time to three and half hours compared to six hours of trading during the pre-pandemic period. However, this situation is in no manner extra-ordinary when compared with all other stock markets around the globe. Although the pandemic had an early shock resulting in both the ASPI and S&P SL20 declining by over 30% and 40%, respectively, both indices recovered remarkably and ended the year demonstrating its resilience by attracting record-breaking levels of trading activity, with a total turnover for the year of Rs. 397 Bn. which was also the highest since 2011. The ASPI closed 2020 on 6,774 points recording a growth of 10.52%, the highest annual increase the index has seen since 2014 and only the 12th occasion the index has seen a double-digit percentage growth in CSE's 35-year history. The ASPI on May 12, 2020 recorded its lowest point in over a decade but recovered from this to post a 59% gain by the end of the year. Although the S&P SL20 index, which features the CSE's 20 largest and most liquid stocks has declined by 10.18% in 2020, the index has recovered substantially indicating a trend similar to the ASPI with 57% growth since 12th May, closing the year at 2,638 points.
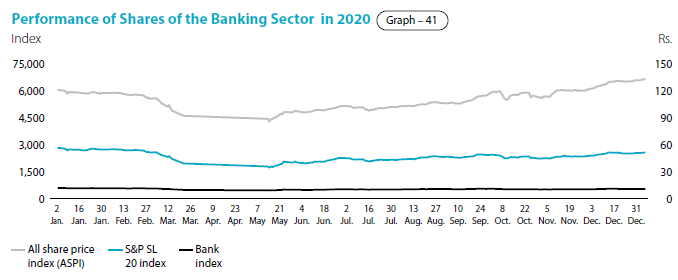
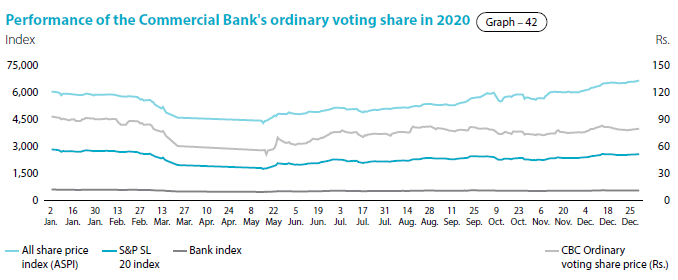
Despite, both the ASPI and S&P SL20 recovering as seen in the above graph, the banking sector shares did not follow the same trend, mainly due to the perceived uncertainties associated with the performance of banks owing to many relief programs offered to affected customers including moratoriums as mandated by the regulators. These factors contributed to the decline in the Bank's share price which traded at a discount to its book value at 0.60 times at the end of December 2020 (0.73 times in 2019). However, it continued to remain the highest among the peers in the Banking sector, and is a testament to our strong fundamentals and policy of sharing relevant information about our future prospects in addition to our current performance.
The Bank's public holding (free float) as at December 31, 2020 was 99.80% in voting shares (99.76% in 2019) and 99.84% in non-voting shares (86.62% in 2019) while float-adjusted market capitalisation (compliant under option-1 of the Rules on minimum public holding requirement of the Colombo Stock Exchange (CSE)) amounted to Rs. 93 Bn. (Rs. 96 Bn. in 2019). As shown in Table 58, with its shares actively traded in the CSE, investors are provided with a convenient "enter and exit" mechanism. It is pertinent to mention that the Bank witnessed a sharp increase in the number of shareholders holding both voting and non-voting shares of the Bank during the year, which amply demonstrates the confidence placed by investors in the Bank's shares despite the trying conditions experienced during the year 2020.
Compliance report on the contents of Annual Report in terms of the Listing Rules of the CSE
This year too we are happy to inform you that the Bank has fully complied with all applicable requirements of Section 7.6 of the Listing Rules of the CSE on the contents of the Annual Report and Accounts of a listed entity.
Please refer Table 46 for a complete list of disclosure requirements and references to the relevant sections of this Annual Report where the Bank's compliance is disclosed together with the relevant page numbers.
The pages that follow contain information on the performance of the Bank's listed securities.
Compliance with requirements of the Section 7.6 of the Listing Rules of the CSE
Table - 46
| Rule No. | Disclosure requirement | Section/reference |
| 7.6 (i) | Names of persons who during the financial year were Directors of the Bank | Corporate Governance Report |
| 7.6 (ii) | Principal activities of the Bank and its subsidiaries during the year and any changes therein | Note 1.3 of the Accounting Policies Group Structure |
| 7.6 (iii) | The names and the number of shares held by the 20 largest holders of voting and non-voting shares and the percentage of such shares held | Item 5.4 of the "Investor Relations" |
| 7.6 (iv) | The float adjusted market capitalisation, public holding percentage (%), number of public shareholders and under which option the listed entity complies with the minimum public holding requirement |
Item 5.3 of the "Investor Relations" |
| 7.6 (v) | A statement of each Directors' holding and Chief Executive Officer's holding in shares of the entity at the beginning and end of each financial year |
Item 5.5 of the "Investor Relations" |
| 7.6 (vi) | Information pertaining to material foreseeable risk factors of the Bank | Item 7 of the "Investor Relations" |
| 7.6 (vii) | Details of material issues pertaining to employees and industrial relations of the Bank |
Item 8 of the "Investor Relations" |
| 7.6 (viii) | Extents, locations, valuations and the number of buildings of the entity's land holdings and investment properties |
Note 39.5 (a) and (b) to the Financial Statements on "Property, Plant and Equipment" |
| 7.6 (ix) | Number of shares representing the Bank's stated capital | Note 52 to the Financial Statements on "Stated Capital" Item 3 of the "Investor Relations" |
| 7.6 (x) | A distribution schedule of the number of holders in each class of equity securities, and the percentage of their total holdings as at the end of the year | Item 5.2 of the "Investor Relations" |
| 7.6 (xi) | Ratios and market price information: Equity 'Dividend per share, dividend payout ratio, net asset value per share, market value per share Debt' Interest rate of comparable Government Securities, debt/equity ratio, interest cover and quick asset ratio, market prices and yield during the year Any changes in credit rating | Items 2, 4 and 10.2 of the "Investor Relations" Items 10.1 and 10.2 of the "Investor Relations" Item 11 "Investor Relations" |
| 7.6 (xii) | Significant changes in the Bank's or its subsidiaries' fixed assets and the market value of land, if the value differs substantially from the book value | Note 39.5 (b) to the Financial Statements on "Property, Plant and Equipment" |
| 7.6 (xiii) | Details of funds raised through Public Issues, Rights Issues, and Private Placements during the year | Note 52 to the Financial Statements on "Stated Capital" |
| 7.6 (xiv) | a. Information in respect of Employee Share Option Schemes (ESOS) The number of options granted to each category of employees during the financial year. Total number of options vested but not exercised by each category of employees during the financial year. Total number of options exercised by each category of employees and the total number of shares arising therefrom during the financial year. Options cancelled during the financial year and the reasons for such cancellation. The exercise price. A declaration by the directors of the entity confirming that the Entity or any of its subsidiaries has not, directly or indirectly, provided funds for the ESOS. | Note 53 to the Financial Statements on "Employee Share Option Plans" |
| b. Information in respect of Employee Share Purchase Schemes (ESPS) The total number of shares issued under the ESPS during the financial year The number of shares issued to each category of employees during the financial year The price at which the shares were issued to the employees A declaration by the Directors of the entity confirming that the entity or any of its subsidiaries has not, directly or indirectly, provided funds for the ESPS | Not applicable as the Bank does not have Employee Share Purchase Schemes | |
| 7.6 (xv) | Disclosures pertaining to Corporate Governance practices in terms of Rules 7.10.3, 7.10.5 (c) and 7.10.6 (c) of Section 7 of the Rules. | Not applicable since the Bank received an exemption in terms of Section 7.10 (c) of the Listing Rules |
| 7.6 (xvi) | Related party transactions exceeding 10% of the equity or 5% of the total assets of the entity as per Audited Financial Statements, whichever is lower | The Bank did not have any related party transactions exceeding this threshold as at end 2020 |
| Details of investments in a related party and/or amounts due from a related party to be set out separately
The details shall include, as a minimum:
i. The date of the transaction; ii. The name of the related party; iii. The relationship between the entity and the related party; iv. The amount of the transaction and terms of the transaction; v. The rationale for entering into the transaction |
Item 20.3 of Annual Report of Board of Directors |
1. Our Listed Securities
The Bank's ordinary shares (both voting and non-voting) are listed on the Main Board of the CSE under the ticker symbol "COMB".
All debentures issued are also listed on the CSE. (Refer Table 47 for a summary of listed securities of the Bank).
Most daily newspapers, including the Daily News, Daily FT, The Island and Daily Mirror carry a summary of trading activity and daily prices of shares and debentures using the abbreviation of Commercial Bank or COMB.
Summary of listed securities of the Bank
Table - 47
| Number in issue as at | Stock symbol | ||||
| December 31, 2020 | December 31, 2019 | ||||
| Equity | |||||
| Ordinary shares - Voting | 1,098,934,937 | 961,252,317 | COMB-N0000 | ||
| Ordinary shares - Non-voting | 67,970,701 | 66,254,269 | COMB-X0000 | ||
| Debt | |||||
| Fixed rate debentures March 2016/21 | 44,303,400 | 44,303,400 | COMB/BD/08/03/21-C2341-10.75% | ||
| Fixed rate debentures March 2016/26 | 17,490,900 | 17,490,900 | COMB/BD/08/03/26-C2342-11.25% | ||
| Fixed rate debentures March 2016/21 | 50,718,000 | 50,718,000 | COMB/BD/27/10/21-C2360-12.00% | ||
| Fixed rate debentures March 2016/26 | 19,282,000 | 19,282,000 | COMB/BD/27/10/26-C2359-12.25% | ||
| Fixed rate debentures March 2018/23 | 83,938,400 | 83,938,400 | COMB/BD/22/07/23-C2404-12.00% | ||
| Fixed rate debentures March 2018/28 | 16,061,600 | 16,061,600 | COMB/BD/22/07/28-C2405-12.50% | ||
2. Performance of Securities and Returns to Shareholders
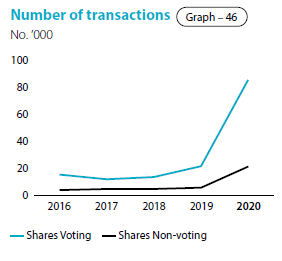
Despite the continuous lacklustre performance of the bourse, there was continued investor interest in the shares of the Bank during the year, as depicted in the increased number of transactions (Ordinary shares - Voting 300% and Ordinary shares - Non-Voting 293%) compared to 2019 (Refer Table 51). Despite the early drop due to the outbreak of the Pandemic, the CSE concluded 2020 on a mixed note, the ASPI gaining by 10.52% from 6,129 in 2019 to 6,774 by the end of 2020, while the S&P SL20 closing 2020 on a negative note, decreasing by 10.18% from 2,937 in 2019 to 2,638 by the end of 2020.
The total market capitalisation of the CSE was at Rs. 2,960.65 Bn. and was above the level at the end of 2019 (Rs. 2,851.31 Bn). Local investors have contributed to approximately 79% of the total market turnover in 2020 which is higher when compared to approximately. 63% in 2019 and 55% the year prior to that. On the foreign investment front, 2020 has recorded a net foreign outflow of Rs. 51 Bn., largely in line with the foreign fund outflow trend recorded in emerging and frontier markets. However, it is noteworthy that Sri Lankan equities attracted purchases worth Rs. 53 Bn. during 2020 by foreign investors, ending close to the Rs. 56 Bn. recorded in 2019.
The Bank index reflected a drop of 16.11% during the year 2020 compared to a marginal drop in 2019.
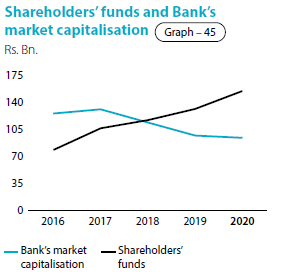
The market price of an ordinary voting share of the Bank decreased by 19.10% (a drop of 17.39% in 2019) from Rs. 95 at the end of 2019 to Rs. 80.90 at the end of 2020 (Table 48). The Bank maintained its policy of issuing scrip dividends and continued with its Employee Share Option Plans. Market capitalisation for both voting and non-voting shares in turn decreased from Rs. 97 Bn. (USD 532.699 Mn.) in 2019 to Rs. 94 Bn. (USD 500.902 Mn.) in 2020, accounting for 3.16 % (3.40% in 2019) of the total market capitalisation. The Bank's shares ranked fifth among all listed entities and first among the listed corporates in the Bank, Finance and Insurance sector. During most of 2020, the movement of the non-voting share price followed the trend of the voting shares.
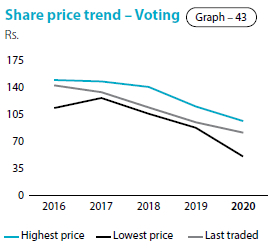
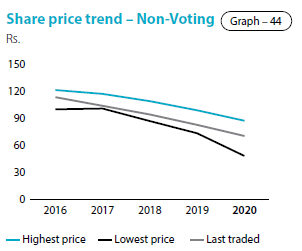
Share price of last five years
Table - 48
| 2020 Rs. |
2019 Rs. |
2018 Rs. |
2017 Rs. |
2016 Rs. |
|
| Ordinary shares - Voting | |||||
| Highest price during the year | 96.00 | 115.90 | 142.50 | 150.00 | 151.90 |
| Lowest price during the year | 50.00 | 88.60 | 107.50 | 128.50 | 115.00 |
| Last traded price | 80.90 | 95.00 | 115.00 | 135.80 | 145.00 |
| Ordinary shares - Non-voting | |||||
| Highest price during the year | 87.20 | 99.40 | 110.00 | 118.50 | 123.00 |
| Lowest price during the year | 48.00 | 74.00 | 88.00 | 102.30 | 101.50 |
| Last traded price | 70.10 | 83.00 | 95.00 | 105.00 | 115.00 |
Sustainable value for investors
Table - 49
| Ordinary shares - Voting | Ordinary shares - Non-voting | |||||
| Trade date | 2020 | 2019 | Trade date | 2020 | 2019 | |
| Rs. | Rs. | Rs. | Rs. | |||
| Highest price | 02.01.2020 | 96.00 | 02.01.2020 | 87.20 | ||
| 02.01.2019 | 115.90 | 23.01.2019 | 99.40 | |||
| Lowest price | 14.05.2020 | 50.00 | 15.05.2020 | 48.00 | ||
| 17.05.2019 | 88.60 | 16.05.2019 | 74.00 | |||
| Year end price | 80.90 | 95.00 | 70.10 | 83.00 | ||
Information on shareholders' funds and Bank's market capitalisation
Table - 50
| As at December 31, | Shareholders' funds | Commercial Bank's market capitalisation (*) |
Total market capitalisation of the CSE |
Commercial Bank's market capitalisation as a % of CSE market capitalisation |
Commercial Bank's market capitalisation ranking |
Commercia l Bank's market capitalisation (*) |
| Rs. Bn. | Rs. Bn. | Rs. Bn. | % | Rank | USD Mn. | |
| 2020 | 157 | 94 | 2,961 | 3.16 | 5 | 500.902 |
| 2019 | 133 | 97 | 2,851 | 3.40 | 4 | 532.699 |
| 2018 | 118 | 115 | 2,839 | 4.05 | 3 | 628.415 |
| 2017 | 107 | 133 | 2,899 | 4.60 | 4 | 867.670 |
| 2016 | 78 | 127 | 2,745 | 4.64 | 3 | 851.019 |
(*) Market capitalisation as at December 31, 2020, 2019, 2018 and 2017 includes both voting and non-voting shares.
Number of transactions (No.)
Table - 51
| 2020 | 2019 | 2018 | 2017 | 2016 | |
| Ordinary shares - Voting | 85,914 | 21,481 | 13,364 | 11,811 | 15,189 |
| Ordinary shares - Non-voting | 21,407 | 5,452 | 4,553 | 4,432 | 3,721 |
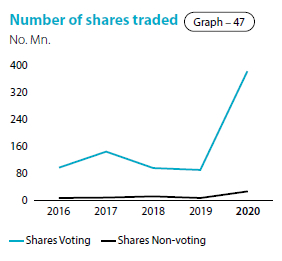
Number of shares traded (No. '000)
Table - 52
| 2020 | 2019 | 2018 | 2017 | 2016 | |
| Ordinary shares - Voting | 385,017 | 89,289 | 95,286 | 144,205 | 96,146 |
| Ordinary shares - Non-voting | 26,614 | 5,893 | 10,637 | 6,717 | 5,396 |
3. Information on movement in number of shares represented by the stated capital
(As per rule No. 7.6 (ix) of the Listing Rules of CSE)
Table - 53
| Number of shares | |||||||
| Year | Basis | Number of shares issued/ (redeemed) | Ordinary shares voting | Ordinary shares non-voting | Cumulative redeemable preference shares | ||
| 1987 | As at December 31, 1987 | 3,000,000 | - | - | |||
| 1988 | Bonus issue | Voting | 2 for 3 | 2,000,000 | 5,000,000 | - | - |
| 1990 | Bonus issue | Voting | 1 for 1 | 5,000,000 | 10,000,000 | - | - |
| 1993 | Rights issue | Voting | 1 for 4 | 2,500,000 | 12,500,000 | - | - |
| 1996 | Bonus issue | Voting | 3 for 5 | 7,500,000 | 20,000,000 | - | - |
| Rights issue | Voting | 1 for 4 | 5,000,000 | 25,000,000 | - | - | |
| Share swap | Non-voting | 894,275 | 25,000,000 | 894,275 | - | ||
| Bonus issue | Non-voting | 3 for 5 | 536,565 | 25,000,000 | 1,430,840 | - | |
| Rights issue | Non-voting | 1 for 4 | 357,710 | 25,000,000 | 1,788,550 | - | |
| 1998 | Bonus issue | Voting | 3 for 10 | 7,500,000 | 32,500,000 | 1,788,550 | - |
| Bonus issue | Non-voting | 3 for 10 | 536,565 | 32,500,000 | 2,325,115 | - | |
| 2001 | Bonus issue | Voting | 1 for 5 | 6,500,000 | 39,000,000 | 2,325,115 | - |
| Bonus issue | Non-voting | 1 for 5 | 465,023 | 39,000,000 | 2,790,138 | - | |
| Issue of cumulative redeemable preference shares | 90,655,500 | 39,000,000 | 2,790,138 | 90,655,500 | |||
| 2003 | Bonus issue | Voting | 1 for 3 | 13,000,000 | 52,000,000 | 2,790,138 | 90,655,500 |
| Rights issue | Voting | 1 for 4 | 13,000,000 | 65,000,000 | 2,790,138 | 90,655,500 | |
| Bonus issue | Non-voting | 1 for 3 | 930,046 | 65,000,000 | 3,720,184 | 90,655,500 | |
| Rights issue | Non voting | 1 for 4 | 930,046 | 65,000,000 | 4,650,230 | 90,655,500 | |
| Issue of cumulative redeemable preference shares | 100,000,000 | 65,000,000 | 4,650,230 | 190,655,500 | |||
| 2004 | ESOP | Voting | 29,769 | 65,029,769 | 4,650,230 | 190,655,500 | |
| 2005 | ESOP | Voting | 1,361,591 | 66,391,360 | 4,650,230 | 190,655,500 | |
| Bonus issue | Voting | 1 for 1 | 66,389,162 | 132,780,522 | 4,650,230 | 190,655,500 | |
| Bonus issue | Non-voting | 1 for 1 | 4,650,230 | 132,780,522 | 9,300,460 | 190,655,500 | |
| 2006 | ESOP | Voting | 737,742 | 133,518,264 | 9,300,460 | 190,655,500 | |
| Redemption of cumulative redeemable preference shares | (90,655,500) | 133,518,264 | 9,300,460 | 100,000,000 | |||
| 2007 | Rights issue | Voting | 3 for 10 | 40,288,996 | 173,807,260 | 9,300,460 | 100,000,000 |
| Bonus issue | Voting | 1 for 3 | 58,204,268 | 232,011,528 | 9,300,460 | 100,000,000 | |
| ESOP | Voting | 919,649 | 232,931,177 | 9,300,460 | 100,000,000 | ||
| Rights issue | Non-voting | 3 for 10 | 2,790,138 | 232,931,177 | 12,090,598 | 100,000,000 | |
| Bonus issue | Non-voting | 1 for 3 | 4,030,199 | 232,931,177 | 16,120,797 | 100,000,000 | |
| 2008 | Redemption of cumulative redeemable preference shares | (100,000,000) | 232,931,177 | 16,120,797 | - | ||
| ESOP | Voting | 350,049 | 233,281,226 | 16,120,797 | - | ||
| 2009 | ESOP | Voting | 540,045 | 233,821,271 | 16,120,797 | - | |
| 2010 | Share split | Voting | 1 for 2 | 117,402,608 | 351,223,879 | 16,120,797 | - |
| Share split | Non-voting | 1 for 2 | 8,060,398 | 351,223,879 | 24,181,195 | - | |
| ESOP | Voting | 2,081,508 | 353,305,387 | 24,181,195 | - | ||
| 2011 | Scrip issue for final dividend 2010 | Voting | Rs. 2.00 per share | 2,277,195 | 355,582,582 | 24,181,195 | - |
| Scrip issue for final dividend 2010 | Non-voting | 255,734 | 355,582,582 | 24,436,929 | - | ||
| ESOP | Voting | 1,457,645 | 357,040,227 | 24,436,929 | - | ||
| Rights issue | Voting | 1 for 14 | 25,502,433 | 382,542,660 | 24,436,929 | - | |
| Rights issue | Non-voting | 1 for 14 | 1,745,494 | 382,542,660 | 26,182,423 | - | |
| Share split | Voting | 1 for 1 | 382,542,660 | 765,085,320 | 26,182,423 | - | |
| Share split | Non-voting | 1 for 1 | 26,182,423 | 765,085,320 | 52,364,846 | - | |
| 2012 | Scrip issue for final dividend 2011 | Voting | Rs. 2.00 per share | 13,587,144 | 778,672,464 | 52,364,846 | - |
| Scrip issue for final dividend 2011 | Non-voting | 1,108,902 | 778,672,464 | 53,473,748 | - | ||
| ESOP | Voting | 1,341,768 | 780,014,232 | 53,473,748 | - | ||
| 2013 | Scrip issue for final dividend 2012 | Voting | Rs. 2.00 per share | 13,076,189 | 793,090,421 | 53,473,748 | - |
| Scrip issue for final dividend 2012 | Non-voting | 1,069,474 | 793,090,421 | 54,543,222 | - | ||
| ESOP | Voting | 1,445,398 | 794,535,819 | 54,543,222 | - | ||
| 2014 | Scrip issue for final dividend 2013 | Voting | Rs. 2.00 per share | 12,504,344 | 807,040,163 | 54,543,222 | - |
| Scrip issue for final dividend 2013 | Non-voting | 1,036,724 | 807,040,163 | 55,579,946 | - | ||
| ESOP | Voting | 3,237,566 | 810,277,729 | 55,579,946 | - | ||
| 2015 | Scrip issue for final dividend 2014 | Voting | Rs. 2.00 per share | 8,118,773 | 818,396,502 | 55,579,946 | - |
| Scrip issue for final dividend 2014 | Non-voting | 719,740 | 818,396,502 | 56,299,686 | - | ||
| ESOP | Voting | 2,170,613 | 820,567,115 | 56,299,686 | - | ||
| 2016 | Scrip issue for final dividend 2015 | Voting | Rs. 2.00 per share | 11,818,040 | 832,385,155 | 56,299,686 | - |
| Scrip issue for final dividend 2015 | Non-voting | 912,967 | 832,385,155 | 57,212,653 | - | ||
| ESOP | Voting | 1,136,732 | 833,521,887 | 57,212,653 | - | ||
| 2017 | Scrip issue for final dividend 2016 | Voting | Rs. 2.00 per share | 10,521,802 | 844,043,689 | 57,212,653 | - |
| Scrip issue for final dividend 2016 | Non-voting | 903,357 | 844,043,689 | 58,116,010 | - | ||
| Rights issue | Voting | 1 for 10 | 84,649,465 | 928,693,154 | 58,116,010 | - | |
| Rights issue | Non-voting | 1 for 10 | 5,811,601 | 928,693,154 | 63,927,611 | - | |
| ESOP | Voting | 3,278,537 | 931,971,691 | 63,927,611 | - | ||
| 2018 | Scrip issue for final dividend 2017 | Voting | Rs. 2.00 per share | 11,998,388 | 943,970,079 | 63,927,611 | - |
| Scrip issue for final dividend 2017 | Non-voting | 1,085,563 | 943,970,079 | 65,013,174 | - | ||
| ESOP | Voting | 1,739,324 | 945,709,403 | 65,013,174 | - | ||
| 2019 | Scrip issue for final dividend 2018 | Voting | Rs. 2.00 per share | 15,249,529 | 960,958,932 | 65,013,174 | - |
| Scrip issue for final dividend 2018 | Non-voting | 1,241,095 | 960,958,932 | 66,254,269 | - | ||
| ESOP | Voting | 293,385 | 961,252,317 | 66,254,269 | - | ||
| 2020 | Scrip issue for final dividend 2019 | Voting | Rs. 2.00 per share | 22,485,434 | 983,737,751 | 66,254,269 | - |
| Scrip issue for final dividend 2019 | Non Voting | 1,716,432 | 983,737,751 | 67,970,701 | - | ||
| Issue of shares via a Private Placement | Voting | 115,157,186 | 1,098,934,937 | 67,970,701 | - | ||
4. Dividends
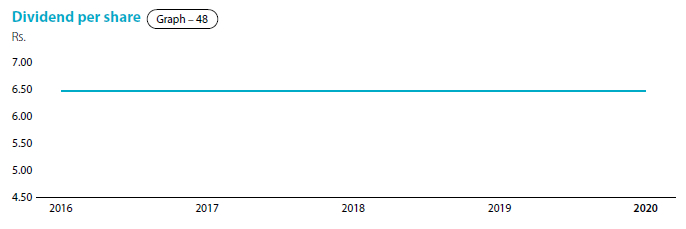
The declaration of a dividend should always ensure that a balance between the shareholders' needs and the business needs of the Bank is maintained. Although the Bank has been paying interim dividends in the past, for the year under review, the Bank did not pay any interim dividends. This was in compliance with the Banking Act Direction No. 03 of 2020, dated May 13, 2020, issued by the CBSL on 'Restrictions on Discretionary Payments of Licenced Banks', wherein licenced banks were requested to refrain from declaring cash dividends not already declared for financial year 2019, and any interim cash dividends for the financial year 2020 in view of the possible adverse impact on liquidity and other key performance indicators of banks. However, as per the Banking Act Direction No. 01 of 2021, dated January 19, 2021, issued by the CBSL on the same subject, licenced banks incorporated or established in Sri Lanka were instructed to defer payment of cash dividends until the financial statements for the year 2020 are finalised and audited by the external auditors. Accordingly, the Board of Directors of the Bank has now recommended a final dividend of Rs. 6.50 per ordinary share for both ordinary voting and non-voting shares of the Bank. This will be paid in the form of a cash dividend of Rs. 4.50 per share and Rs. 2.00 per share by the issue and allotment of new shares for both voting and non-voting shareholders of the Bank for the year ended December 31, 2020. It will be submitted for the approval of the shareholders at the 52nd AGM, to be held on March 30, 2021.
(A dividend of Rs. 6.50 per share was declared and paid by the Bank for the year ended December 31, 2019. It too consisted of a cash dividend of Rs. 4.50 per share and balance entitlement of Rs. 2.00 per share satisfied in the form of issue and allotment of new shares).
Dividends information
Table - 54
| Dividends | 2020 | 2019 | 2018 | 2017 | 2016 |
| Cash - Rs. Per share | |||||
| First interim paid | - | 1.50 | 1.50 | 1.50 | 1.50 |
| Second interim paid | - | 3.00 | 3.00 | 3.00 | 3.00 |
| Final proposed | 4.50 | - | - | - | - |
| Total | 4.50 | 4.50 | 4.50 | 4.50 | 4.50 |
| Scrip - Rs. Per share | |||||
| Final proposed/allotted | 2.00 | 2.00 | 2.00 | 2.00 | 2.00 |
| Total | 6.50 | 6.50 | 6.50 | 6.50 | 6.50 |
| Dividend payout ratio (%) | |||||
| Cash | 32.07 | 27.16 | 25.92 | 26.42 | 27.64 |
| Total (cash and shares) | 46.33 | 39.23 | 37.44 | 38.17 | 39.94 |
5. Shareholders
The Bank had 16,820 ordinary voting shareholders and 5,786 ordinary non-voting shareholders as at December 31, 2020 compared to 12,268 and 4,673 voting and non-voting shareholders as at December 31, 2019 (Tables 56 and Tables 57). With five new investors joining ranks, the percentage of ordinary voting shares held by the 20 largest shareholders increased to 71.96 % from 53.98% in 2019. A rise was also recorded in the non-voting ordinary shares held by the 20 largest shareholders to 38.22.% in 2020 from 32.24% in 2019.
Number of ordinary shareholders
Table - 55
| As at December 31, | 2020 | 2019 |
| Ordinary shareholders - Voting | 16,820 | 12,268 |
| Ordinary shareholders - Non-voting | 5,786 | 4,673 |
| Total | 22,606 | 16,941 |
5.1 Composition of shareholders
Table - 56
| As at December 31, 2020 | As at December 31, 2019 | |||||||
| No. of shareholders | % | No. of shares | % | No. of shareholders | % | No. of shares | % | |
| Ordinary shares - Voting | ||||||||
| Resident | 16,534 | 98.30 | 838,880,863 | 76.34 | 11,979 | 97.64 | 680,500,179 | 70.79 |
| Non-resident | 286 | 1.70 | 260,054,074 | 23.66 | 289 | 2.36 | 280,752,138 | 29.21 |
| Total | 16,820 | 100.00 | 1,098,934,937 | 100.00 | 12,268 | 100.00 | 961,252,317 | 100.00 |
| Individuals | 16,096 | 95.70 | 301,468,333 | 27.43 | 11,599 | 94.55 | 217,888,250 | 22.67 |
| Institutions | 724 | 4.30 | 797,466,604 | 72.57 | 669 | 5.45 | 743,364,067 | 77.33 |
| Total | 16,820 | 100.00 | 1,098,934,937 | 100.00 | 12,268 | 100.00 | 961,252,317 | 100.00 |
| Ordinary shares - Non-voting | ||||||||
| Resident | 5,707 | 98.63 | 63,316,978 | 93.15 | 4,600 | 98.44 | 52,731,695 | 79.59 |
| Non-resident | 79 | 1.37 | 4,653,723 | 6.85 | 73 | 1.56 | 13,522,574 | 20.41 |
| Total | 5,786 | 100.00 | 67,970,701 | 100.00 | 4,673 | 100.00 | 66,254,269 | 100.00 |
| Individuals | 5,537 | 95.70 | 45,572,024 | 67.05 | 4,448 | 95.19 | 37,265,740 | 56.25 |
| Institutions | 249 | 4.30 | 22,398,677 | 32.95 | 225 | 4.81 | 28,988,529 | 43.75 |
| Total | 5,786 | 100.00 | 67,970,701 | 100.00 | 4,673 | 100.00 | 66,254,269 | 100.00 |
5.2 Distribution schedule of number of shareholders and percentage of holding in each class of equity securities
(As per Rule No. 7.6 (x) of the Listing Rules of CSE)
Table - 57
| As at December 31, 2020 | As at December 31, 2019 | |||||||
| Number of shareholders | % | Number of shares | % | Number of shareholders | % | Number of shares | % | |
| Ordinary shares - Voting | ||||||||
| 1 - 1,000 | 8,801 | 52.32 | 2,308,178 | 0.21 | 6,587 | 53.69 | 1,561,344 | 0.16 |
| 1,001 - 10,000 | 5,441 | 32.35 | 19,304,413 | 1.76 | 3,687 | 30.05 | 13,254,119 | 1.38 |
| 10,001 - 100,000 | 2,139 | 12.72 | 60,718,288 | 5.53 | 1,628 | 13.27 | 45,723,643 | 4.76 |
| 100,001 - 1,000,000 | 364 | 2.16 | 95,838,529 | 8.72 | 282 | 2.30 | 74,521,795 | 7.75 |
| Over 1,000,000 | 75 | 0.45 | 920,765,529 | 83.78 | 84 | 0.69 | 826,191,416 | 85.95 |
| Total | 16,820 | 100.00 | 1,098,934,937 | 100.00 | 12,268 | 100.00 | 961,252,317 | 100.00 |
| Ordinary shares - Non-voting | ||||||||
| 1 - 1,000 | 3,161 | 54.63 | 810,631 | 1.19 | 2,561 | 54.80 | 608,395 | 0.92 |
| 1,001 - 10,000 | 1,863 | 32.20 | 6,341,366 | 9.33 | 1,480 | 31.67 | 5,037,000 | 7.60 |
| 10,001 - 100,000 | 654 | 11.30 | 18,176,361 | 26.74 | 532 | 11.38 | 15,054,584 | 22.72 |
| 100,001 - 1,000,000 | 99 | 1.71 | 24,419,830 | 35.93 | 93 | 1.99 | 23,501,033 | 35.47 |
| Over 1,000,000 | 9 | 0.16 | 18,222,513 | 26.81 | 7 | 0.16 | 22,053,257 | 33.29 |
| Total | 5,786 | 100.00 | 67,970,701 | 100.00 | 4,673 | 100.00 | 66,254,269 | 100.00 |
5.3 Public Shareholding
(As per 7.6 (iv) and 7.13.1 of the Listing Rules)
Table - 58
| 2020 | 2019 | |||
| Number | % | Number | % | |
| Number of Shareholders representing the public holding (Voting) | 16,785 | 99.80 | 12,234 | 99.76 |
| Number of Shareholders representing the public holding (Non Voting) | 5,781 | 99.84 | 4,663 | 86.62 |
| Float Adjusted Market Capitalization Rs.Bn - (Compliant under Option 1) | 93 | 96 | ||
5.4 The names, number and percentage of shares held by the twenty largest shareholders (As per Rule No. 7.6 (iii) of the Listing Rules of CSE)
Voting shareholders
Table - 59
| As at December 31, | 2020 | 2019* | |||
| Ordinary shares - Voting | Number of shares | % | Number of shares | % | |
| 1. | DFCC Bank PLC A/C 1 | 132,119,619 | 12.02 | 82,560,377 | 8.59 |
| 2. | Mr Y S H I Silva | 97,441,255 | 8.87 | 77,604,815 | 8.07 |
| 3. | Employees Provident Fund | 94,723,763 | 8.62 | 92,558,649 | 9.63 |
| 4. | CB NY S/A International Finance Corporation | 78,208,480 | 7.12 | 42,651,626 | 4.44 |
| 5. | Sri Lanka Insurance Corporation Ltd. - Life Fund | 61,403,691 | 5.59 | 47,345,380 | 4.93 |
| 6. | Citibank Newyork S/A Norges Bank Account 2 | 45,759,984 | 4.16 | 21,973,486 | 2.29 |
| 7. | Melstacorp PLC | 45,483,957 | 4.14 | 44,444,324 | 4.62 |
| 8. | CB NY S/A IFC Emerging Asia Fund. LP | 40,319,015 | 3.67 | - | - |
| 9. | CB NY S/A IFC Financial Intitutions Growth Fund LP | 40,319,015 | 3.67 | - | - |
| 10. | Sri Lanka Insurance Corporation Ltd. - General Fund | 38,906,463 | 3.54 | 37,506,430 | 3.89 |
| 11. | Mr D P Pieris | 21,003,054 | 1.91 | 228,626 | 0.02 |
| 12. | Employees Trust Fund Board | 19,159,319 | 1.74 | 18,020,355 | 1.87 |
| 13. | Mrs L E M Yaseen | 17,077,784 | 1.55 | 16,538,000 | 1.72 |
| 14. | Renuka Hotels PLC | 9,893,069 | 0.90 | 9,666,942 | 1.01 |
| 15. | Mr M J Fernando | 9,882,761 | 0.90 | 9,181,964 | 0.96 |
| 16. | BP2S London-Asia Dragon Trust PLC | 9,093,567 | 0.83 | - | - |
| 17. | Renuka Consultants & Services Limited | 8,631,578 | 0.79 | 8,414,742 | 0.88 |
| 18. | Hallsville Trading Group INC. | 7,564,706 | 0.69 | 3,170,942 | 0.33 |
| 19. | BNYMSANV RE - LF Ruffer Investment Funds: LF Ruffer Pacific and Emerging Market Fund | 7,219,310 | 0.66 | 7,054,298 | 0.73 |
| 20. | Seylan Bank PLC/Andaradeniya Estate (PVT) LTD | 6,586,740 | 0.60 | - | - |
| Sub total | 790,797,130 | 71.96 | 518,920,956 | 53.98 | |
| Other shareholders | 308,137,807 | 28.04 | 442,331,361 | 46.02 | |
| Total | 1,098,934,937 | 100.00 | 961,252,317 | 100.00 | |
* Comparative shareholdings as at December 31, 2019 of the twenty largest shareholders as at December 31, 2020.
Non-voting shareholders
Table 60
| As at December 31, | 2020 | 2019* | |||
| Ordinary shares - Non-voting | Number of shares | % | Number of shares | % | |
| 1. | Employees Trust Fund Board | 5,287,676 | 7.78 | 5,154,149 | 7.78 |
| 2. | Akbar Brothers (Pvt) Ltd. A/C No. 01 | 3,117,457 | 4.59 | 2,756,839 | 4.16 |
| 3. | Deutsche Bank AG As Trustee To Assetline Income Plus Growth Fund | 1,770,354 | 2.60 | - | - |
| 4. | GF Capital Global Limited | 1,757,304 | 2.59 | 1,712,928 | 2.59 |
| 5. | Mr A H Munasinghe | 1,651,143 | 2.43 | 309,448 | 0.47 |
| 6. | Mr M F Hashim | 1,282,270 | 1.89 | 1,087,247 | 1.64 |
| 7. | Serendip Investments Limited | 1,167,646 | 1.72 | 1,494,489 | 2.26 |
| 8. | M.J.F. Exports (Pvt) Ltd | 1,162,757 | 1.71 | 1,133,395 | 1.71 |
| 9. | Mrs L V C Samarasinha | 1,025,906 | 1.51 | 891,208 | 1.35 |
| 10. | Saboor Chatoor (Pvt) Ltd | 947,600 | 1.39 | 909,646 | 1.37 |
| 11. | Mr E Chatoor | 805,000 | 1.18 | 434,381 | 0.66 |
| 12. | Mr M J Fernando | 801,511 | 1.18 | 730,734 | 1.10 |
| 13. | Mr T W A Wickramasinghe | 780,000 | 1.15 | 740,000 | 1.12 |
| 14. | Mr J D Bandaranayake , Ms N Bandaranayake and Dr V Bandaranayake (Joint) | 723,540 | 1.06 | 648,153 | 0.98 |
| 15. | Mr R Gautam | 708,999 | 1.04 | 623,919 | 0.94 |
| 16. | Mr J D Bandaranayake, Dr V Bandaranayake and Ms I Bandaranayake (Joint) | 702,474 | 1.03 | 627,619 | 0.95 |
| 17. | Mr K S M De Silva | 626,249 | 0.92 | 567,298 | 0.86 |
| 18. | Mr J G De Mel | 590,000 | 0.87 | 523,547 | 0.79 |
| 19. | Mr G R Mallawaaratchy and Mrs B G P Mallawaaratchy (Joint) | 569,975 | 0.84 | 555,582 | 0.84 |
| 20. | Mr A L Gooneratne | 500,628 | 0.74 | 446,072 | 0.67 |
| Sub total | 25,978,489 | 38.22 | 21,346,654 | 32.24 | |
| Other shareholders | 41,992,212 | 61.78 | 44,907,615 | 67.76 | |
| Total | 67,970,701 | 100.00 | 66,254,269 | 100.00 | |
* Comparative shareholdings as at December 31, 2019 of the twenty largest shareholders as at December 31, 2020.
5.5 Directors' shareholding including the Chief Executive Officer's shareholding (As per Rule No. 7.6 (v) of the Listing Rules of CSE)
Table - 61
| Ordinary shares - Voting | Ordinary shares - Non-voting | |||
| 2020 | 2019 | 2020 | 2019 | |
| Justice K. Sripavan - Chairman ° | 14,000 | Nil | Nil | Nil |
| Prof A K W Jayawardane - Deputy Chairman °° | 12,792 | Nil | Nil | Nil |
| Mr S Renganathan - Managing Director/Chief Executive Officer | 362,010 | 353,736 | 12,457 | 12,143 |
| Mr S C U Manatunge | 71,410 | 69,778 | Nil | Nil |
| Mr K Dharmasiri | Nil | Nil | Nil | Nil |
| Mr L D Niyangoda | Nil | Nil | Nil | Nil |
| Ms N T M S Cooray | 342,465 | 193,062 | 52,875 | 51,540 |
| Mr T L B Hurulle | Nil | Nil | Nil | Nil |
| Ms J Lee °°° | Nil | Nil | Nil | Nil |
| Mr R Senanayake °°°° | Nil | Nil | Nil | Nil |
| Mr K G D D Dheerasinghe * | 24,821 | 24,254 | Nil | Nil |
| Mr M P Jayawardena** | Nil | Nil | Nil | Nil |
| Mr S Swarnajothi *** | Nil | Nil | Nil | 11,152 |
* Relinquished office w.e.f. December 21, 2020,
** Relinquished office w.e.f. December29, 2020,
*** Retired w.e.f. August 20, 2020
° Appointed as Chairman w.e.f. December 21, 2020,
°° Appointed as Deputy Chairman w.e.f. December 29, 2020
°°° Appointed as a Director w.e.f. August 13, 2020,
°°°° Appointed as a Director w.e.f. September 16, 2020
6. Engaging with shareholders
During the year, the Bank complied with its shareholder communication policy. This policy outlines the various formal channels through which it engages with shareholders. It covers the timely communication of quarterly performance as set out on pages 304 to 309 It also records significant events that may reasonably be expected to impact the share price. (More details are given in Financial Calendar)
7. Material foreseeable risk factors
(As per Rule No. 7.6 (vi) of the Listing Rules of the CSE)
Information pertaining to the material foreseeable risk factors, that require disclosures as per the Rule No. 7.6 (vi) of the Listing Rules of the CSE is discussed in the Section on "Risk Governance and Management".
8. Material issues pertaining to employees and industrial relations pertaining to the Bank
(As per Rule No. 7.6 (vii) of the Listing Rules of the CSE)
During the year under review there were no material issues relating to employees and industrial relations pertaining to the Bank which warrant disclosure.
9. Quarterly performance in 2020 compared to 2019
(As per Rule No. 7.4 (a) (i) of the Listing Rules of the CSE)
The Bank duly submitted the Interim Financial Statements for the year 2020 to the CSE within applicable statutory deadlines. (The Bank duly complied with this requirement for 2019). Please refer "Financial Calendar" for further details. A Summary of the Income Statement and the Statement of Financial Position depicting quarterly performance during 2020 together with comparatives for 2019 is given on pages 304 and 309 for the information of stakeholders.
The Audited Income Statement for the year ended December 31, 2020 and the Audited Statement of Financial Position as at December 31, 2020 will be submitted to the CSE within three months from the year end, which is well within the required deadline as required by Rule No. 7.5 (a) of the Listing Rules of the CSE. (The Bank duly complied with this requirement for 2019).
This Annual Report in its entirety is available on the Bank's website (http://www.combank.lk/newweb/en/investors).
Shareholders may also elect to receive a hard copy of the Annual Report on request. The Company Secretary of the Bank will respond to individual letters received from shareholders.
10. Debt securities
Details of debentures issued by the Bank is as shown below:
10.1 Debenture Composition
Table - 62
| Fixed Interest Rate | Fixed Interest Rate | Fixed Interest Rate | Fixed Interest Rate | Fixed Interest Rate | ||||||||||||||||||
| 2020 | 2019 | 2019 | 2018 | 2017 | ||||||||||||||||||
| Type of Issue | Public | Public | Public | Public | Public | Public | Public | Public | Public | Public | Public | Public | Public | Public | Public | Public | Public | Public | Public | Public | Public | Public |
| Debenture Type | Type "A" | Type "B" | Type "A" | Type "B" | Type "A" | Type "B" | Type "B" | Type "A" | Type "B" | Type "A" | Type "A" | Type "B" | Type "A" | Type "B" | Type "A" | Type "B" | Type "A" | Type "B" | Type "A" | Type "B" | Type "A" | Type "B" |
| CSE Listing | Listed | Listed | Listed | Listed | Listed | Listed | Listed | Listed | Listed | Listed | Listed | Listed | Listed | Listed | Listed | Listed | Listed | Listed | Listed | Listed | Listed | Listed |
| Issue Date | 9-Mar-16 | 9-Mar-16 | 28-Oct-16 | 28-Oct-16 | 23-Jul-18 | 23-Jul-18 | 9-Mar-16 | 9-Mar-16 | 28-Oct-16 | 28-Oct-16 | 23-Jul-18 | 23-Jul-18 | 9-Mar-16 | 9-Mar-16 | 28-Oct-16 | 28-Oct-16 | 23-Jul-18 | 23-Jul-18 | 9-Mar-16 | 9-Mar-16 | 28-Oct-16 | 28-Oct-16 |
| Maturity Date | 8-Mar-21 | 8-Mar-26 | 27-Oct-21 | 27-Oct-26 | 22-Jul-23 | 22-Jul-28 | 8-Mar-21 | 8-Mar-26 | 27-Oct-21 | 27-Oct-26 | 22-Jul-23 | 22-Jul-28 | 8-Mar-21 | 8-Mar-26 | 27-Oct-21 | 27-Oct-26 | 22-Jul-23 | 22-Jul-28 | 8-Mar-21 | 8-Mar-26 | 27-Oct-21 | 27-Oct-26 |
| Interest Payable Frequency | Bi-Annually | Bi-Annually | Bi-Annually | Bi-Annually | Bi-Annually | Bi-Annually | Bi-Annually | Bi-Annually | Bi-Annually | Bi-Annually | Bi-Annually | Bi-Annually | Bi-Annually | Bi-Annually | Bi-Annually | Bi-Annually | Bi-Annually | Bi-Annually | Bi-Annually | Bi-Annually | Bi-Annually | Bi-Annually |
| Offered Interest Rate | 10.75% p.a. | 11.25% p.a. | 12.00% p.a. | 12.25% p.a. | 12.00% p.a. | 12.50% p.a. | 10.75% p.a. | 11.25% p.a. | 12.00% p.a. | 12.25% p.a. | 12.00% p.a. | 12.50% p.a. | 10.75% p.a. | 11.25% p.a. | 12.00% p.a. | 12.25% p.a. | 12.00% p.a. | 12.50% p.a. | 10.75% p.a. | 11.25% p.a. | 12.00% p.a. | 12.25% p.a. |
| Amount (Rs. Mn.) | 4,430.34 | 1,749.09 | 5,071.80 | 1,928.20 | 8,393.84 | 1,606.16 | 4,430.34 | 1,749.09 | 5,071.80 | 1,928.20 | 8,393.84 | 1,606.16 | 4,430.34 | 1,749.09 | 5,071.80 | 1,928.20 | 8,393.84 | 1,606.16 | 4,430.34 | 1,749.09 | 5,071.80 | 1,928.20 |
| Market Values | ||||||||||||||||||||||
| - Highest (Rs.) | 100.49 | 100.00 | Not traded during the year | Not traded during the year | Not traded during the year | 100.00 | 90.00 | 100.00 | 90.00 | Not traded during the year | Not traded during the year | Not traded during the year | Not traded during the year | 100.00 | 102.66 | Not traded during the year | Not traded during the year | Not traded during the year | 85.33 | Not traded during the year | 96.00 | Not traded during the year |
| - Lowest (Rs.) | 100.00 | 95.00 | 100.00 | 90.00 | 100.00 | 90.00 | 90.00 | 99.96 | 81.40 | 87.17 | ||||||||||||
| - Year-end (Rs.) | 100.49 | 95.00 | 100.00 | 90.00 | 100.00 | 90.00 | 90.00 | 102.66 | 81.40 | 87.17 | ||||||||||||
| Interest Rates | ||||||||||||||||||||||
| - Coupon Rate (%) | 10.75 | 11.25 | 12.00 | 12.25 | 12.00 | 12.50 | 10.75 | 11.25 | 12.00 | 12.25 | 12.00 | 12.50 | 10.75 | 11.25 | 12.00 | 12.25 | 12.00 | 12.50 | 10.75 | 11.25 | 12.00 | 12.25 |
| - Effective Annual Yield (%) | 11.04 | 11.57 | 12.36 | 12.63 | 12.36 | 12.89 | 11.04 | 11.57 | 12.36 | 12.63 | 12.36 | 12.89 | 11.04 | 11.57 | 12.36 | 12.63 | 12.36 | 12.89 | 11.04 | 11.57 | 12.36 | 12.63 |
| Interest rate of comparable Government Security (%) |
4.70 | 6.75 | 5.00 | 6.80 | 5.95 | 7.15 | 8.55 | 9.90 | 8.70 | 9.90 | 9.40 | 10.10 | 11.30 | 11.65 | 11.50 | 11.80 | 11.65 | 11.85 | 9.70 | 10.10 | 9.80 | 10.10 |
| Other Ratios as at date of last trade | ||||||||||||||||||||||
| - Interest Yield (%) | 9.80 | 12.43 | N/A | N/A | N/A | 12.49 | 16.57 | 11.24 | 16.86 | N/A | N/A | N/A | N/A | 13.45 | 11.02 | N/A | N/A | N/A | 17.96 | N/A | 15.98 | N/A |
| - Yield to Maturity (%) | 9.86 | 12.37 | N/A | N/A | N/A | 12.50 | 16.32 | 11.25 | 16.64 | N/A | N/A | N/A | N/A | 13.30 | 11.06 | N/A | N/A | N/A | 17.52 | N/A | 15.74 | N/A |
10.2 Other ratios
Table - 63
| 2020 | 2019 | |
| Debt equity ratio (%) | 35.51 | 38.97 |
| Net assets value per share (Rs.) | 134.67 | 129.60 |
| Interest cover (Times) | 10.37 | 8.54 |
| Liquid assets ratio (%) (Minimum 20%) | ||
| Domestic Banking Unit (DBU) | 44.99 | 30.42 |
| Off-shore Banking Unit (OBU) | 32.70 | 25.25 |
11. Credit ratings
11.1 National long-term ratings
Fitch Ratings Lanka Ltd., has revised the National Long-term Rating of the Sri Lankan financial institutions following the recalibration of its Sri Lankan national rating scale. As a result, Fitch Ratings revised the National Long-term rating of the Bank to AA-(lka) from AA+(lka) and its outlook from negative to stable in January 2021.
The Bank's Bangladesh Operation's credit rating was reaffirmed at AAA by Credit Rating Information Services Ltd in May 2020 for the 10th consecutive year.
11.2 Credit ratings - Debentures
The credit rating of the Bank's Subordinated Debentures was also revised to A(lka) from AA-(lka) by Fitch Ratings Lanka Ltd.
Summary of the Income Statements - Group and Bank - 2019 and 2020
Table - 64
| 1st Quarter ended March 31 | 2nd Quarter ended June 30 | 3rd Quarter ended September 30 | 4th Quarter ended December 31 | Total | |||||||
| 2020 Rs. '000 |
2019 Rs. '000 |
2020 Rs. '000 |
2019 Rs. '000 |
2020 Rs. '000 |
2019 Rs. '000 |
2020 Rs. '000 |
2019 Rs. '000 |
2020 Rs. '000 |
2019 Rs. '000 |
||
| Group | Group | ||||||||||
| Net interest income | 12,782,660 | 12,119,820 | 9,984,100 | 12,025,716 | 14,029,002 | 12,277,968 | 14,073,040 | 11,932,887 | 50,868,802 | 48,356,391 | Net interest income |
| Net fee and commission income | 2,447,061 | 2,447,840 | 1,640,638 | 2,390,610 | 2,672,054 | 2,840,646 | 3,061,922 | 3,072,742 | 9,821,675 | 10,751,838 | Net fee and commission income |
| Other operating income (net) | 4,618,052 | 550,539 | 3,964,571 | 2,583,027 | 3,679,491 | 2,670,120 | 3,776,897 | 2,774,733 | 16,039,011 | 8,578,419 | Other operating income (net) |
| Less: Impairment charges and other losses | 6,653,253 | 1,896,313 | 2,607,571 | 3,630,501 | 7,471,776 | 3,017,776 | 4,686,932 | 2,786,933 | 21,419,532 | 11,331,523 | Less: Impairment charges and other losses |
| Net operating income | 13,194,520 | 13,221,886 | 12,981,738 | 13,368,852 | 12,908,771 | 14,770,958 | 16,224,927 | 14,993,429 | 55,309,956 | 56,355,125 | Net operating income |
| Less: Expenses | 7,755,912 | 8,204,593 | 7,303,047 | 8,041,586 | 7,634,075 | 8,380,022 | 8,100,960 | 8,755,020 | 30,793,994 | 33,381,221 | Less: Expenses |
| Operating profit | 5,438,608 | 5,017,293 | 5,678,691 | 5,327,266 | 5,274,696 | 6,390,936 | 8,123,967 | 6,238,409 | 24,515,962 | 22,973,904 | Operating profit |
| Add: Share of profits/(losses) of associate companies | (914) | 1,343 | 177 | 4,529 | 2,665 | 3,636 | 1,970 | 484 | 3,898 | 9,992 | Add: Share of profits/(losses) of associate companies |
| Profit before income tax | 5,437,694 | 5,018,636 | 5,678,868 | 5,331,795 | 5,277,361 | 6,394,572 | 8,125,937 | 6,238,893 | 24,519,860 | 22,983,896 | Profit before income tax |
| Less: Income tax expense | 1,623,311 | 1,827,824 | 2,045,674 | 1,850,007 | 1,549,657 | 1,548,871 | 2,214,421 | 336,798 | 7,433,063 | 5,563,500 | Less: Income tax expense |
| Profit for the period | 3,814,383 | 3,190,812 | 3,633,194 | 3,481,788 | 3,727,704 | 4,845,701 | 5,911,516 | 5,902,095 | 17,086,797 | 17,420,396 | Profit for the period |
| Quarterly profit as a percentage of the profit after tax | 22.3 | 18.3 | 21.3 | 20.0 | 21.8 | 27.8 | 34.6 | 33.9 | 100.0 | 100.0 | Quarterly profit as a percentage of the profit after tax |
| Cumulative quarterly profit as a percentage of the profit after tax | 22.3 | 18.3 | 43.6 | 38.3 | 65.4 | 66.1 | 100.0 | 100.0 | - | - | Cumulative quarterly profit as a percentage of the profit after tax |
| 1st Quarter ended March 31 | 2nd Quarter ended June 30 | 3rd Quarter ended September 30 | 4th Quarter ended December 31 | Total | |||||||
| 2020 Rs. '000 |
2019 Rs. '000 |
2020 Rs. '000 |
2019 Rs. '000 |
2020 Rs. '000 |
2019 Rs. '000 |
2020 Rs. '000 |
2019 Rs. '000 |
2020 Rs. '000 |
2019 Rs. '000 |
||
| Bank | Bank | ||||||||||
| Net interest income | 12,425,953 | 11,881,071 | 9,701,778 | 11,758,079 | 13,762,118 | 11,991,650 | 13,681,492 | 11,577,472 | 49,571,341 | 47,208,272 | Net interest income |
| Net fee and commission income | 2,293,173 | 2,335,343 | 1,527,747 | 2,337,977 | 2,540,162 | 2,741,978 | 2,895,323 | 2,874,214 | 9,256,405 | 10,289,512 | Net fee and commission income |
| Other operating income (net) | 4,600,441 | 460,042 | 4,039,888 | 2,573,614 | 3,686,508 | 2,641,059 | 3,785,715 | 2,845,445 | 16,112,552 | 8,520,160 | Other operating income (net) |
| Less: Impairment charges and other losses | 6,544,696 | 1,852,370 | 2,895,956 | 3,515,041 | 7,441,088 | 2,955,795 | 4,601,958 | 2,738,260 | 21,483,698 | 11,061,466 | Less: Impairment charges and other losses |
| Net operating income | 12,774,871 | 12,824,086 | 12,373,457 | 13,154,629 | 12,547,700 | 14,418,892 | 15,760,572 | 14,558,871 | 53,456,600 | 54,956,478 | Net operating income |
| Less: Expenses | 7,546,314 | 8,049,713 | 7,155,931 | 7,882,695 | 7,427,613 | 8,177,767 | 7,815,430 | 8,507,198 | 29,945,288 | 32,617,373 | Less: Expenses |
| Profit before income tax | 5,228,557 | 4,774,373 | 5,217,526 | 5,271,934 | 5,120,087 | 6,241,125 | 7,945,142 | 6,051,673 | 23,511,312 | 22,339,105 | Profit before income tax |
| Less: Income tax expense | 1,521,991 | 1,751,497 | 1,962,981 | 1,828,428 | 1,486,601 | 1,484,148 | 2,166,250 | 250,065 | 7,137,823 | 5,314,138 | Less: Income tax expense |
| Profit for the period | 3,706,566 | 3,022,876 | 3,254,545 | 3,443,506 | 3,633,486 | 4,756,977 | 5,778,892 | 5,801,608 | 16,373,489 | 17,024,967 | Profit for the period |
| Quarterly profit as a percentage of the profit after tax | 22.6 | 17.8 | 19.9 | 20.2 | 22.2 | 27.9 | 35.3 | 34.1 | 100.0 | 100.0 | Quarterly profit as a percentage of the profit after tax |
| Cumulative quarterly profit as a percentage of the profit after tax | 22.6 | 17.8 | 42.5 | 38.0 | 64.7 | 65.9 | 100.0 | 100.0 | - | - | Cumulative quarterly profit as a percentage of the profit after tax |
Statement of Financial Position - Group - 2019 and 2020
Table - 65
| 1st Quarter ended | 2nd Quarter ended | 3rd Quarter ended | 4th Quarter ended | ||||||
| As at | March 31, 2020 Rs. '000 |
March 31, 2019 Rs. '000 |
June 30, 2020 Rs. '000 |
June 30, 2019 Rs. '000 |
September 30, 2020 Rs. '000 |
September 30, 2019 Rs. '000 |
December 31, 2020 (Audited) Rs. '000 |
December 31, 2019 (Audited) Rs. '000 |
As at |
| Assets | Assets | ||||||||
| Cash and cash equivalents | 69,291,420 | 51,197,799 | 52,425,162 | 53,188,327 | 44,382,431 | 49,275,010 | 51,255,030 | 53,681,118 | Cash and cash equivalents |
| Balances with Central Banks | 38,459,820 | 51,599,785 | 57,547,194 | 45,126,978 | 83,313,147 | 42,467,189 | 115,358,732 | 46,101,232 | Balances with Central Banks |
| Placements with banks | 28,862,006 | 28,158,636 | 26,860,049 | 24,883,478 | 17,645,097 | 24,213,930 | 16,421,867 | 24,903,809 | Placements with banks |
| Securities purchased under re-sale agreements | 10,448,494 | 23,988,458 | 7,209,397 | 18,497,618 | 445,577 | 16,020,541 | - | 13,147,534 | Securities purchased under resale agreements |
| Derivative financial assets | 2,140,505 | 4,510,499 | 1,898,100 | 3,253,835 | 2,011,946 | 2,055,696 | 2,636,717 | 1,830,927 | Derivative financial assets |
| Financial assets recognised through profit or loss - measured at fair value | 25,660,517 | 10,668,315 | 32,898,907 | 12,252,492 | 43,470,925 | 16,413,151 | 35,189,471 | 21,468,033 | Financial assets recognised through profit or loss - measured at fair value |
| Financial assets at amortised cost - loans and advances to banks | 792,189 | 731,801 | 776,550 | 736,299 | 773,422 | 758,397 | 779,705 | 757,787 | Financial assets at amortised cost - loans and advances to banks |
| Financial assets at amortised cost - loans and advances to other customers | 917,442,418 | 861,142,772 | 897,297,570 | 854,238,500 | 899,988,223 | 865,095,075 | 909,829,172 | 893,919,311 | Financial assets at amortised cost - loans and advances to other customers |
| Financial assets at amortised cost - Debt and other financial instruments | 116,242,352 | 85,428,291 | 195,822,341 | 98,761,011 | 269,243,315 | 98,104,929 | 302,059,529 | 107,059,021 | Financial assets at amortised cost - Debt and other financial instruments |
| Financial assets measured at fair value through other comprehensive income | 212,994,354 | 176,527,583 | 245,777,765 | 208,698,513 | 252,685,502 | 205,397,219 | 278,716,794 | 197,825,017 | Financial assets measured at fair value through other comprehensive income |
| Investments in subsidiaries | - | - | - | - | - | - | - | - | Investments in subsidiaries |
| Investments in associates | 55,907 | 101,888 | 53,190 | 105,388 | 62,361 | 55,632 | 64,155 | 56,821 | Investments in associates |
| Property, plant and equipment and right-of-use assets | 22,051,532 | 16,980,540 | 21,993,257 | 16,882,420 | 21,705,618 | 17,289,059 | 25,386,630 | 22,423,046 | Property, plant and equipment and right-of-use assets |
| Investment properties | 46,350 | - | 46,350 | - | 46,350 | 46,350 | 67,116 | 46,350 | Investment properties |
| Intangible assets | 1,641,425 | 1,473,609 | 1,698,360 | 1,505,196 | 1,827,427 | 1,573,573 | 1,800,516 | 1,645,714 | Intangible assets |
| Leasehold property | 101,251 | 102,705 | 100,889 | 102,343 | 100,525 | 101,977 | 101,612 | Leasehold property | |
| Deferred tax assets | 1,291,100 | 132,577 | 159,921 | 180,225 | 2,503,276 | 196,965 | 2,735,566 | 530,165 | Deferred tax assets |
| Other assets | 25,749,941 | 30,631,819 | 24,090,018 | 27,674,083 | 22,879,328 | 31,289,510 | 20,195,153 | 23,443,869 | Other assets |
| Total assets | 1,473,271,581 | 1,343,377,077 | 1,566,655,020 | 1,366,086,706 | 1,663,084,470 | 1,370,354,203 | 1,762,496,153 | 1,408,941,366 | Total assets |
| Liabilities | Liabilities | ||||||||
| Due to banks | 76,515,510 | 42,694,636 | 73,955,005 | 62,009,934 | 82,499,159 | 49,473,621 | 88,248,056 | 53,807,425 | Due to banks |
| Derivative financial liabilities | 2,987,717 | 3,961,272 | 1,915,067 | 2,411,810 | 1,533,809 | 2,314,173 | 1,501,262 | 1,495,317 | Derivative financial liabilities |
| Securities sold under repurchase agreements | 42,014,953 | 41,381,747 | 64,224,587 | 40,649,376 | 81,100,405 | 38,023,739 | 91,411,522 | 51,117,342 | Securities sold under repurchase agreements |
| Financial liabilities at amortised cost - loans to depositors | 1,120,368,799 | 1,025,585,219 | 1,155,219,967 | 1,037,150,823 | 1,221,756,923 | 1,047,138,415 | 1,286,616,399 | 1,068,982,587 | Financial liabilities at amortised cost - loans to depositors |
| Financial liabilities at amortised cost - other borrowings | 23,473,191 | 25,312,923 | 31,578,599 | 24,188,447 | 48,116,673 | 24,414,671 | 54,555,933 | 23,248,893 | Financial liabilities at amortised cost - other borrowings |
| Current tax liabilities | 5,324,474 | 7,009,677 | 5,221,850 | 7,480,547 | 6,444,772 | 5,861,745 | 6,991,005 | 5,197,188 | Current tax liabilities |
| Deferred tax liabilities | 417,779 | 1,043,580 | 825,722 | 1,031,229 | 421,972 | 646,670 | 403,846 | 416,458 | Deferred tax liabilities |
| Other liabilities | 26,541,214 | 37,467,290 | 50,978,826 | 27,250,407 | 37,249,718 | 32,521,860 | 33,572,283 | 30,775,884 | Other liabilities |
| Due to subsidiaries | - | - | - | - | - | - | - | - | Due to subsidiaries |
| Subordinated liabilities | 38,562,279 | 37,444,838 | 38,199,628 | 37,494,509 | 38,136,630 | 37,960,312 | 38,247,138 | 37,886,789 | Subordinated liabilities |
| Total liabilities | 1,336,205,916 | 1,221,901,182 | 1,422,119,251 | 1,239,667,082 | 1,517,260,061 | 1,238,355,206 | 1,601,547,444 | 1,272,927,883 | Total Liabilities |
| Equity | Equity | ||||||||
| Stated capital | 40,916,958 | 40,916,957 | 42,971,971 | 40,916,957 | 42,971,971 | 40,916,957 | 52,187,747 | 40,916,958 | Stated capital |
| Statutory reserves | 8,387,701 | 7,444,178 | 8,391,150 | 7,445,163 | 8,391,150 | 7,445,163 | 9,285,233 | 8,387,701 | Statutory reserves |
| Retained earnings | 5,864,374 | 2,965,210 | 7,414,964 | 6,416,457 | 11,213,907 | 11,357,570 | 8,124,261 | 5,182,185 | Retained earnings |
| Other reserves | 80,208,291 | 68,936,039 | 84,077,287 | 70,392,367 | 81,537,813 | 70,754,689 | 89,595,571 | 79,937,405 | Other reserves |
| Total equity attributable to equity holders of the Group/Bank | 135,377,324 | 120,262,384 | 142,855,372 | 125,170,944 | 144,114,841 | 130,474,379 | 159,192,812 | 134,424,249 | Total equity attributable to equity holders of the Group/Bank |
| Non-controlling interest | 1,688,341 | 1,213,511 | 1,680,397 | 1,248,680 | 1,709,568 | 1,524,618 | 1,755,897 | 1,589,234 | Non-controlling interest |
| Total equity | 137,065,665 | 121,475,895 | 144,535,769 | 126,419,624 | 145,824,409 | 131,998,997 | 160,948,709 | 136,013,483 | Total Equity |
| Total liabilities and equity | 1,473,271,581 | 1,343,377,077 | 1,566,655,020 | 1,366,086,706 | 1,663,084,470 | 1,370,354,203 | 1,762,496,153 | 1,408,941,366 | Total liabilities and equity |
| Contingent liabilities and commitments | 622,815,977 | 623,050,857 | 602,842,021 | 585,207,963 | 680,543,307 | 628,720,426 | 730,561,685 | 580,961,807 | Contingent liabilities and commitments |
| Net assets value per ordinary share (Rs.) | 131.75 | 117.04 | 135.83 | 121.82 | 137.03 | 126.98 | 136.42 | 130.83 | Net assets value per ordinary share (Rs.) |
| Quarterly growth (%) | Quarterly growth (%) | ||||||||
| Financial assets at amortised cost - loans and advances to banks & loans and advances to other customers | 2.63 | -0.75 | -2.20 | -0.80 | 0.30 | 1.27 | 1.09 | 3.33 | Financial assets at amortised cost - loans and advances to banks & loans and advances to other customers |
| Financial liabilities at amortised cost - loans to depositors | 4.81 | 3.14 | 3.11 | 1.13 | 5.76 | 0.96 | 5.31 | 2.09 | Financial liabilities at amortised cost - loans to depositors |
| Total assets | 4.57 | 1.78 | 6.34 | 1.69 | 6.16 | 0.31 | 5.98 | 2.82 | Total assets |
Statement of Financial Position - Bank - 2019 and 2020
Table - 66
| 1st Quarter ended | 2nd Quarter ended | 3rd Quarter ended | 4th Quarter ended | ||||||
| As at | March 31, 2020 Rs. '000 |
March 31, 2019 Rs. '000 |
June 30, 2020 (Audited) Rs. '000 |
June 30, 2019 (Audited) Rs. '000 |
September 30, 2020 Rs. '000 |
September 30, 2019 Rs. '000 |
December 31, 2020 (Audited) Rs. '000 |
December 31, 2019 (Audited) Rs. '000 |
As at |
| Assets | Assets | ||||||||
| Cash and cash equivalents | 67,909,585 | 40,490,801 | 50,830,153 | 44,719,754 | 43,339,446 | 43,628,405 | 50,250,627 | 52,534,730 | Cash and cash equivalents |
| Balances with Central Banks | 32,656,696 | 49,591,644 | 53,453,467 | 43,450,379 | 79,611,753 | 40,888,289 | 110,971,105 | 39,461,127 | Balances with Central Banks |
| Placements with banks | 28,287,644 | 27,972,963 | 26,427,430 | 24,386,003 | 17,235,679 | 23,774,064 | 15,938,982 | 24,527,241 | Placements with banks |
| Securities purchased under re-sale agreements | 10,448,494 | 23,988,458 | 7,209,397 | 18,497,618 | 445,577 | 16,020,541 | - | 13,147,534 | Securities purchased under re-sale agreements |
| Derivative financial assets | 2,140,505 | 4,510,499 | 1,898,100 | 3,253,835 | 2,011,946 | 2,055,696 | 2,636,717 | 1,830,927 | Derivative financial assets |
| Financial assets recognised through profit or loss - measured at fair value | 25,660,517 | 10,668,315 | 32,898,907 | 12,252,492 | 43,470,925 | 16,413,151 | 35,189,471 | 21,468,033 | Financial assets recognised through profit or loss - measured at fair value |
| Financial assets at amortised cost - loans and advances to banks | 792,189 | 731,801 | 776,550 | 736,299 | 773,422 | 758,397 | 779,705 | 757,787 | Financial assets at amortised cost - loans and advances to banks |
| Financial assets at amortised cost - loans and advances to other customers | 907,415,058 | 853,891,574 | 887,251,878 | 847,364,012 | 888,862,548 | 857,595,286 | 896,845,453 | 884,645,744 | Financial assets at amortised cost - loans and advances to other customers |
| Financial assets at amortised cost - Debt and other financial instruments | 110,201,662 | 79,286,240 | 187,528,301 | 93,363,847 | 260,169,367 | 91,286,998 | 292,727,566 | 101,144,819 | Financial assets at amortised cost - Debt and other financial instruments |
| Financial assets measured at fair value through other comprehensive income | 212,748,101 | 176,288,466 | 245,533,383 | 208,459,018 | 252,327,507 | 205,157,059 | 278,461,369 | 197,568,330 | Financial assets measured at fair value through other comprehensive income |
| Investments in subsidiaries | 5,011,284 | 4,304,032 | 4,683,429 | 4,303,814 | 4,683,429 | 4,619,287 | 5,808,429 | 5,011,284 | Investments in subsidiaries |
| Investments in associates | 44,331 | 44,331 | 44,331 | 44,331 | 44,331 | 44,331 | 44,331 | 44,331 | Investments in associates |
| Property, plant and equipment | 20,053,178 | 15,271,969 | 19,964,308 | 15,185,135 | 19,672,332 | 15,176,692 | 23,212,394 | 20,436,493 | Property, plant and equipment |
| Investment properties | - | - | - | - | - | - | - | - | Investment properties |
| Intangible assets | 1,076,363 | 959,417 | 1,137,090 | 999,066 | 1,260,024 | 1,016,676 | 1,232,863 | 1,080,010 | Intangible assets |
| Leasehold property | 70,477 | 71,421 | 70,242 | 71,186 | 70,006 | 70,948 | - | 70,710 | Leasehold property |
| Deferred tax assets | 1,100,255 | - | - | - | 2,321,548 | - | 2,499,860 | 294,059 | Deferred tax assets |
| Other assets | 25,647,724 | 30,526,679 | 23,893,406 | 27,545,229 | 22,751,766 | 31,117,533 | 19,619,149 | 23,322,247 | Other assets |
| Total assets | 1,451,264,063 | 1,318,598,610 | 1,543,600,372 | 1,344,632,018 | 1,639,051,606 | 1,349,623,353 | 1,736,218,021 | 1,387,345,406 | Total assets |
| Liabilities | Liabilities | ||||||||
| Due to banks | 74,075,132 | 40,274,885 | 72,163,605 | 59,867,706 | 81,003,276 | 47,631,147 | 87,451,306 | 51,505,694 | Due to banks |
| Derivative financial liabilities | 2,987,717 | 3,961,272 | 1,915,067 | 2,411,810 | 1,533,809 | 2,314,173 | 1,501,262 | 1,495,317 | Derivative financial liabilities |
| Securities sold under repurchase agreements | 42,159,141 | 41,531,673 | 64,448,218 | 40,747,726 | 81,145,001 | 38,133,178 | 91,437,612 | 51,220,023 | Securities sold under repurchase agreements |
| Financial liabilities at amortised cost - loans to depositors | 1,104,634,005 | 1,006,076,868 | 1,138,170,145 | 1,020,918,723 | 1,203,658,867 | 1,031,733,089 | 1,265,965,918 | 1,053,307,660 | Financial liabilities at amortised cost - loans to depositors |
| Financial liabilities at amortised cost - other borrowings | 23,473,191 | 25,312,923 | 31,578,599 | 24,188,447 | 48,116,673 | 24,414,671 | 54,555,933 | 23,248,893 | Financial liabilities at amortised cost - other borrowings |
| Current tax liabilities | 5,053,931 | 6,777,712 | 4,938,966 | 7,232,866 | 6,328,897 | 5,696,943 | 6,777,992 | 4,967,644 | Current tax liabilities |
| Deferred tax liabilities | - | 716,986 | 410,559 | 702,188 | - | 226,978 | - | - | Deferred tax liabilities |
| Other liabilities | 26,300,217 | 37,229,335 | 50,610,310 | 26,895,743 | 36,733,042 | 32,098,371 | 33,037,669 | 30,496,709 | Other liabilities |
| Due to subsidiaries | 80,711 | 41,719 | 65,786 | 50,544 | 121,071 | 138,081 | 97,015 | 54,292 | Due to subsidiaries |
| Subordinated liabilities | 38,562,279 | 37,444,838 | 38,199,628 | 37,494,509 | 38,136,630 | 37,960,312 | 38,247,138 | 37,886,789 | Subordinated liabilities |
| Total liabilities | 1,317,326,324 | 1,199,368,211 | 1,402,500,883 | 1,220,510,262 | 1,496,777,266 | 1,220,346,943 | 1,579,071,845 | 1,254,183,021 | Total liabilities |
| Equity | Equity | ||||||||
| Stated capital | 40,916,958 | 40,916,957 | 42,971,971 | 40,916,957 | 42,971,971 | 40,916,957 | 52,187,747 | 40,916,958 | Stated capital |
| Statutory reserves | 8,205,391 | 7,354,143 | 8,205,391 | 7,354,143 | 8,205,391 | 7,354,143 | 9,024,065 | 8,205,391 | Statutory reserves |
| Retained earnings | 5,768,479 | 2,973,293 | 6,968,011 | 6,416,384 | 10,707,378 | 11,296,851 | 7,596,260 | 5,144,433 | Retained earnings |
| Other reserves | 79,046,911 | 67,986,006 | 82,954,116 | 69,434,272 | 80,389,600 | 69,708,459 | 88,338,104 | 78,895,603 | Other reserves |
| Total equity attributable to equity holders of the Group/Bank | 133,937,739 | 119,230,399 | 141,099,489 | 124,121,756 | 142,274,340 | 129,276,410 | 157,146,176 | 133,162,385 | Total equity attributable to equity holders of the Group/Bank |
| Non-controlling Interest | - | - | - | - | - | - | - | - | Non-controlling Interest |
| Total equity | 133,937,739 | 119,230,399 | 141,099,489 | 124,121,756 | 142,274,340 | 129,276,410 | 157,146,176 | 133,162,385 | Total equity |
| Total liabilities and equity | 1,451,264,063 | 1,318,598,610 | 1,543,600,372 | 1,344,632,018 | 1,639,051,606 | 1,349,623,353 | 1,736,218,021 | 1,387,345,406 | Total liabilities and equity |
| Contingent liabilities and commitments | 620,610,185 | 622,647,488 | 600,818,662 | 584,832,875 | 678,379,768 | 628,260,614 | 728,711,698 | 579,999,273 | Contingent liabilities and commitments |
| Net assets value per ordinary share (Rs.) | 130.35 | 116.04 | 134.16 | 120.80 | 135.28 | 125.82 | 134.67 | 129.60 | Net assets value per ordinary share (Rs.) |
| Quarterly growth (%) | Quarterly growth (%) | ||||||||
| Financial assets at amortised cost - loans and advances to banks & loans and advances to other customers | 2.57 | -0.84 | -2.22 | -0.76 | 0.18 | 1.21 | 0.90 | 3.15 | Financial assets at amortised cost - loans and advances to banks & Loans and advances to other customers |
| Financial liabilities at amortised cost - loans to depositors | 4.87 | 2.34 | 3.04 | 1.48 | 5.75 | 1.06 | 5.18 | 2.09 | Financial Liabilities at amortised cost - loans to depositors |
| Total assets | 4.61 | 1.16 | 6.36 | 1.97 | 6.18 | 0.37 | 5.93 | 2.80 | Total assets |