Bank is highly interconnected with and interdependent on its stakeholders for its value creation. This is reflected in the duality of the value creation process, viz. delivering value to and deriving value from stakeholders. As a result, capacity to generate sustainable profitability depends on the strength and robustness of these interconnections and interdependencies. Delivering value demonstrates as to how the Bank conducts its operations with due consideration to the wider community and the environment, enabling all the stakeholders to enjoy positive outcomes from its existence. Deriving value enables the Bank to create value for itself, giving capacity to sustain its performance into the foreseeable future as a going concern. These are two mutually inclusive aspects since it is the sustained performance of the Bank that enables it to give due consideration to the society and the environment while the Bank cannot sustain its performance in the long run unless it gives due consideration to the social and environmental aspects. A profitable operation is a precondition for being sustainable.
Bank continued to build both financial as well as other capitals (manufactured, intellectual, human, social and network, and natural) through its activities during the year. Details of the value creating activities are given in the Business Model. The outcomes of such activities on the various capitals are summarised in the “Statement of Capital Position”.
This financial review provides an analysis of how the Bank grew its financial capital during the year. This should ideally be read in conjunction with the Operating Environment given in the sections on Connecting with Stakeholders, Material Matters, Context for Our Performance and Outlook that provides the context within which the performance of the Bank was achieved.
An overview
Due to the headwinds that impacted the entire financial services industry as elaborated in the operating environment, the Bank recorded relatively lower rates of growth during the year in business volumes compared to those recorded in the recent past. Year on year growth in loan portfolio amounted to only Rs. 30.228 Bn. (Rs. 135.521 Bn. or 17.96% to Rs. 890.229 Bn. in 2018) to reach Rs. 920.547 Bn., mere 3.40% growth as at end of 2019. Deposits, however grew by Rs. 70.271 Bn. or 7.15% to Rs. 1,053.308 Bn. (Rs. 132.909 Bn. or 15.63% to Rs. 983.037 Bn. in 2018).
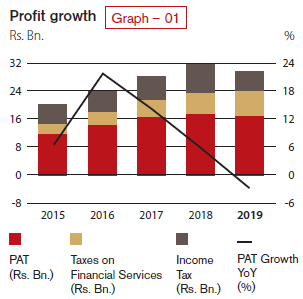
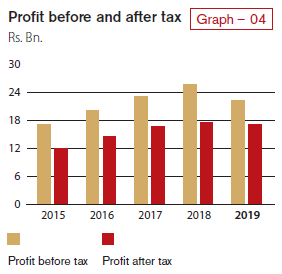
Profit after tax of the Bank decreased by 2.96% to Rs. 17.025 Bn. during the year 2019 from Rs. 17.544 Bn. reported in 2018 (Graph 01). Yet, this is a significant achievement when viewed against the magnitude of the challenges posed by the operating environment. Growth in total operating income by 3.66% was not sufficient to offset the increases in impairment provisions and operating expenses, causing the profit before tax to decrease by a significant 12.71%. However, recent changes to tax legislation which had a favourable impact on the investors in Sri Lanka Development Bonds (SLDBs), resulted in limiting the estimated tax expense for the year to Rs. 5.314 Bn., a drop of Rs. 2.733 Bn. or 33.96% compared to 2018, thereby limiting the drop in profit after tax to 2.96%.
In tandem with the lacklustre performance in the stock market during the year, share prices of the Bank also decreased. However, the price to book value and the market capitalisation of the Bank’s shares remained the highest among peers in the Bank, Finance, and Insurance sector. Bank’s market capitalisation ranked fourth among all listed companies on the Colombo Stock Exchange as at December 31, 2019.
With due consideration to the dividend policy, lower profitability, higher capital requirements consequent to the Bank being classified as a D-SIB, the capital required to support future growth as well as to maintain a consistent stream of dividend to shareholders, the Board of Directors has recommended a final dividend of Rs. 2.00 per share in the form of a scrip issue. This final dividend together with the two interim dividends paid/payable, amounted to a total dividend for the year of Rs. 6.50 per share which is consistent with the recent dividend track record.
Given that the Bank accounted for 98.47% of the assets and 97.73% of the profit of the Group, the analysis below provides a detailed account of the Bank’s financial performance, followed by a brief commentary on performance of subsidiaries, associate and Bank‘s overseas operations as given in the section on Financial Review.
Income Statement
Financial intermediation
Reflecting the strength of the franchise and robust financial intermediation, gross income from fund-based and fee-based operations grew by 7.72% to Rs. 148.706 Bn. for the year 2019 from Rs. 138.049 Bn. in 2018. Average assets for the year 2019 grew by a higher 9.97% to Rs. 1,345.415 Bn. from Rs. 1,223.429 Bn. in 2018. As a result, financial intermediation margin (gross income/average total assets) decreased to 11.05% for the year from 11.28% in 2018, a drop of mere 23bps. Financial intermediation margin for the banking sector for the year 2019 was 11.03% compared to 11.38% for 2018.
Fund-based operations
Interest income which accounted for 85.93% (85.09% in 2018) of the gross income of Rs. 148.706 Bn., grew to Rs. 127.780 Bn. during the year 2019 from Rs. 117.466 Bn. in 2018 recording a growth of Rs. 10.314 Bn. or 8.78% (Rs. 14.431 Bn. or 14.01% in 2018), mainly attributable to the growth of Rs. 117.801 Bn. (10.70%) in average interest earning assets. However, this positive impact was partly offset by the drop in the average rate of interest on interest earning assets by 18 bps to 10.48%. Gradual deterioration in asset quality which resulted in substantial increase in the non-performing advances and excess liquidity due to lower growth in advances being parked in the lower yielding assets, limited the growth in interest income to 8.78%.
Interest expenses, which accounted for 63.05% of the interest income (61.74% in 2018) on the other hand, grew by Rs. 8.047 Bn. or 11.10% (Rs. 8.513 Bn. or 13.30% in 2018) due to the time lag in repricing of interest-bearing liabilities compared to the repricing of interest-earning assets, to Rs. 80.571 Bn. during the year, from Rs. 72.524 Bn. in 2018. The main contributory factor for this increase was the growth in average interest-bearing liabilities by Rs. 105.320 Bn. (10.59%), a similar growth was recorded in interest expenses. In addition, interest expenses included Rs. 457.449 Mn. on account of interest accrued on lease liability consequent to the adoption of SLFRS 16 for the first time effective from January 1, 2019.
Consequently, net interest income grew by 5.04% (compared to 15.17% in 2018) to Rs. 47.208 Bn. in 2019 from Rs. 44.942 Bn. in 2018, accounting for 71.51% of the total operating income (70.57% in 2018). Net interest margin dropped to 3.51% in 2019 from 3.67% in 2018 mainly due to the adverse impact of increasing non-performing advances.
Fee-based operations
Fee and commission income recorded a growth of 3.49% to Rs. 12.407 Bn. for the year. The sources that contributed to this significant growth included services related to credit and debit cards (8.95%), trade finance and remittance (2.72%), and deposit-related services (3.19%). The Bank was able to record a significant increase in the number of credit and debit cards in issue as well as their utilisation during 2019.
Fee and commission expenses which relate mostly to credit and debit cards-related services increased by 15.19% to Rs. 2.117 Bn. (Rs. 1.838 Bn. in 2018). Consequently, net fee and commission income increased only by 1.37% to Rs. 10.290 Bn. in 2019 and accounted for 15.59% of the total operating income (15.94% in 2018).
Total operating income
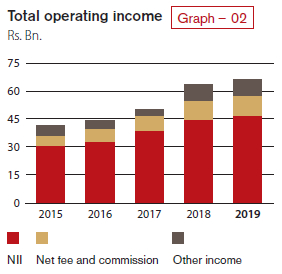
Total operating income grew by 3.66% to Rs. 66.018 Bn. compared to a growth rate of 30.56% recorded in 2018 (Graph 02). This was the combined effect of growth in net interest income of 5.04% and a lower growth in net fee and commission income of 1.37% and the substantially lower net other operating income due to gains on revaluation of foreign exchange being Rs. 5.648 Bn. only compared to Rs. 11.022 Bn. in 2018, mainly as a result of the sharp depreciation of the Sri Lankan Rupee by 16.07% against the US Dollar in 2018. However, the Bank recorded substantial gains on its treasury operations, specially foreign exchange gains on derivative financial instruments including swap transactions and higher margins earned on foreign currency transactions in 2019.
Impairment charges
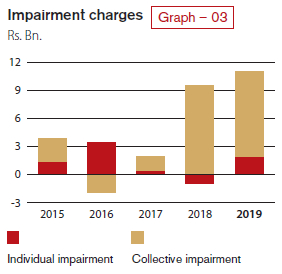
Application of SLFRS 9 coupled with the significant drop in asset quality during the year resulted in the entire banking industry witnessing a substantial increase in the impairment provisions. Consequently, impairment charge for the year increased by 28.99% to Rs. 11.061 Bn. compared to Rs. 8.575 Bn. in 2018 (Graph 03). Charges o/a individual impairment for loans and advances increased to Rs. 1.932 Bn. as against a reversal of Rs. 1.002 Bn. in 2018, mainly due to deterioration of the quality of the loan portfolio across the entire banking industry. The reversal in the charge o/a individual impairment in 2018 was mainly due to the change in the threshold for identifying loans and advances assessed for individual impairment assessment. Increase in individual impairment for the year 2019 was partly off-set by a decrease in collective impairment to Rs. 9.129 Bn. from Rs. 9.576 Bn. in 2018.
The substantial increase in impairment provision and the lower growth in the total operating income resulted in a negative growth of 0.28% in the net operating income.
Operating expenses
Total operating expenses increased by 8.34% to Rs. 25.426 Bn. for the year 2019 from Rs. 23.469 Bn. in 2018. This was mainly due to an increase in personnel expenses by 7.74% in 2019.
Negative growth of 0.28% in net operating income coupled with a growth in total operating expenses by 8.34% saw operating profit before taxes on financial services decreasing by 6.68%. An increase in taxes on financial services due to the full year’s impact of the Debt Repayment Levy (DRL) which was imposed from October 2018, caused the operating profit after taxes on financial services to record a negative growth of 12.71%. As a result, the Bank’s cost to income ratio (including taxes on financial services) increased to 49.41% in 2019 from 46.35% in 2018 and the cost to income ratio excluding taxes on financial services increased to 38.51% in 2019 from 36.85% in 2018.
Profit before tax and profit after tax
Profit before tax decreased to Rs. 22.339 Bn. for the year, down by 12.71% from Rs. 25.591 Bn. reported in 2018 (Graph 04). Due to recent changes to tax legislation that exempted interest income earned from SLDBs with retrospective effect from April 1, 2018, resulted in income tax expense for the year being reduced to Rs. 5.314 Bn. compared to the previous year‘s income tax expense of Rs. 8.047 Bn. This narrowed the negative growth in profit after tax for the year to 2.96%. Consequently, profit after tax for the year stood at Rs. 17.025 Bn. compared to Rs. 17.544 Bn. reported for 2018.
Profitability
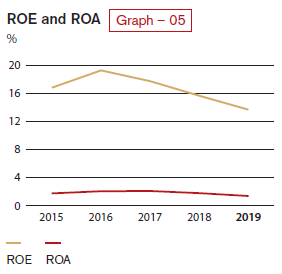
As a result of the negative growth in profit after tax and the increases in assets and equity in 2019, Return on Assets (ROA) and Return on Equity (ROE) reduced to 1.27% and 13.54% respectively, as against 1.43% and 15.56% reported in 2018 (Graph 05). Despite the Bank’s ROA and ROE recording decreases during the year, these ratios are well above the industry averages of 0.93% and 10.26%.
Statement of Financial Position
Assets
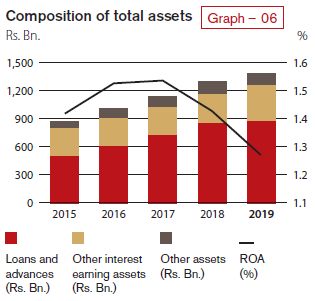
Total assets of the Bank reached Rs. 1.387 Tn. at the year end compared to Rs. 1.303 Tn. as at December 31, 2018, recording a growth of Rs. 83.861 Bn. in absolute terms or 6.43% during the year (Graph 06). As the net loans and advances recorded only a marginal growth of 2.73%, deposits mobilised during the year was invariably invested in Government securities that mostly accounted for the growth in assets. The asset growth of the banking industry too recorded a moderate growth of 6.18% for the year 2019.
Loans to customers
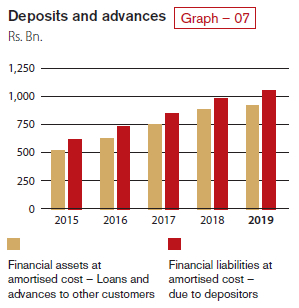
Despite the slowing down of the credit growth during the year, net loans and advances to other customers is the single biggest asset of the Bank on its balance sheet, which accounted for 63.77% of total assets compared to 66.06% a year ago. The net loans and advances amounted to Rs. 884.646 Bn., recorded a drop of 2.73% as at December 31, 2019, compared to Rs. 861.100 Bn. a year ago (Graph 07). This is lower than the industry growth of 5.02% for the year due to conscious decision taken by the Bank to slow down credit growth and deployment of more resources for strengthening recovery efforts. Key contributor to the loans and advances growth came mainly from term loans.
Asset quality
Quality of the loans and advances portfolio which accounts for approximately two-thirds of total assets has a significant bearing on the sustainability of the Bank’s operations. Deterioration in asset quality witnessed towards the latter part of 2018 continued throughout 2019. As a result, the Bank too experienced an increase in its non-performing loans portfolio. However, the conservative risk profile with a moderate risk appetite, robust risk management framework and the strengthened recovery initiatives helped the Bank to contain the increase in the gross and the net NPL ratios to 4.95% and 3.00% as at December 31, 2019 compared to the NPL ratios of 3.24% and 1.71%, a year ago.
Cumulative impairment provision for loans and advances as a percentage of the total loans and advances portfolio as at the end of the year was 3.89% compared to 3.27% in 2018. The provision cover (as per CBSL guidelines) dropped to 39.39% in 2019 from 47.21% in 2018 while the open credit exposure ratio (which is the net exposure of NPLs as a percentage of regulatory capital) increased to 19.88% as at December 31, 2019 from 12.38% at the end of 2018.
The loans and advances portfolio of the Bank is fairly well diversified across a wide range of industry sectors with no significant exposure to any particular sector.
Deposits
With the solid domestic franchise in Sri Lanka, customer deposits continued to be the single biggest source of funding for the Bank, accounting for 75.92% of the total assets as at December 31, 2019 compared to 75.42% a year ago. Deposits grew by Rs. 70.270 Bn. or 7.15% during the year to cross the Rupees one trillion milestone and reached Rs. 1.053 Tn. as at December 31, 2019 compared to Rs. 983.037 Bn. as at the previous year end (Graph 07). CASA ratio marginally declined to 37.10% as at December 31, 2019 from 37.55% a year ago, mainly due to a shift in deposits towards high cost term deposits. Nevertheless, this ratio compares well with the industry CASA ratio of 31.36%.
Other liabilities
Due to growth in deposit liabilities and the sluggish growth in loans and advances, the Bank had excess liquidity during most part of the year. As a result, external borrowings during the year was limited to a loan of USD 25 Mn. obtained from PROPARCO for funding SME lending. Total other liabilities as at the end of 2019 remained around the same levels as the year before except the increase recorded due to recognition of a lease liability of Rs. 5.147 Bn. under SLFRS 16 that led to a change in the composition of other liabilities.
Capital
Profitability and the prudent dividend policy helped the Bank to grow its equity capital to Rs. 133.162 Bn. as at December 31, 2019 from Rs. 118.406 Bn. a year ago (Graph 08), with an on balance sheet multiplier (gearing ratio) of 10.42 times compared to the industry average of 9.02 times. The equity funded 9.60% of the assets as at the end of 2019, compared to 9.08% as at December 31, 2018. The Bank ploughed back Rs. 6.257 Bn. out of profit of the year 2018 after the payment of dividends. The risk weighted assets of the Bank grew by 2.96% to Rs. 972.679 Bn. in 2019. Consequently, both the Tier 1 ratio and the total capital ratio stood at 12.298% (minimum requirement – 10.000%) and 16.146% (minimum requirement – 14.000%), respectively as at December 31, 2019, exceeding the higher capital adequacy requirements imposed on the Bank under Basel III as a D-SIB. The equity multiplier in terms of risk weighted assets marginally declined to 7.30 times in 2019 from 7.98 times a year ago.
As per the CBSL Basel III regulations, the Bank has now been identified as a D-SIB, the highest grading currently assigned to a bank along with another Government Bank, showcasing the Bank’s importance to the economy in Sri Lanka.

Liquidity
The Bank had excess liquidity during most part of the year. Lack of demand for credit together with conscious decision taken by the Bank to slow down credit growth paused challenges in optimally managing excess liquidity. The Bank invested excess liquidity in Government securities and is geared to benefit from an upturn in envisaged credit demand in the years ahead. Given its importance, review of liquidity is a permanent agenda item in the fortnightly Assets and Liabilities Committee (ALCO) meetings of the Bank.
Liquid assets ratios of the Domestic Banking Unit (DBU) and the Offshore Banking Centre (OBC) stood at 30.42% and 25.25% respectively (statutory minimum requirement is 20%) as at December 31, 2019 (24.47% and 30.20% respectively as at December 31, 2018). Gross loans to deposits ratio was 87.39% as at end 2019 (90.56% in 2018). Available stable funding based on definitions prescribed by the CBSL stood at Rs. 1.089 Tn. as at December 31, 2019, leading to a Net Stable Funding Ratio (NSFR) of 137.05%, comfortably above the statutory minimum of 100%. Demonstrating the availability of unencumbered high-quality liquid (HQL) assets at the disposal of the Bank, the Liquidity Coverage Ratio (all currency) stood at 224.74% as at December 31, 2019 (215.62% as at December 31, 2018) as against the statutory minimum of 100%.
Segmental performance
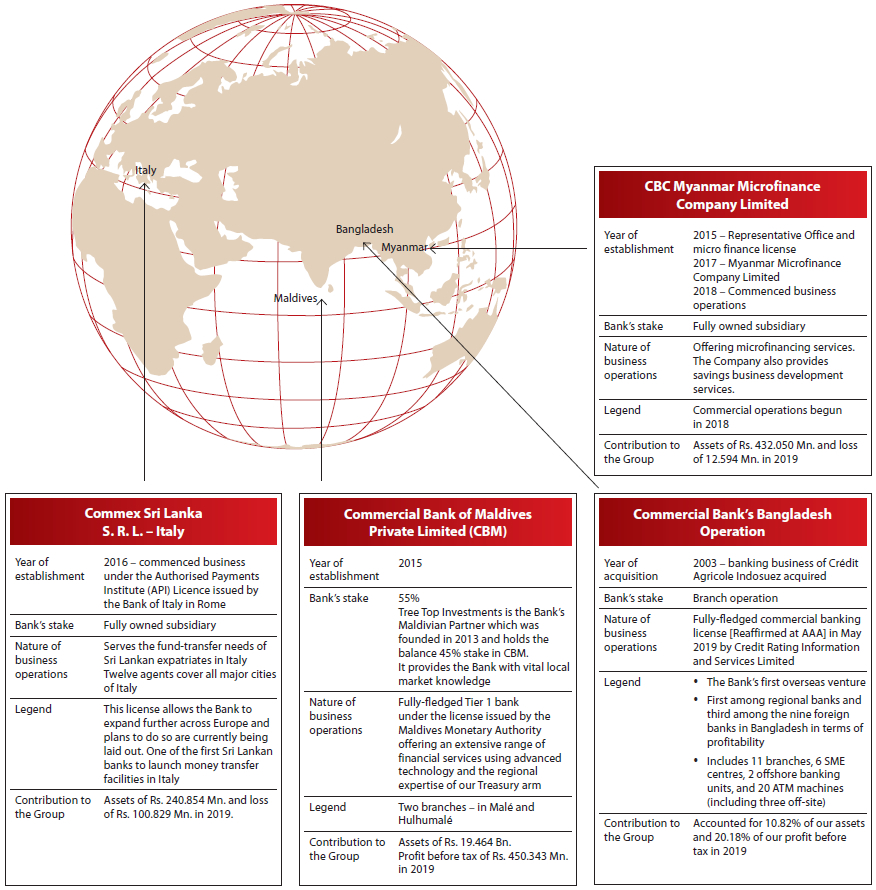
Both Corporate Banking which had a substantial drop in the impairment provision and Treasury which had a substantial increase in foreign exchange profits increased their contributions to the profit before tax of the Group compared to the last year, accounting for 18.68% and 13.70% respectively. International Operations too managed to increase their contribution to 29.46% from 24.26% last year mainly due to the higher contribution from Bangladesh and Maldivian operations. Despite recording a reasonable growth in both fee and fund-based operations, Personal Banking contribution to the Group’s profit decreased to 53.85% from 57.72% in 2018, due to a substantial increase in the impairment provision.
Contribution from the International Operations now accounts for 16.06% of total assets (12.48% in 2018) and 17.67% of net operating income (15.61% in 2018) of the Group.
Core Financial Soundness Indicators (FSIs)
Financial soundness indicators given below provide further insights into the financial health and stability of the Bank.
Financial soundness indicators
Table – 03
| Financial soundness indicator (%) | 2019 | 2018 | 2017 | 2016 | 2015 |
| Capital adequacy (under Basel II and Basel III): | |||||
| Common Equity Tier 1 ratio | 12.30 | 11.34 | 12.11 | N/A | N/A |
| Tier 1 capital ratio | 12.30 | 11.34 | 12.11 | 10.37* | 11.60* |
| Total capital ratio | 16.15 | 15.60 | 15.75 | 14.87* | 14.26* |
| Non-performing loans [net of interest in suspense and specific provisions] to equity | 20.48 | 12.71 | 6.39 | 8.65 | 10.36 |
| Asset quality: | |||||
| Gross NPL ratio | 4.95 | 3.24 | 1.88 | 2.18 | 2.74 |
| Net NPL ratio | 3.00 | 1.71 | 0.92 | 1.09 | 1.41 |
| Total provisions made against gross loans and advances | 2.37 | 1.97 | 1.40 | 1.53 | 1.75 |
| Provision coverage ratio | 39.39 | 47.21 | 51.05 | 50.11 | 48.49 |
| Earnings and profitability: | |||||
| Net interest income to total operating income | 71.51 | 70.56 | 78.02 | 74.43 | 73.51 |
| Financial intermediation margin | 11.05 | 11.28 | 10.61 | 9.85 | 9.30 |
| Interest margin (Net interest income to average assets) | 3.51 | 3.67 | 3.62 | 3.47 | 3.62 |
| Operating expenses to gross income | 17.10 | 17.00 | 17.33 | 20.20 | 22.22 |
| Impairment charge to total operating income | 16.76 | 13.46 | 1.39 | 3.47 | 9.55 |
| Return on assets | 1.27 | 1.43 | 1.54 | 1.53 | 1.42 |
| Return on equity | 13.54 | 15.56 | 17.88 | 19.52 | 16.90 |
| Cost to income ratio | 49.41 | 46.35 | 51.08 | 51.06 | 48.92 |
| Liquidity: | |||||
| Statutory liquid assets ratio (DBU) | 30.42 | 24.47 | 27.28 | 27.19 | 26.24 |
| Statutory liquid assets ratio (OBC) | 25.25 | 30.20 | 30.95 | 30.19 | 49.13 |
| Liquidity coverage ratio (All currency) | 224.74 | 215.62 | 209.17 | 150.45 | N/A |
| Net stable funding ratio | 137.05 | 139.18 | 127.87 | N/A | N/A |
| CASA ratio | 37.10 | 37.55 | 39.23 | 41.67 | 49.70 |
| Gross Loans to deposits ratio | 87.39 | 90.56 | 88.78 | 85.64 | 84.31 |
| Assets and funding structure: | |||||
| Deposits to total assets | 75.92 | 75.42 | 74.35 | 73.06 | 70.94 |
| Borrowings to total assets | 4.41 | 4.86 | 4.28 | 3.37 | 2.50 |
| Equity to total assets | 9.60 | 9.08 | 9.37 | 7.74 | 8.00 |
| Deposits to gross loans | 114.43 | 110.43 | 112.64 | 116.76 | 118.61 |
*Computed under Basel II guidelines
Performance of the subsidiaries, associate and overseas operations
Performance of the Bank’s Bangladesh Operations
Bangladesh’s GDP grew by 8.15% in FY 2018-19 making the country the fastest growing nation in the Asia Pacific region. The country has made substantial progress in growing its economy, lifting people out of poverty, and improving the lives of its people by boosting employment opportunities, increased access to health and education, and improved basic infrastructure.
Standard & Poor's credit rating for Bangladesh stands at BB- with stable outlook. Moody's credit rating for Bangladesh was last set at Ba3 with stable outlook while Fitch's rating BB- with stable outlook. The first ever Bangladeshi Taka denominated bond “Bangla Bond” was listed on the London Stock Exchange through International Finance Corporation (IFC) which will help Bangladesh to raise overseas investments.
During the past 16 years of operation in Bangladesh, CBC has established its position well above the other Regional Banks. Presently CBC Bangladesh operates in five main districts in the country i.e. Dhaka, Chittagong, Sylhet, Narayangonj and Gazipur through a network consisting of 11 Branches, 6 SME Centers and 2 Offshore Banking Units. The Bank has installed 20 ATM machines in Bangladesh (including three off-site locations). In addition, the Bank has introduced an Automated Banking Centre (ABC) which comprises a real time cash deposit machine, a cheque deposit machine, a KIOSK machine and a digital signage in its Motijheel Branch.
Credit Rating Information and Services Ltd. (CRISL) rated CBC Bangladesh “AAA” for the 9th consecutive year based on Financial Statements of 2018.
Key performance indicators during the year, including past statistics
The progress of the Bank’s Bangladesh operations in core banking areas over the past five years is summarised below.
Key performance indicators – Bangladesh operations
Table – 04
| Particulars | 2019 BDT Mn. | 2018 BDT Mn. | 2017 BDT Mn. | 2016 BDT Mn. | 2015 BDT Mn. | YoY Growth (%) | 5 year CAGR (%) | |
| Total deposits | 45,362.98 | 35,221.65 | 28,808.18 | 23,124.88 | 21,935.55 | 28.79 | 19.48 | |
| Gross advances | 47,449.60 | 38,448.10 | 32,113.53 | 24,456.51 | 22,621.26 | 23.41 | 20.95 | |
| Profit before tax | 2,744.68 | 2,439.98 | 1,758.56 | 1,381.93 | 1,592.10 | 12.46 | 10.98 | |
| Profit after tax | 1,697.40 | 1,406.65 | 988.40 | 785.13 | 904.10 | 20.62 | 12.36 |
All information given in Table 04 below is based on Management Accounts of the Bangladesh Operation.
Subsidiaries and associate of the Group
Consequent to Bank’s decision to acquire 40% stake in Commercial Insurance Brokers (Private) Limited, the Group consists of Commercial Bank of Ceylon PLC and seven subsidiaries (including three foreign subsidiaries) and an associate as depicted in Figure 23 in the Financial Statements.
Given below is a brief overview of the operations of the subsidiaries and associate of the Bank.
Local subsidiaries
Commercial Development Company PLC (CDC)
Established in 1980 as the Bank’s first subsidiary, CDC was responsible for building the present Head Office building of Commercial Bank, “Commercial House”, and has two other properties in Negombo and Tangalle. The Bank reduced its stake in CDC from 92.41% as at end of 2018 to 90% by end of 2019 to enable CDC to comply with the Rules on Minimum Public Holding of the CSE. CDC is the only listed Subsidiary of the Group, with a market capitalisation of Rs. 949.2 Mn. as of end 2019. The principal business activities of CDC include renting of premises, hiring of vehicles, outsourcing non-core staff and provision of other utility services to the Bank.
CDC recorded a post-tax profit of Rs. 363.217 Mn. for the year 2019, recording a 10.55% growth from Rs. 328.546 Mn. reported in 2018. The increase in profit was primarily attributable to the higher gain recognised on revaluation of the investment properties in 2019.
CBC Tech Solutions Limited (formerly ONEzero Company Ltd.)
CBC Tech Solutions Limited is a wholly-owned subsidiary and provides Information Technology Services and Solutions to the Bank. Its main lines of business are:
– Providing of hardware and software related support services
– Supply of computer hardware and licensed software
– Development of software and
– Outsourcing of professional and skilled manpower to the Bank
Company recorded a post-tax profit of Rs. 79.699 Mn. for the year 2019, a significant growth of 24.05% from Rs. 64.248 Mn. reported in 2018.
Serendib Finance Limited (SFL)
SFL is a fully owned subsidiary of the Bank and is a Licensed Finance Company (LFC) under the Finance Business Act No. 42 of 2011.
Since the acquisition of the Company in 2014 by the Bank, SFL underwent vast changes in terms of staffing, upgrading of risk management and corporate governance structures as well as development and deployment of new business plans and strategies.
As envisaged in last year, SFL implemented a twofold strategy of capitalising on business opportunities by employing professional lending staff for non-leasing business and improving the risk profile of the asset portfolio by enhanced lending to higher investment grade customers and strengthening the recovery function of the Company. This enabled the Company to improve its performance significantly in the year under review.
Accordingly, SFL has grown its asset base up to Rs. 7.432 Bn. as at December 31, 2019, compared to Rs. 5.425 Bn. at end 2018. Corresponding improvements were seen in results of operations with gross income for the year growing to Rs. 1.151 Bn. from Rs. 851.542 Mn. in 2018 and recording a post-tax profit of Rs. 79.129 Mn. for 2019 as against the loss of Rs. 30.762 Mn. reported in 2018.
Commercial Insurance Brokers (Pvt) Ltd. (CIBL)
The Bank acquired a 40% stake in CIBL during the year 2019, which together with the indirect stake of 18% already held through the Bank’s subsidiary, CDC, the Bank now has a stake of 58% in CIBL.
The principal business activity of CIBL is insurance brokering for all types of insurance through reputed life and general insurance companies in Sri Lanka.
CIBL recorded a post-tax profit of Rs. 45.791 Mn. for the year ended December 31, 2019 with a growth of 39.5% from Rs. 32.828 Mn. in 2018. The CIBL’s total assets stood at Rs. 379.192 Mn. as at December 31, 2019.
Foreign subsidiaries
Commex Sri Lanka S.R.L. (Commex)
Commex, a fully-owned subsidiary of Bank, commenced business under the Authorised Payments Institute (API) Licence issued by the Bank of Italy in 2016. As a result, Commercial Bank became the first Sri Lankan bank to be licensed by the Central Bank of Italy to operate as a money transfer company. The license allows Commex to expand across the European Union using passporting rights.
During 2019, Commex recorded a loss of Rs. 100.829 Mn. and it is taking steps to improve its revenue in 2020.
Commercial Bank of Maldives Private Limited (CBM)
In partnership with Tree Top Investments (TTI), CBM was founded in the Republic of Maldives as the second foreign subsidiary of the Bank. TTI contributes vital local market knowledge to the Company and has a stake of 45%, while the Bank holds a 55% stake in the Company. Established during the latter part of 2016, CBM opened its Head Office and first branch in the capital, Malé. By end 2019, CBM had two branches.
While offering an extensive range of financial services, CBM’s goal is to be the most technologically advanced, innovative, customer friendly, and the most sought-after financial service organisation in the Republic of Maldives. In its third year of operations, CBM was awarded for ‘Excellence in Finance’ in the Banking and Finance category at the 2019 Maldives Business Awards.
During the year 2019, CBM was able to record a growth in its deposits and advances by over 40% and 80% respectively. As a result, the total assets of CBM recorded a commendable growth of 37% in 2019 and stood at Rs. 19.464 Bn. as at December 31, 2019. In 2019, CBM recorded a post-tax profit of Rs. 328.948 Mn., compared to the post-tax profit of Rs. 270.671 Mn. reported in 2018 with an impressive growth rate of 21.53%.
CBC Myanmar Microfinance Company Limited (CBC Myanmar)
CBC Myanmar is a fully-owned subsidiary of the Bank, that was established as its third foreign subsidiary, to capitalise on opportunities available in the microfinance sector in Myanmar. In 2018, the CBC Myanmar obtained its microfinance business license from the Financial Regulatory Department (FRD) of Myanmar and commenced operations in Nay Pyi Taw.
Similar to the concept of Grameen banking, the operations in Myanmar presently offer
group loans to customers with a compulsory saving requirement. Initially, CBC Myanmar obtained a temporary Microfinance license from FRD and during the year 2019, it was able to obtain a permanent Microfinance License from the Government of Myanmar with the recommendation of the FRD. CBC Myanmar added two more branches in 2019 and was able to grow its total assets by 34% to Rs. 432.050 Mn. as at the end of 2019 from Rs. 323.117 Mn. in 2018. During 2019, CBC Myanmar recorded a loss of Rs. 12.594 Mn.
By the end of December 2019, CBC Myanmar was able to expand its customer base to reach almost 10,000 customers, a significant improvement from 2,300 customer base served as of end of 2018.
Local associate
Equity Investments Lanka Ltd. (EQUILL)
The Bank owns a 22.92% stake in EQUILL, a venture capital company established 29 years ago. EQUILL invests in equity and equity featured debt instruments.
The Company recorded a loss of Rs. 1.480 Mn. in 2019 compared to the loss of Rs. 0.241 Mn. recorded for the previous financial year.
Bank’s international operations
Figure – 03