


Business model and risk
The business model of the Bank is centered around financial intermediation and maturity transformation (refer Business Model for Sustainable Value Creation). This enabled the Bank to operate at a much higher level of assets (Rs. 1,387.35 Bn. as at December 31, 2019) relative to the capital available (Rs. 133.16 Bn.), leading to an on balance sheet gearing of 10.42 times. This exposed the Bank to a multitude of risks. While credit risk continues to be the dominant risk followed by operational and market risks based on the amount of capital allocated as per Basel capital adequacy requirements, a host of other risks also have arisen from various emerging developments.Some of these developments are threatening to disrupt the business model of the Bank built on playing an intermediary role (refer Outlook for a list of such emerging developments). As a result, it is imperative that the Bank has a robust risk governance framework and a rigorous risk management function to manage the associated risks, enabling it to optimise the trade-off between risk and return, and continue to create value sustainably into the future.
Bank has taken such context and outlook into account when formulating its risk management strategy in terms of the underlying risk governance and risk management framework.
From a risk management perspective, year 2019 was characterised by lacklustre economic growth, a sharp deterioration in asset quality following the April terrorist attack, stifled credit growth and the resulting excess liquidity, import restrictions and political instability.
Objectives
The primary objectives of the Bank’s risk governance framework and the risk management function are:
- to establish the necessary organisational structure for the management and oversight of risk;
- to define the desired risk profile in terms of risk appetite and risk tolerance levels;
- to institutionalise a strong risk culture within the Bank;
- to establish functional responsibility for decisions relating to accepting, transferring, mitigating and minimising risks and recommending ways of doing so;
- to evaluate the risk profile against the approved risk appetite on an ongoing basis;
- to estimate potential losses that could arise from risk exposures assumed;
- to periodically conduct stress testing to ensure that the Bank holds sufficient buffers of capital and liquidity to meet unexpected losses and honour contractual obligations; and
- to integrate risk management with strategy development and execution.
Key developments in 2019
Major initiatives relating to risk governance and risk management during the year included:
- Getting the internally developed credit risk rating model validated by an external party.
The validation process led to further improvements and calibrations to the statistical and qualitative parameters of the models and provided the required confirmation that methods used to develop the models are conceptually sound, that rating models effectively capture the risk and that the underlying data is reasonably accurate. Rating models are currently being used for the evaluation of credit risk at the individual facility level, for the aggregation of credit risk at the portfolio level, assessment of the relative stability of the portfolio including stress testing on impact of rating migration on the Bank's performance and assessment of adequacy of regulatory capital, etc. Upon approval of the CBSL, the internal credit risk ratings can be used for the computation of regulatory capital requirements of the Bank under the advanced approaches of Basel III guidelines. Further, availability of robust credit rating models act as a precursor for adoption of risk-based pricing, sensitivity analysis, stress testing and computing statistical measurements for expected credit loss evaluation.
- A project initiated for implementing an early warning signals (EWS) framework with a view to further enhancing credit quality.
Based on a combination of financial and market intelligence, EWS will enable detection of financially stressed borrower accounts in the existing loan/lending portfolio across all segments. Further, it will provide alerts/signals in case of potential lending opportunities that are in application/evaluation stage, predict and prompt for proactive corrective actions on deteriorating borrowing relationships based on their health as against the defined directive of measurement of such assets and be used in reporting, monitoring and as a follow-up mechanism.
- Establishment of Centralised Credit Processing Unit (CCPU) for advances.
The CCPU was established during the year (described in detail in the section on Operational Excellence) to improve operational efficiency. The same contributed to the fundamental segregation of duties of credit analysis function from the marketing activities to ensure independence in assessment and do away with biases that will invariably assist underwriting activities towards high quality portfolio in the future.
- Introduced Risk Adjusted Return on Capital (RAROC) framework.
Having recognised the need for standard economic-risk measures derived from internally available data, the Bank initiated introduction of RAROC framework in 2019 under the consultancy of an external expert. With this, the Bank is optimistic about implementing performance tracking and a pricing tool that incorporates economic cost of risk and to capture the contribution of each business to the Bank’s cost of capital. This would significantly contribute for making improvements in capital allocation, business performance tracking and overall risk management. In addition, RAROC will add to the armoury of important strategic decision-making tools, further strengthening the risk management framework of the Bank.
- Enhanced information security governance in line with CBSL directions.
The Information Security Council of the Bank, which is the apex management-level body responsible for information security of the Bank was reconstituted in line with the CBSL Direction for Technology Risk Management (Consultation Paper), with the Managing Director as its Chairman, with periodic reporting to the BIRMC and the Board of Directors. In order to enable the Board of Directors to have effective oversight on the adequacy and effectiveness of information security and technology risk management procedures of the Bank, the Board participated in a knowledge enhancing session covering cyber security and technology risk resilience conducted by an industry expert.
- Intensified focus on information and cyber security.
Baseline Security Standard (BSS) was rolled-out across the branch network and in the Head Office departments. All information security related policies and procedures were independently reviewed under the BSS implementation and a draft framework for information security Key Performance Indicators was developed.
Bank commenced work towards fulfilling requirements prescribed in the CBSL Direction for Technology Risk Management (Consultation Paper) through the information security road map devised for the Bank – with focus for 2019 being on Security Operations Centre, Privilege Access Management and Data Loss Prevention. Bank also initiated work towards establishing a proper data protection unit under a dedicated Data Protection Officer with responsibility for developing and implementing the Bank’s data protection strategy covering such aspects as data classification, data leakage prevention, maintaining comprehensive records of all data processing activities, managing/ controlling outgoing data, etc.
Other key developments and outcomes relating to risk management during the year included;
- Intensified focus on maintaining asset quality;
- Conducted meetings of the Executive Committee on Monitoring NPAs on a monthly basis with the participation of Line Heads of Corporate/Personal Banking and Recoveries Department to discuss strategies to turnaround NPA portfolio;
- Achieved credit risk review coverage of 39.8% of the total portfolio during the year (as compared to the CBSL minimum requirement of 30% – 40%);
- Enhanced the scope of operational risk reviews on the subsidiaries of Commercial Bank Group by including CBC Myanmar Microfinance Ltd;
- Successfully renewed the ISO27001:2013 and the PCI DSS certifications of the Bank for 2019, with the re-validation of the Information Security Management System and the PCI DSS implementation by external auditors;
- Completed the pilot roll-out of the SEMS e-learning platform for staff training under the Sustainable Banking Initiative of the
Sri Lanka Banks’ Association.
In line with the industry-wide trend experienced, overall credit risk of the Bank heightened with a deterioration in asset quality as reflected in the gross and net non-performing loans ratios of 4.95% and 3.00% respectively as at 31.12.2019 as against 3.24% and 1.71% a year before. As a result of interest rate reduction that took place in the market and excess liquidity prevailed in the Bank, market risk too increased slightly during the year. Operational risk however did not undergo any major changes compared to the previous year. Despite the formidable challenges in the operating environment, the Bank was able to successfully maintain its stability, resilience and profitability during the year as evident from the operating results and financial position, as a result of the strategic responses to these developments and the robust risk governance and the rigorous risk management function in place.
Risk profile
Risk profile of the Bank as at December 31, 2019 and December 31, 2018 compared to the risk appetite as defined by the policy parameters is given below:
Risk profile
Table – 16
| Risk category and parameter | Key risk indicator | Policy parameter | Actual position | |||
| 31.12.2019 | 31.12.2018 | |||||
| Credit risk: | ||||||
| Quality of lending portfolio | Gross NPA ratio | 4% – 7% | 4.95% | 3.24% | ||
| Net NPA ratio | 3% – 4% | 3.00% | 1.71% | |||
| Impairment percentage over total NPA | 40% – 60% | 42.39% | 54.67% | |||
| Weighted average rating score of the overall lending portfolios | 35% – 40% | 53.44% | 56.62% | |||
| Concentration | Loans and advances by product – Highest exposure to be maintained as a percentage of the total loan portfolio | 30% – 40% | 19.73% | 20.43% | ||
| Advances by economic sub sector (using HHI-Herfindahl-Hirschman-Index) | 0.015 – 0.025 | 0.015 | 0.015 | |||
| Exposures exceeding 5% of the eligible capital (using HHI) | 0.05 – 0.10 | 0.006 | 0.006 | |||
| Exposures exceeding 15% of the eligible capital (using HHI) | 0.10 – 0.20 | 0.004 | 0.007 | |||
| Exposure to any sub sector | 4% – 5% | 3.97% | 4.75% | |||
| Aggregate of exposures exceeding 15% of the eligible capital | 20% – 30% | 12.61% | 20.32% | |||
| Cross border exposure | Rating of the highest exposure of the portfolio on S&P Investment Grade AAA to BBB | AA | AAA | AAA | ||
| Market risk: | ||||||
| Interest rate risk | Interest rate shock: (impact to NII as a result of 100bps parallel rate shock for LKR and 25bps for FCY) | Maximum of Rs. 2,500 Mn. | Rs. 932.75 Mn. | Rs. 1,560.76 Mn. | ||
| Re-pricing gaps (RSA/RSL in each maturity bucket – up to one-year period) | <1.5 Times (other than for 1 month bucket which is <2.5 Times) | 1.39 Times (2.56 Times for 1 month bucket) | 0.98 Times (2.99 Times for 1 month bucket) | |||
| Operational risk | Operational loss tolerance limit (as a percentage of last three years average gross income) | 3% – 5% | 0.78% | 1.70% | ||
| Strategic risk: | Capital adequacy ratios: | |||||
| CET 1 | Over 11% | 12.298% | 11.338% | |||
| Total capital | Over 15% | 16.146% | 15.603% | |||
| ROE | Over 20% | 13.54% | 15.56% | |||
| Creditworthiness – Fitch Rating | AA(lka) | AA(lka) | AA(lka) | |||
(RSA – Rate Sensitive Assets, RSL – Rate Sensitive Liabilities)
Risk appetite and risk profile
The Bank has a clearly defined Risk Appetite Statement incorporating the strategic focus, the types of risk and the maximum amount of aggregate risk exposure the Bank is prepared to assume at any given point in time. Taking into account the regulatory requirements, the ability to withstand losses and stress with the available capital, funding and liquidity positions and the quality of the risk management framework, risk appetite has been expressed in terms of desired asset quality, maximum operational losses, maximum loss on forex trading operations, minimum liquid assets ratio and maximum re-pricing gaps on interest rate risk, among other exhaustive list of risk parameters in use to ascertain overall risk profile of the Bank.
Aided by the solid risk management function, the Bank monitors its risk profile which is the actual risk exposures across all the risk categories on an ongoing basis and takes swift remedial action for any deviations to ensure that it is kept within the risk appetite. With a strong capital adequacy and a strong liquidity position which define the capacity to assume risk, the Bank’s risk profile is characterised by a portfolio of high-quality assets and stable sources of funding fairly diversified in terms of geographies, sectors, products, currencies, size and tenors.
Credit ratings
The Bank was rated AA(lka)/Stable by Fitch Ratings Lanka Limited during 2019, but the outlook was revised to negative in January 2020 consequent to revision of the outlook of the Sri Lankan sovereign and the deterioration in the operating environment. Bank’s Bangladesh operations is rated AAA by Credit Rating Information and Services Limited (CRISL). The rating of AA(lka) is the strongest rating given to a Sri Lankan non-state sector bank while AAA is the highest credit rating given to any financial institution in Bangladesh by CRISL. These credit ratings depict the creditworthiness of the Bank and its ability to borrow which in turn takes into account the underlying risk profile.
Outlook and plans for 2020 and beyond
Please refer Operating Environment for an analysis of the outlook for the Sri Lankan economy and the financial services sector for 2020 and beyond.
The Bank envisages the importance of risk governance and risk management function to increase in the wake of the widening and deepening banking regulation, pervasive technological advances and macroeconomic shocks. Hence, the Bank will continue to strengthen the risk governance and risk management function further through the necessary changes to the mandate, structure, resourcing, competencies, technologies, MIS, data analytics etc., thereby aligning business strategies with sound risk management practices and making risk management function more forward looking and proactive.
Specific initiatives in this regard will include:
- Implementing a Security Incident and Event Management solution and extending it towards a proper Security Operations Centre;
- Complete the implementation of the identified Privilege Access Management solution and operationalise same by establishing required policy/procedure for independent review of privilege user access;
- Active participation of risk management function in strategy setting and planning process;
- Adopting a more forward-looking approach to risk management.
Risk management framework
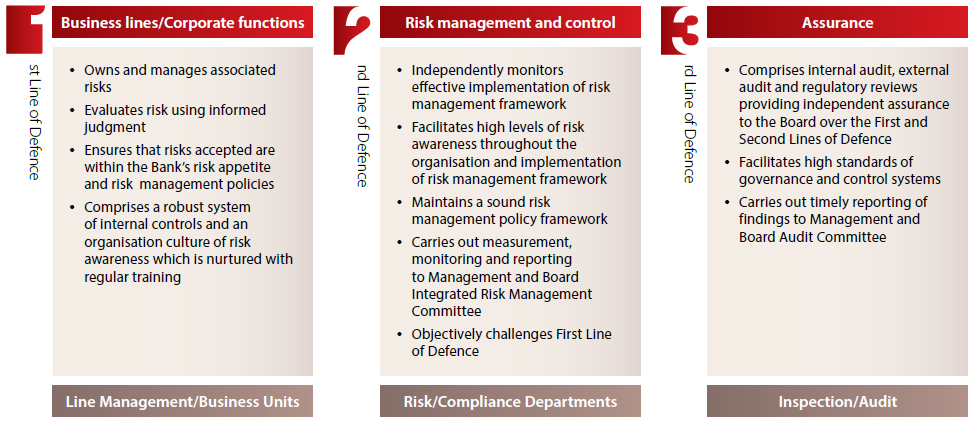
In order to ensure a structured approach to managing all its risk exposures, the Bank has developed an overarching risk management framework based on the Three Lines of Defence model. Underpinned by rigorous organisational structures, systems, processes, procedures and industry best practices, Risk Management Framework (RMF) takes into account all plausible risks and uncertainties the Bank is exposed to. The Three Lines of Defence model, which is the international standard, enables the Bank to have specific skills for managing risk and guides its day-to-day operations with the optimum balance of responsibilities.
RMF is subject to an annual review or more frequently if the circumstances so warrant, taking into account changes in the regulatory and operating environments.
Three lines of defence
Figure – 19
Risk Governance
Risk governance is the responsibility of the Board for establishing the necessary organisational structure for the management and oversight of risk, defining the risk profile in terms of the risk appetite and the risk tolerance levels and institutionalising a strong risk culture.
Applying the best practice in corporate governance to risk management, Board of Directors has established a robust governance structure comprising Board committees, executive functions and executive committees through which authority is exercised and decisions are taken and implemented. It facilitates accountability for risk at all levels of the Bank and across all risk types the Bank is faced with, enabling a disciplined approach to managing risk. The organisation of the Bank’s risk governance is given in Figure 20. Given the highly specialised nature and also in the interest of an integrated and consistent approach, decision-making on risk management is centralised to a greater extent in several risk management committees.
Board of Directors
As the body responsible for strategy and policy formulation, objective setting and for overseeing executive functions, the Board of Directors (refer the section on Board of Directors and Profiles for the profiles of the members) has the overall responsibility for understanding the risks assumed by the Bank and the Group and for ensuring that they are appropriately managed. The Board discharges this responsibility directly by determining the risk appetite of the Bank which is strongly correlated to achieving its strategic goals and indirectly by delegating oversight responsibility to four Board committees (listed below) which work closely with the executive functions and executive level committees to review and assess the effectiveness of the risk management function and report to the Board on a regular basis. These reports provide a comprehensive perspective of the Bank’s risk management efforts and outcomes, enabling the Board to identify the risk exposures, any potential gaps and mitigating actions necessary, on a timely basis. The tone at the top and the corporate culture reinforced by the ethical leadership of the Board plays a key role in managing risk at the Bank.
Besides the tone at the top and the Three Lines of Defence model, the ethical conduct of the business too plays a significant role in managing risk in the Bank. The Bank’s Code of Ethics sets out the Bank’s unwavering commitment and expectations of all the employees to undertaking business in a responsible, transparent and disciplined manner and demands the highest level of honesty, integrity and accountability from all employees.
Apart from the Bank, the Board of Directors closely monitors the risk profile of all the subsidiaries in the Group (refer the list of subsidiaries).
Board committees
The Board has setup four Board committees as given below to assist it in discharging its oversight responsibilities for risk management;
- Board Audit Committee (BAC)
- Board Integrated Risk Management Committee (BIRMC)
- Board Credit Committee (BCC)
- Board Strategy Development Committee (BSDC)
Among other things, these committees periodically review and make recommendations to the Board on risk appetite, risk profile, strategic decisions, risk management and internal controls framework, risk policies, limits and delegated authority.
Details relating to composition, terms of reference, authority, meetings held and attendance, activities undertaken during the year etc., of each of these Board committees are given in the chapter on Governance and Risk Management.
Executive committees
Responsibility for the execution of the strategies and plans in accordance with the mandate of the Board of Directors while maintaining the risk profile within the approved risk appetite, rests with the Executive Management. Spearheaded by the Executive Integrated Risk Management Committee (EIRMC), a number of committees (listed below) on specific aspects of risk have been set up to facilitate risk management across the First and the Second Lines of Defence.
- Asset and Liability Committee (ALCO)
- Credit Policy Committee (CPC)
- Executive Committee on Monitoring Non-Performing Advances (ECMN)
- Information Security Council (ISC)
- Business Continuity Management Steering Committee (BCMSC)
Comprising members from units responsible for credit risk, market risk, liquidity risk, social and environmental risk, operational risk and IT risk, EIRMC coordinates communication with the BIRMC to ensure that risk is managed within the risk appetite. Details relating to composition of each of the executive committees are given in the section on “How We Govern”.
Integrated Risk Management Department (IRMD) is headed by the Chief Risk Officer who participates in the executive committees listed above and the BIRMC, BCC and BAC. The IRMD independently monitors compliance of the First Line of Defence (LOD) to the laid down policies, procedures and limits and escalates deviations to the relevant executive committees. It also provides the perspective on all types of risk for the above committees to carry out independent risk evaluations and share their findings with the Line Managers and Senior Management enabling effective communication of material issues and to initiate deliberations and necessary action.
Risk governance structure
Figure – 20
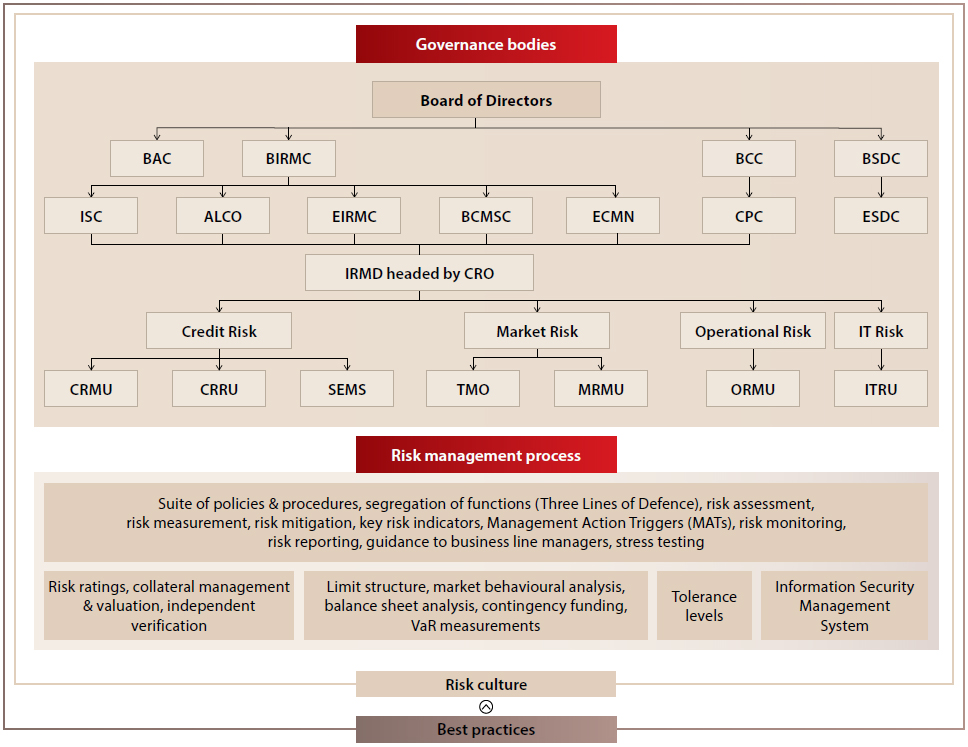
BAC – Board Audit Committee, BIRMC – Board Integrated Risk Management Committee, BCC – Board Credit Committee, BSDC – Board Strategy Development Committee,
ISC – Information Security Council, ALCO – Asset & Liability Committee, EIRMC – Executive Integrated Risk Management Committee, BCMSC – Business Continuity Management Steering Committee,
ECMN – Executive Committee on Monitoring NPAs, CPC – Credit Policy Committee, ESDC – Executive Strategy Development Committee, IRMD – Integrated Risk Management Department,
CRMU – Credit Risk Management Unit, CRRU – Credit Risk Review Unit, SEMS – Social & Environmental Management System, TMO – Treasury Middle Office, MRMU – Market Risk Management Unit,
ORMU – Operational Risk Management Unit, ITRU – IT Risk Management Unit
Risk Management
Risk management is the functional responsibility for identifying, assessing and mitigating risks, finding risk mitigation methods, monitoring early warning signs, forecasting potential for future losses and implementing plans to contain losses/ risk transfer.
Risk management infrastructure
Risk management infrastructure of the Bank includes both human and physical resources that enhance the preparedness to identify and manage risk including the mandate, policies and procedures, limits, tools, databases, competencies, communication etc. Significant investments were made in resources to build capacity in risk management infrastructure and to maintain it up to date by embracing international best practices.
Given that managing risk is a responsibility of each and every employee of the Bank for which each and every employee needs to understand the risks the Bank is exposed to, IRMD provides appropriate training/awareness to the employees, risk owners in particular, disseminating knowledge and enhancing skills on all aspects related to risk, inculcating the desired risk culture.
Risk management policy, procedures and limits
The Bank has a comprehensive risk management policy that addresses all the risks managed by the Bank, encompassing compliance with the regulatory requirements including the Banking Act Direction No. 07 of 2011 – Integrated Risk Management Framework for Licensed Commercial Banks based on the Basel Framework and subsequent directives issued by the CBSL. Apart from institutionalising the risk knowledge base, this helps to minimise bias and subjectivity in risk decisions. This key document clearly defines the objectives, outlines priorities and processes as well as the roles of the Board and the Management in managing risk, shaping the risk culture of the Bank. The Risk Assessment Statement (RAS) sets out the limits for risks and forms an integral part of the risk management framework. The RAS and all risk policies are reviewed by the BIRMC and Board of Directors at least annually or more frequently depending on the regulatory and business needs.
The overall risk exposure of the Bank including its overseas operations is compliant with the regulatory framework of the CBSL. Additionally, in order to ensure compliance, the risk management framework takes into account the regulatory requirements of the respective countries where the Bank conducts its operations.
The Bank has issued detailed operational guidelines to facilitate implementation of the risk management policy and the limits specified in the RAS. These guidelines relate to specification of types of facilities, processes and terms and conditions under which the Bank conducts business, providing clarity to the employees in their day-to-day work.
Risk management framework
Figure – 21

Risk management tools
The Bank employs a combination of qualitative and quantitative tools for identifying, measuring, managing and reporting risks. The choice of a tool(s) for managing a particular risk depends on the likelihood of occurrence and the impact of the risk as well as the availability of data. These tools vary from early warning signs, threat analysis, risk policies, risk registers, risk maps, risk dashboards, RCSA, diversification, covenants, Social and Environmental Management System, workflow-based operational risk management system, insurance and benchmarking to limits, gap analysis, NPV analysis, swaps, caps and floors, hedging, risk rating, risk scoring, risk modelling, Duration, scenario analysis, marking to market, stress testing and VaR analysis.
Summary of key risks
Figure – 21
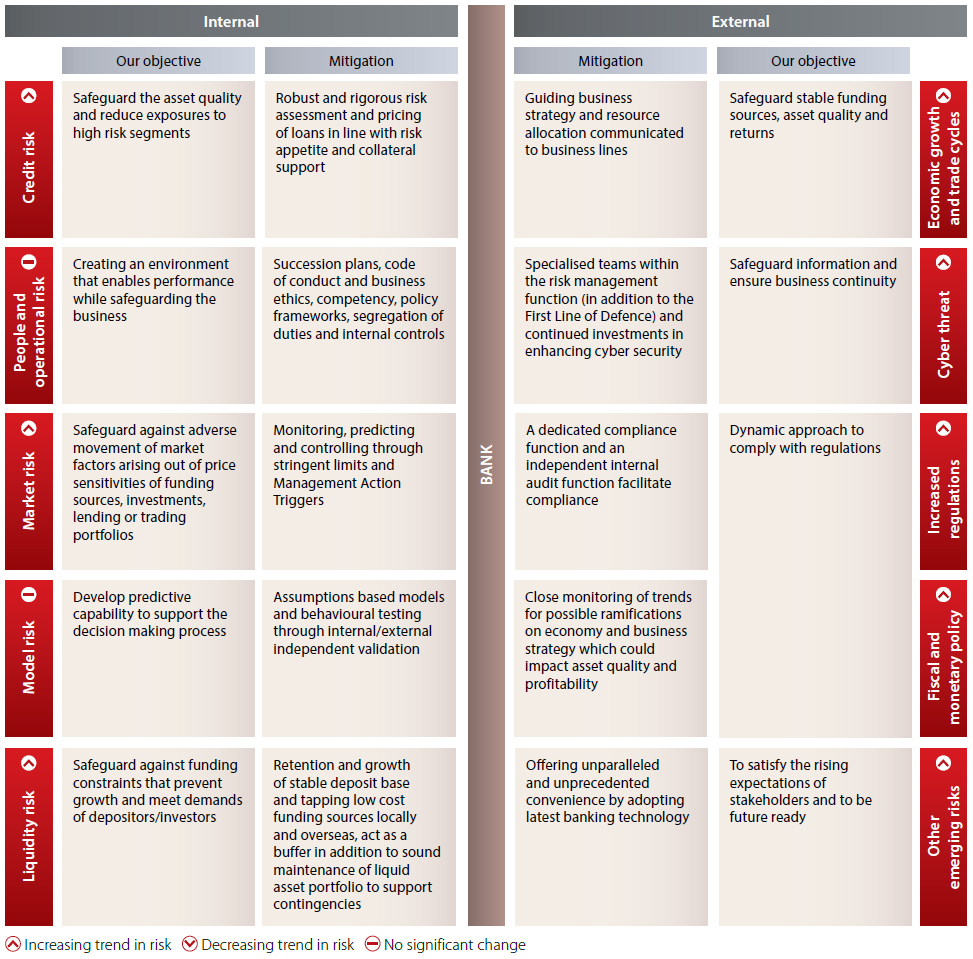
Types of risks
Conventionally, the Bank is exposed to credit, market, liquidity, operational, reputational, IT, legal and strategic risks which taken together determine the risk profile of the Bank. The Bank manages these risks through its robust risk management framework. Changes in various external and internal factors affect the risk profile on an ongoing basis. External factors include movements in macroeconomic variables, political instability, changes in Government fiscal and monetary policies, regulatory developments mounting stakeholder pressures and growing sustainability concerns. Such developments could impact public perceptions, disposable income of people, demand for banking products and services, funding mix, interest margins and tax liabilities of the Bank. Internal factors may include strategic miscalculations, lapses in implementing the risk management framework, assumptions about macroeconomic variables turning out to be different, execution gaps in internal processes etc. These factors, if not properly managed, may affect the risk profile of the Bank, hampering the objective of sustainable value creation for all its stakeholders in the short, medium and long term.
In addition, certain potentially disruptive emerging risks and uncertainties have made the operating environment even more volatile and unpredictable, leading to some of the long-standing assumptions about markets, competition and even business fundamentals to be less valid today. These call for the Bank to better understand the customer and deliver on their expectations while achieving execution excellence in internal processes. Believing that these offer opportunities to differentiate its value proposition for future growth, the Bank deals with these developments through appropriate strategic responses. Summary of key risks is given in Figure 22.
All these developments have made the operating environment very complex, dynamic and competitive and risk management very challenging. Nevertheless, the effective management of these risks and uncertainties is a sine qua non to the execution of the Bank’s strategy, creating value in the short, medium and long term for all its stakeholders. Hence, deliberations on risk management were on top of the agenda in all Board, Board Committee and Executive Committee meetings of the Bank.
A description of the different types of risks managed by the risk management function of the Bank and risk mitigation measures adopted are as follows:
Credit risk is the risk of potential loss resulting from the failure of a customer/borrower or counterparty to honour its financial or contractual obligations to the Bank. It may arise from direct lending activities as well as from commitments and contingencies. Total credit risk of the Bank constitutes counterparty risk, concentration risk and settlement risk.
Maximum credit risk exposure
Table – 17
| As at December 31, 2019 | |||
| Rs. Mn. | % | ||
| Net carrying amount of credit exposure | |||
| Cash and cash equivalents | 52,535 | 2.9 | |
| Placements with banks | 24,527 | 1.3 | |
| Financial assets at amortised cost – Loans and advances to banks | 758 | 0.0 | |
| Financial assets at amortised cost – Loans and advances to other customers | 884,646 | 48.1 | |
| Financial assets at amortised cost – Debt and other financial instruments | 101,145 | 5.5 | |
| Financial assets measured at fair value through other comprehensive income | 197,568 | 10.7 | |
| Total (a) | 1,261,179 | ||
| Off-balance sheet maximum exposure | |||
| Lending commitments | 109,046 | 5.9 | |
| Contingencies | 469,308 | 25.6 | |
| Total (b) | 578,354 | ||
| Total of maximum credit exposure (a + b) | 1,839,533 | 100.0 | |
| Gross carrying amount of loans and advances to other customers | 920,457 | ||
| Stage 3 (credit impaired) loans and advances to other customers | 96,663 | ||
| Impaired loans as a % of gross loans and advances to other customers | 10.5 | ||
| Allowance for impairment – loans and advances to other customers | 35,811 | ||
| Allowance for impairment as a % of gross loans and advances to other customers | 3.9 | ||
| Impairment charge – loans and advances to other customers | 10,043 | ||
The maximum credit exposure of the Bank (Rs. 1,839.5 Bn. In 2019) remained more or less the same levels as of previous year (Rs. 1,839.2 Bn. in 2018), amidst the very challenging economic environment prevailed in the country.
According to the SLFRS 9 classification, the credit impaired (Stage 3) loans to customers stood at Rs. 96.6 Bn. (Rs. 52.9 Bn. in 2018) which is 10.5% (5.9% in 2018) of the gross loans and advances to other customers portfolio of the Bank.
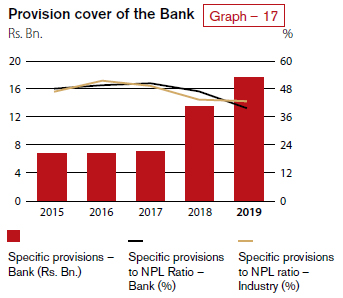
Further, the increasing trend experienced in loans and advances to other customers getting classified as impaired has resulted in a cumulative impairment allowance of Rs. 35.8 Bn. (Rs. 29.1 Bn. in 2018) and an impairment charge of Rs.10.0 Bn. (Rs. 8.1 Bn. In 2018). for the year under discussion.
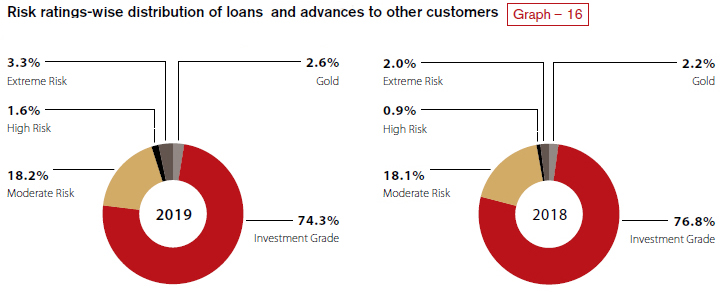
74.3% – Distribution of borrower ratings
Borrowers with investment Grade Ratings where default risk is considered to be very low, comprised 74.3% of the total loans and advances to other customers.
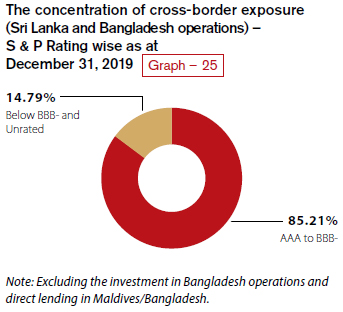
85.2% – Distribution of country rating
Exposure to countries which are rated AAA to BBB – (S&P or equivalent) accounted for 85.2% of the total cross – border exposure of the Bank.
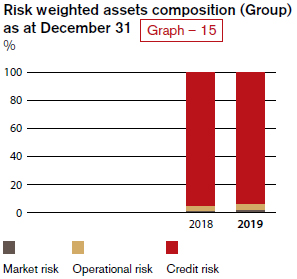
Managing credit risk
Given that the lending portfolio accounts for 63.8% of total assets and credit risk accounts for over 90% of the risk-weighted assets, management of credit risk is critical to the Bank. We endeavour to manage credit risk management going beyond mere regulatory compliance in order to enhance value. It is managed through the credit risk management framework approved by the Board which comprises a robust risk governance structure and a comprehensive suite of risk management processes which include policies and procedures, risk ratings, collateral management and valuation, segregation of credit risk management functions, social and environmental risk management, independent verification of risk assessments, credit risk monitoring,
post disbursement review, providing direction to business line managers and sharing information with internal audit.
Review of credit risk
Deterioration in the operating environment led to a heightening of credit risk and a drop in asset quality across the financial services industry during the year. Similar impact was experienced by the Bank, but NPL ratios remained within the established policy parameters by the year end (refer risk profile). The elevated levels of attention given to loan approvals and post-sanction monitoring and recovery efforts will assist the Bank to bring down these ratios in 2020.
Besides the effective credit risk management framework referred to above that guides the Bank throughout the process of on-boarding new exposure and monitoring existing exposure contributing immensely to preserve the quality of the loan book, the Bank is cautious and exercises restraint in the choice of customers, products, segments and geographies it caters to. Continuous monitoring of age analysis and the underlying movement across arrears buckets of past due loans enabled the Bank to swiftly take action, thereby moderating default risk during the year.
Concentration risk
Management of concentration risk is primarily through diversification of business across industry sectors, products, counterparties and geographies. The Bank’s RAS defines the limits for these segments and the Board, BIRMC, EIRMC and the CPC monitor these exposures to ensure compliance. Based on the trends and events shaping the business environment, they also make recommendations on modifications to specified limits.
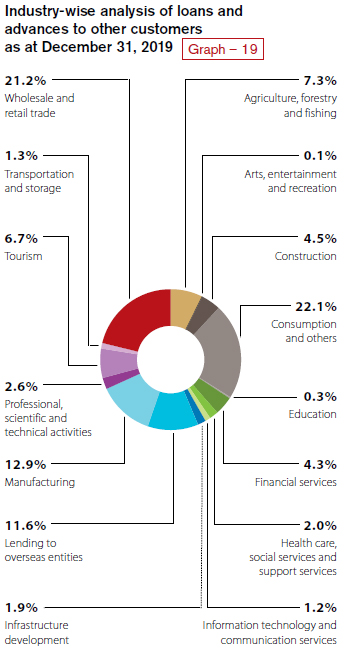
The stage 3 credit impaired loans and advances to other customers distribution to identified industry sectors as at year end is given in Table 18.
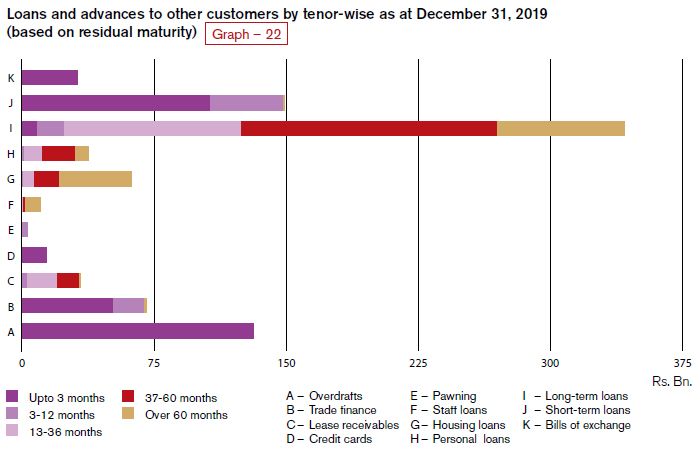
Graph 20 depicts that the tenor-wise breakdown of the portfolio of total loans and advances to other customers is within the risk appetite of the Bank.
Distribution of stage 3 credit impaired loans and advances to other customers as at December 31, 2019
Table – 18
| Industry category | Stage 3 loans and advances | Allowance for individual impairment | Allowance for collective impairment | ECL Allowance | Amount written off | |
| Rs. ’000 | Rs. ’000 | Rs. ’000 | Rs. ’000 | Rs. ’000 | ||
| Agriculture, forestry and fishing | 10,281,037 | 796,991 | 2,170,744 | 2,967,735 | 159,230 | |
| Arts, entertainment and recreation | 131,929 | – | 43,329 | 43,329 | – | |
| Construction | 6,906,267 | 3,365,552 | 1,228,750 | 4,594,302 | 61,599 | |
| Consumption and others | 9,980,125 | 20,991 | 3,901,378 | 3,922,369 | 381,953 | |
| Education | 177,245 | – | 80,882 | 80,882 | 44 | |
| Financial services | 736,196 | 8,690 | 98,122 | 106,812 | 11,041 | |
| Healthcare, social services and support services | 994,571 | 258 | 256,972 | 257,230 | 9,875 | |
| Information technology and communication services | 2,026,312 | 22,829 | 282,040 | 304,869 | 64,254 | |
| Infrastructure development | 2,777,205 | 279,567 | 131,746 | 411,313 | 182 | |
| Lending to overseas entities | 797,869 | 81,626 | 200,278 | 281,904 | 221,472 | |
| Manufacturing | 21,236,871 | 1,114,014 | 3,723,377 | 4,837,391 | 46,935 | |
| Professional, scientific and technical activities | 464,211 | – | 169,350 | 169,350 | 17,337 | |
| Tourism | 17,978,163 | 223,879 | 1,181,237 | 1,405,116 | 1,123,961 | |
| Transportation and storage | 3,226,779 | 966,696 | 306,835 | 1,273,531 | 23,629 | |
| Wholesale and retail trade | 18,948,203 | 513,859 | 3,709,188 | 4,223,047 | 121,727 | |
| Total | 96,662,983 | 7,394,952 | 17,484,228 | 24,879,180 | 2,243,239 |
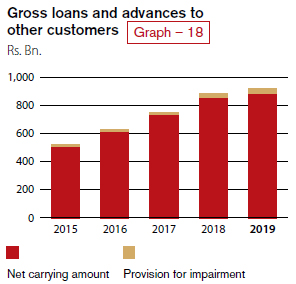
A geographical analysis (Graph 18) reflects a high concentration of loans and advances in the Western Province which is due to concentration of economic activities in that province and the headquarters of most borrowing entities being located there.
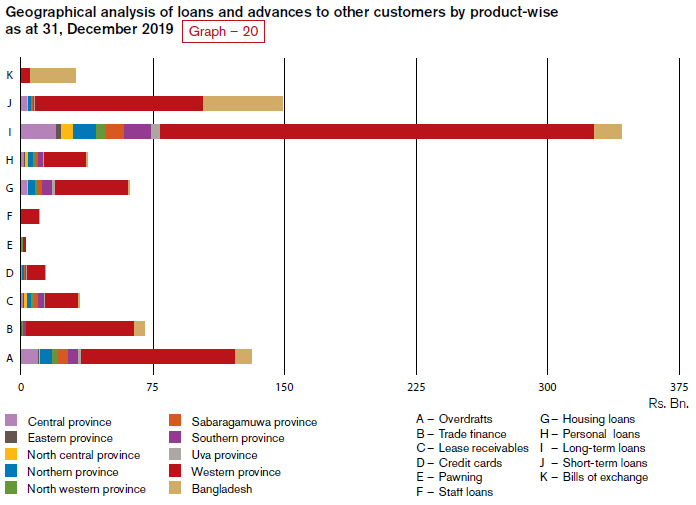
Product-wise analysis of loans and advances (Graph 19) also reflects the effectiveness of the Bank’s credit policies with risk being diversified across the Bank’s range of credit products.
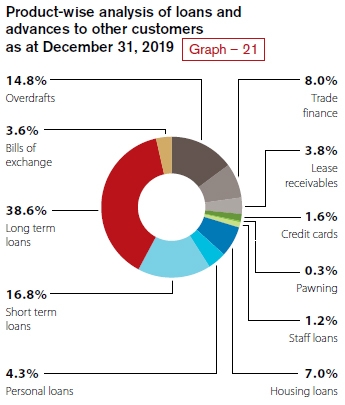
The relatively high exposure of 38,6% to long-term loans is rigorously monitored and mitigated with collateral.
Counterparty risk
Counterparty risk is managed through the laid down policies/procedures and limit structures including single borrower limits and Group exposure limits with sub-limits for products etc. The limits set by the Bank are far more stringent than those stipulated by the regulator. This provides the Bank with a greater leeway in managing its concentration levels with regard to the counterparty exposures.
Loans and receivables to banks, both local and foreign, constitute a key component of counterparty risk. It is being monitored through a specific set of policies, procedures and a limit structure. At frequent intervals, the counterparty bank exposures are monitored against the established prudent limits whilst market information on the financial/economic performance of these counterparties are subject to a rigorous scrutiny throughout the year and the limits are revised to reflect the latest information where deemed necessary.
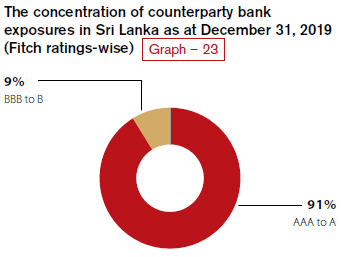
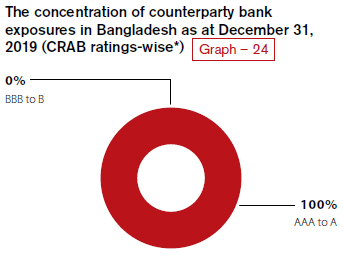
The analysis uses Fitch Ratings for local banks in Sri Lanka and Credit Ratings Agency in Bangladesh (CRAB) for local banks in Bangladesh (Equivalent CRISL/Alpha ratings have been used where CRAB ratings are not available). Exposures for local banks in Sri Lanka rated AAA to A category stood at 91% (Graph 21) whilst 100% of exposure of local banks in Bangladesh consisted of AAA to A rated counterparty banks (Graph 22).
Cross-border risk
The risk that the Bank will be unable to obtain payment from its customers or third parties on their contractual obligations as a result of certain actions taken by foreign governments, mainly relating to convertibility and transferability of foreign currency is referred to as the cross-border risk. Cross-border assets comprise loans and advances, interest-bearing deposits with other banks, trade and other bills and acceptances and predominantly relate to short-term money market activities.
In addition to the limit structures in place to minimise risk arising from over concentration, the Bank continuously monitors macroeconomic and market developments of the countries with exposure to counterparties besides stringent evaluations of counterparties and maintaining frequent dialogue with them. Timely action is taken to suspend/revise limits to countries with adverse economic/political developments.
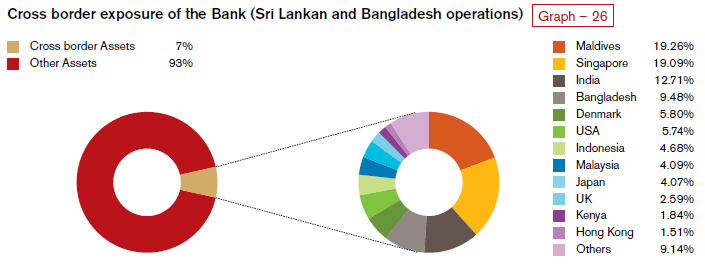
Total cross-border exposure is only 7% of total assets of the Bank (Graph 24). The Bank has cross-border exposures to a spread of countries which primarily include the Maldives, Singapore, India, Bangladesh, Denmark, etc.
Market risk is the risk of loss arising from movements in market driven variables such as interest rates, exchange rates, commodity prices, equity and debt prices and their correlations. The Bank’s operations are exposed to these variables and correlations in varying magnitudes.
Market risk categories
Table – 19
| Major market risk category | Risk components | Description | Tools to monitor | Severity | Impact | Exposure | ||||
| Interest rate | Risk of loss arising from movements or volatility in interest rates | |||||||||
| Re-pricing | Differences in amounts of interest earning assets and interest-bearing liabilities getting re-priced at the same time or due to timing differences in the fixed rate maturities and appropriately re-pricing of floating rate assets, liabilities and off-balance sheet instruments | Re-pricing gap limits and interest rate sensitivity limits | High | High | High | |||||
| Yield curve | Unanticipated changes in shape and gradient of the yield curve | Rate shocks and reports | High | High | High | |||||
| Basis | Differences in the relative movements of rate indices which are used for pricing instruments with similar characteristics | Rate shocks and reports | High | Medium | Medium | |||||
| Foreign exchange | Possible impact on earnings or capital arising from movements in exchange rates arising out of maturity mismatches in foreign currency positions other than those denominated in base currency, Sri Lankan Rupee (LKR) | Risk tolerance limits for individual currency exposures as well as aggregate exposures within regulatory limits for NOP | High | Medium | Medium | |||||
| Equity | Possible loss arising from changes in prices and volatilities of individual equities | Mark-to-market calculations are carried out daily for Fair Value Through Profit and Loss (FVTPL) and Fair Value Through Other Comprehensive Income (FVOCI) portfolios | Low | Low | Negligible | |||||
| Commodity | Exposures to changes in prices and volatilities of individual commodities | Mark to market calculations | Low | Low | Negligible |
Managing market risk
The market risk is managed through the market risk management framework approved by the Board, which comprises a robust risk governance structure and a comprehensive suite of risk management processes which include policies, market risk limits, Management Action Triggers (MATs), risk monitoring and risk assessment.
Review of market risk
Market risk arises mainly from the
Non-Trading Portfolio (Banking Book) which accounted for 90.82% of the total assets and 93.54% of the total liabilities as at December 31, 2019. Exposure to market risk arises mainly from IRR and FX risk as the Bank has negligible exposure to commodity related price risk and equity and debt price risk which was less than 10% of the total risk weighted exposure for market risk.
The Bank’s exposure to market risk analysed by Trading Book and Non-Trading Portfolios (or Banking Book) are set out in the Note 69.3.1.
Market risk portfolio analysis
The gap report is prepared by stratifying Rate Sensitive Assets (RSA) and Rate Sensitive Liabilities (RSL) into various time bands according to maturity (if they are fixed rates) or time remaining to their next re-pricing
(if they are floating rates). Balances of savings deposits are distributed in line with the findings of a behavioural analysis conducted by the Bank. Vulnerability of the Bank to interest rate volatility is indicated by the gap between RSA and RSL. (Refer Table 21)
Interest rate sensitivity gap analysis of assets and liabilities of the banking book as at December 31, 2019 – Bank
Table – 21
| Description | Up to 3 Months Rs. ’000 | 3-12 months Rs. ’000 | 1-3 years Rs. ’000 | 3-5 years Rs. ’000 | More than 5 years Rs. ’000 | Non-sensitive Rs. ’000 | Total as at December 31, 2019 Rs. ’000 | |
| Total financial assets | 623,167,324 | 215,364,964 | 201,320,952 | 120,456,961 | 71,528,976 | 81,948,135 | 1,313,787,312 | |
| Total financial liabilities | 446,889,518 | 438,751,543 | 82,755,244 | 50,421,177 | 128,908,291 | 69,443,286 | 1,217,169,059 | |
| Period gap | 176,277,806 | (223,386,579) | 118,565,708 | 70,035,784 | (57,379,315) | 12,504,849 | 96,618,253 | |
| Cumulative gap | 176,277,806 | (47,108,773) | 71,456,935 | 141,492,719 | 84,113,404 | 96,618,253 | ||
| RSA/RSL | 1.39 | 0.49 | 2.43 | 2.39 | 0.55 |
Interest rate risk (IRR)
Extreme movements in interest rates expose the Bank to fluctuations in Net Interest Income (NII) and have the potential to impact the underlying value of interest-earning assets and interest-bearing liabilities and off-balance sheet items. The main types of IRR to which the Bank is exposed to are
re-pricing risk, yield curve risk and basis risk.
Sensitivity of projected NII
Regular stress tests are carried out on Interest Rate Risk in Banking Book (IRRBB) encompassing changing positions and new economic variables together with systemic and specific stress scenarios. Change in value of the Fixed Income Securities (FIS) portfolio in FVTPL and FVOCI categories due to abnormal market movements is measured using both Economic Value of Equity (EVE) and Earnings At Risk (EAR) perspectives. Results of stress tests on IRR are analysed to identify the impact of such scenarios on the Bank’s profitability and capital.
Impact on NII due to rate shocks on LKR and FCY is continuously monitored to ascertain the Bank’s vulnerability to sudden interest rate movements (Refer Table 20)
Sensitivity of NII to rate shocks
Table – 20
| 2019 | 2018 | ||||
| Parallel increase Rs. ’000 | Parallel decrease Rs. ’000 | Parallel increase Rs. ’000 | Parallel decrease Rs. ’000 | ||
| As at December 31, | 932,750 | (911,553) | 1,560,756 | (1,557,263) | |
| Average for the year | 1,425,767 | (1,413,235) | 1,493,675 | (1,490,832) | |
| Maximum for the year | 1,646,844 | (1,643,315) | 1,646,558 | (1,639,199) | |
| Minimum for the year | 932,750 | (911,553) | 1,269,334 | (1,267,132) | |
Foreign exchange risk
Stringent risk tolerance limits for individual currency exposures as well as aggregate exposures within the regulatory limits ensure that potential losses arising out of fluctuations in FX rates are minimised and maintained within the Bank’s risk appetite.
USD/LKR exchange rate marginally appreciated by 0.844% (Source Bloomberg) during the year under review.
Please refer to Note 69.3.3 – Exposure to currency risk - non trading portfolio.
Stress testing is conducted on NOP by applying rate shocks ranging from 6% to 15% in order to estimate the impact on profitability and capital adequacy of the Bank (Refer Table 25). The impact of a 1% change in exchange rate on the foreign currency position indicated a loss of Rs. 267.68 Mn. on the positions as at December 31, 2019. (Refer Graph 43 on page 284)
Equity price risk
Although the Bank’s exposure to equity price risk is negligible, mark to market calculations are conducted daily on FVTPL and FVOCI portfolios. The Bank has also calculated VaR on equity portfolio. Note 69.3.4 summarises the impact of a shock of 10% on equity price on profit, other comprehensive income (OCI) and equity.
Commodity price risk
The Bank has a negligible exposure to commodity price risk which is limited to the extent of the fluctuations in gold price on the pawning portfolio.
Liquidity risk is the Bank’s inability to meet “on” or “off” balance sheet contractual and contingent financial obligations as they fall due, without incurring unacceptable losses.
Banks are vulnerable to liquidity and solvency problems arising from mismatches in maturities of assets and liabilities. Consequently, the primary objective of liquidity risk management is to assess and ensure availability of funds required to meet obligations at appropriate times, both under normal and stressed conditions.
Liquid asset ratios as at December 31, 2019 are given below:
Liquid asset ratios
Table – 22
| Domestic Banking Unit (DBU) % | Off-Shore Banking Unit (OBC) % | |
| Statutory Liquid Assets Ratio (SLAR) | 30.42 | 25.25 |
| Local currency % | All currency % | |
| Liquidity Coverage Ratio (LCR) | 158.79 | 224.74 |
Managing liquidity risk
The Bank manages liquidity risk through policies and procedures, measurement approaches, mitigation measures, stress testing methodologies and contingency funding arrangements. As experienced across the industry, poor credit growth caused the Bank to have an excess liquidity situation throughout the year, as can be seen by the ratios given in Table 22. It was a challenge for the Bank to manage such liquidity to generate an optimum return. Major portion of the excess liquidity had to be invested in Government securities, both denominated in LKR and USD at optimum yields to minimise adverse effects on profitability.
224.74% Liquidity Coverage Ratio
Liquidity Coverage Ratio of the Bank stood at 224.74% as at December 31, 2019, well above the minimum statutory requirement of 100%.
137.05% – Net Stable Funding Ratio
Net Stable Funding Ratio of the Bank stood at 137.05% as at December 31, 2019, well above the minimum statutory requirement of 100%.
Liquidity risk review
The net loans to deposits ratio is regularly monitored by the ALCO to ensure that the asset and liability portfolios of the Bank are geared to maintain a healthy liquidity position. NSFR indicating stability of funding sources compared to loans and advances granted was maintained well above the policy threshold of 100%, which is considered healthy to support the Bank’s business model and growth.
The key ratios used for measuring liquidity under the stock approach are given in Table 23 below:
Table – 23
| Liquidity ratios % | As at December 31, 2019 | As at December 31, 2018 | |
| Loans to customer deposits | 0.87 | 0.91 | |
| Net loans to total assets | 0.64 | 0.66 | |
| Liquid assets to short-term liabilities | 0.48 | 0.26 | |
| Purchased funds to total assets | 0.21 | 0.26 | |
|
(Large liabilities – Temporary Investments) to (Earning assets – Temporary Investments) |
0.18 | 0.19 | |
| Commitment to total loans | 0.19 | 0.19 |
Maturity gap analysis
Maturity gap analysis of assets and liabilities of the Bank as at December 31, 2019 is given in Note 69.2.2 (a) to the Financial Statements.
Maturity analysis of financial assets and liabilities of the Bank indicates sufficient funding for foreseeable adverse situations based on prescribed behavioural patterns observed.
Maturity analysis of financial assets and financial liabilities of the Bank does not indicate any adverse situation when due cognisance is given to the fact that cash outflows include savings deposits which can be considered as a quasi stable source of funds based on historical behavioural patterns of such depositors as explained below.
Behavioural analysis on savings accounts
In the absence of a contractual agreement about maturity, savings deposits are treated as a non-maturing demand deposit. There is no exact re-pricing frequency for the product and the Bank resets rate offered on these deposits based on re-pricing gap, liquidity and profitability etc. Since, there is no exact re-pricing frequency and that it is not sensitive to market interest rates, segregation of savings products among the predefined maturity buckets in the maturity gap report is done based on the regular simulations carried out by the Bank in line with a behavioural study.
The liquidity position is measured in all major currencies at both individual and aggregate levels to ensure that potential risks are within specified threshold limits. Additionally, potential liquidity commitments resulting from loan disbursements and undrawn overdrafts are also monitored to ensure sufficient funding sources.
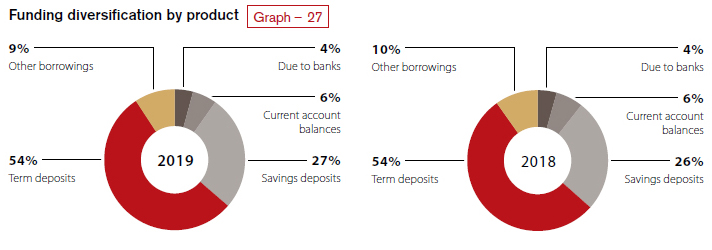
Funding diversification by product
The Bank’s primary sources of funding are deposits from customers and other borrowings. The Graph 25 provides a product-wise analysis of the Bank’s funding diversification as at end of 2019 and 2018.
Operational risk is the risk of losses stemming from inadequate or failed internal processes, people and systems, or from external events such as natural disasters, social or political events. It is inherent in all banking products and processes and Bank's objective is to control it in a cost-effective manner. Operational risk includes legal risk but excludes strategic and reputational risk.
Managing operational risk
The Bank manages operational risk through policies, risk assessment, risk mitigation including insurance coverage, procedures relating to outsourcing of business activities, managing technology risk, a comprehensive Business Continuity Plan (BCP) and Disaster Recovery Plan (DRP), creating a culture of risk awareness across the Bank, stress testing and monitoring and reporting.
Policies and procedures relating to outsourcing of business activities of the Bank ensure that all significant risks arising from outsourcing arrangements of the Bank are identified and effectively managed on a continuous basis. Details of all outsourced functions are reported to the CBSL annually. Due diligence tests on outsourced vendors are carried out by respective risk owners prior to executing new agreements and renewal of existing agreements. Further, bi-annual review meetings are conducted with key IT service providers to monitor service performance levels and to verify adherence to the agreements.
Business continuity management
Business Continuity Management (BCM) framework of the Bank encompasses business continuity, disaster recovery, crisis management, incident management, emergency management and contingency planning activities. These activities will ensure that the Bank is committed to serve its customers, employees, shareholders and suppliers with minimum business interruptions in the event of an unforeseen disruption to its business activities arising from man-made, natural or technical disasters.
The scope of the BCM includes programme initiation and management, risk evaluation and business impact analysis, developing business continuity strategies, emergency preparedness and response, developing and implementing business continuity plans, awareness building and training, business continuity plan exercise, audit and maintenance, crisis communications and coordination with external agencies.
During previous year (2018), the BCP of the Bank was revamped in line with industry best practices in consultation with an external BCP expert. IT Disaster Recovery Plan, which is a key component of BCP was also reviewed and approved by the Board of Directors. IT system recovery capabilities of core banking and other critical systems of the Bank has been further strengthened by way of introducing a secondary high-availability set-up leading to improved redundancy.
A BCP exercise was carried out in September 2019, which was conducted over a period of one week, beyond the current requirement of CBSL to carry out a BCP exercise on a working day. During the week of the BCP drill, the core banking and other critical systems were running from the DR systems. The exercise was a great success with very minimum disruptions, which bears testimony to the maturity attained by the Bank by conducting such exercises over the years. The BCM Unit of the Bank continued with other regular tasks that included on-going alternate site testing, workshops/awareness sessions on BCP conducted for business units, etc.
Review of operational risk
The Bank has a low appetite for operational risks and has established tolerance levels for all types of material operational risk losses based on historical loss data, budgets and forecasts, performance of the Bank, existing systems and controls governing Bank operations etc. Following thresholds have been established based on audited financial statements for monitoring purposes:
- Alert level – 3% of the average gross income for the past three years
- Maximum level – 5% of the average gross income for the past three years
Operational losses for the financial year 2019 were below the internal alert level at 0.78% (of average audited gross income for the past three years). The Bank has been consistently maintaining operational losses below the alert level for the past ten years, reflecting the “tone at the top”, effectiveness of the governance structures and the rigour of processes and procedures in place to manage operational risk.
The Graph 26 analyses the operational risk losses incurred by the Bank in 2019 under each business line/category.
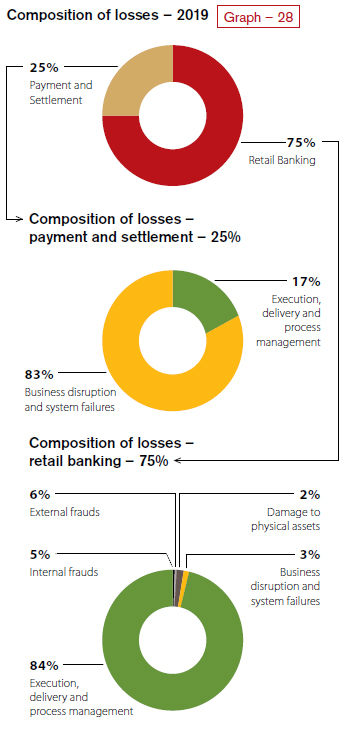
When analysing the losses incurred during 2019 under the Basel II defined business lines, it is evident that the majority (75%) of losses with financial impact falls under the business line of “Retail Banking”, followed by the losses reported under the ‘‘Payment and Settlement” business line (25%). Losses relating to other business lines remain negligible.
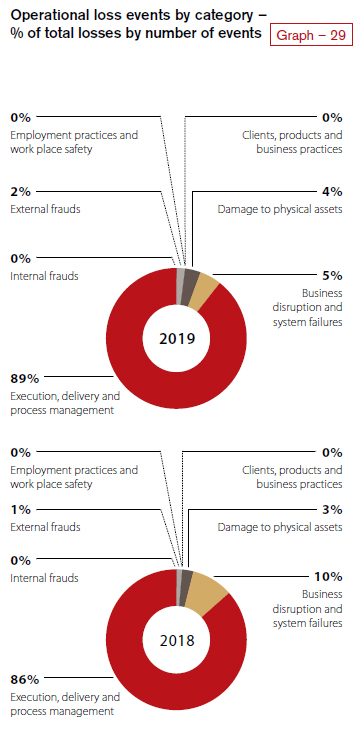
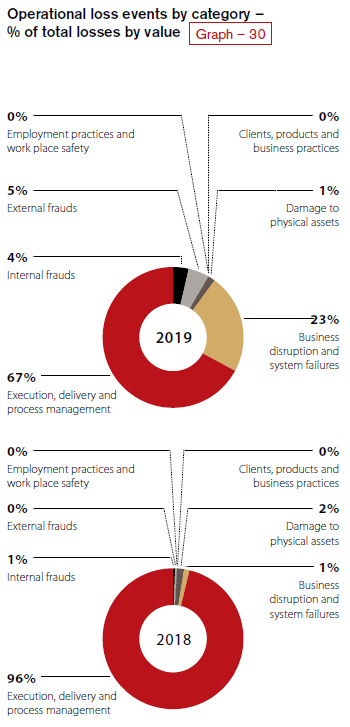
The Graphs 27 and 28 depict the comparison of operational losses reported during 2019 and 2018 under each Basel II loss event type, both in terms of number of occurrences and value.
As typical with operational risk losses, majority of the losses encountered by the Bank during 2019 consisted of high frequency/low financial impact events mainly falling under the loss category Execution, Delivery and Process Management. These low value events are mainly related to cash and ATM operations of the Bank’s service delivery network consisting of over 1,000 points across Sri Lanka and Bangladesh. Individual events with monetary values less than Rs.100,000 accounted for more than 93% of the total loss events for the year. Also, the number of loss events for the year when compared to the number of transactions performed during the year stands at a mere 0.0057%.
When considering the values of the losses incurred by the Bank during the year, they can mainly be categorised under Execution, Delivery and Process Management related and Business Disruption and System Failures. The losses for the year were primarily driven by a limited number of events in these two categories majority of which the Bank managed to resolve through subsequent recovery/rectification with minimum financial impact to the Bank. Further, necessary process improvements and system changes have been introduced to prevent recurrence. Capital allocation pertaining to operational risk for 2019 under Alternative Standardised Approach as per Basel III is Rs. 5.76 Bn., where as the net loss after discounting the subsequent recoveries amounts to a mere 0.75% of this capital allocation. This trend of exceptionally low levels of operational risk losses of the Bank bears testimony to the effectiveness of the Bank’s operational risk management framework and the internal control environment.
IT risk is the business risk associated with use, ownership, operation, involvement, influence and adoption of IT within an organisation. It is a major component of operational risk comprising IT-related events such as system interruptions, errors, frauds through system manipulations, cyber attacks, obsolescence in applications, falling behind competitors concerning the technology, etc., that could potentially affect the whole business. Given the uncertainty with regard to frequency and magnitude, managing IT risk poses challenges. Hence, the Bank has accorded top priority to addressing IT risk, giving more focus to cyber security strategies and continually investing on improving the cyber security capabilities. The Bank’s cyber security strategy is focused on securely enabling new technology and business initiatives while maintaining a persistent focus on protecting the Bank and its customers from cyber threats.
The IT Risk Unit of the IRMD is responsible for implementing the IT risk management framework for the Bank, ensuring that the appropriate governance framework, policies, processes and technical capabilities are in place to manage all significant IT risks. The IT Risk Management Policy, aligned with the Operational Risk Management Policy complements the Information Security Policy, the related processes, objectives and procedures relevant for managing risk and improving information security of the Bank.
RCSA is used as one of the core mechanisms for IT risk identification and assessment, while the IT Risk Unit carries out independent IT risk reviews in line with the established structure of the operational risk management process. Results of these independent IT risk assessments together with audit findings, analysis of information security incidents, internal and external loss data are also employed for IT risk identification and assessment purposes.
IT risk mitigation involves prioritising, evaluating and implementing the appropriate risk-reducing controls or risk treatment techniques recommended from the risk identification and assessment process. The Bank has a multi-layered approach of building controls into each layer of technology, including data, applications, devices, network, etc. This ensures robust end-to-end protection, while enhancing the cyber threat detection, prevention, response and recovery controls. Being the first local bank to be certified under the ISO/IEC 27001 information security standard in 2010, the Bank has maintained the certification throughout, by successfully under-going the annual audits.
The Bank has continued to invest in information security, by enhancing information security governance in line with the CBSL directions and intensifying focus on information and cyber security with the Baseline Security Standard (BSS) being rolled-out across the branch network and in the Head Office. Initiatives taken in this regard are given under Key Developments in 2019 in the chapter on Governance and Risk Management of this report.
Given that risk management relies heavily on an effective monitoring mechanism, the IT Risk Unit carries out continuous, independent monitoring of the Bank’s IT risk profile using a range of tools and techniques including Key IT Risk Indicators (KIRIs).
Defined as the exposure to the adverse consequences resulting from inaccurately drafted contracts, their execution, the absence of written agreements or inadequate agreements, legal risk is an integral part of operational risk. It includes, but is not limited to, exposure to fines, penalties, or punitive damages resulting from supervisory actions, as well as cost of private settlements.
Legal risk is managed by ensuring that applicable regulations are fully taken into consideration in all relations and contracts with individuals and institutions who maintain business relationships with the Bank, and that they are supported by required documentation. Risk of breaching the rules and regulations is managed by establishing and operating a sufficient mechanism for verification of conformity of operations with applicable regulations.
Compliance and regulatory risk refers to the potential risk to the Bank arising from failure to comply with applicable laws, rules and regulations and codes of conduct and may lead to regulatory sanctions, financial losses, disruptions to business activities and reputational damage. A compliance function reporting directly to the Board of Directors is in place to assess the Bank’s compliance with external and internal regulations on an ongoing basis. A comprehensive compliance policy specifies how this key risk is identified, monitored and managed by the Bank in a structured manner. The Bank’s culture and the Code of Ethics too play a key role in managing this risk.
Strategic risk is associated with the strategic decisions and may manifest in the Bank not being able to keep up with the changing market dynamics, leading to loss of market share and failure to achieve strategic goals. Corporate planning and budgeting process and critical evaluation of their alignment with the Bank’s vision, mission and the risk appetite facilitate management of strategic risk. The detailed scorecard-based qualitative model aligned to ICAAP is used to measure and monitor strategic risk of the Bank. This scorecard-based approach takes into consideration a range of factors, including the size and sophistication of the organisation, the nature and complexity of its activities and highlights the areas that need emphasis to mitigate potential strategic risks.
Reputational risk is the risk of adverse impact on earnings, assets and liabilities or brand value arising from negative stakeholder perception of the Bank’s business practices, activities and financial condition. The Bank recognises that reputational risk is driven by a wide range of other business risks relating to the “conduct” of the Bank that must all be actively managed. In addition, the exponential growth in channels of communication such as social media has widened the stakeholder base and expanded the sources of reputational risk. Accordingly, reputational risk is broadly managed through the systems and controls adopted for all other risk types such as credit, market, operational risk etc., which are underpinned by the code of conduct, communication policy and business ethics that prohibit unethical behaviour and promote employees to live by the claims made. Further, reputational risk is measured through the detailed scorecard-based model developed by the Bank to measure and monitor reputational risk under ICAAP. Timely actions are initiated to mitigate potential reputational risks by critically evaluating the criteria given in the said scorecard.
Capital Adequacy and ICAAP Framework
In line with the Basel requirements and as prescribed in the ICAAP framework, the Bank used internal models to assess and quantify the risk profile, to stress test risk drivers and to assess capital requirements to support them. Internal limits which are more stringent than the regulatory requirement provide early warnings with regard to capital adequacy.
ICAAP supports the regulatory review process providing valuable inputs for evaluating the required capital in line with future business plans. It integrates strategic plans and risk management plans with the capital plan in a meaningful manner with inputs from Senior Management, Management Committees, Board Committees and the Board. It also supports profit optimisation through proactive decisions on exposures both current and potential through measurement of vulnerabilities by carrying out stress testing and scenario-based analysis. The ICAAP process also identifies gaps in managing qualitative and quantitative aspects of reputational risk and strategic risk which are not covered under Pillar 1 of Basel II.
The Bank is compliant with both regulatory and its own prudential requirements of capital adequacy. With a loyal base of shareholders and profitable operations, the Bank is also well positioned to meet capital requirements in the longer term to cover its material risks and to support business expansion, as a domestic systemically important bank. (D-SIB)
Target and actual capital
Table – 24
| Capital ratios | Regulatory minimum % | HLA % | Total % | Goal (Internal requirement) | 2019 (%) | 2018 (%) | |
| CET 1 | 7.0 | 1.5 | 8.5 | >11 | 12.298 | 11.338 | |
| Total | 12.5 | 1.5 | 14.0 | >15 | 16.146 | 15.603 |
(Refer Annex 3 for the detailed capital adequacy computation)
Basel III minimum capital requirements and buffers
The Banking Act Direction No. 01 of 2016 introduced capital requirements under Basel III for licensed commercial banks commencing from July 1, 2017 with specified timelines to gradually increase minimum capital ratios to be fully implemented by January 1, 2019.
A comparison of the position as at December 31, 2019 and the minimum capital requirement prescribed by the CBSL effective from January 1, 2019 as given below demonstrates the capital strength of the Bank and bears testimony to the ability to meet stringent requirements imposed by the regulator.
Please refer the Basel computation given in the section on Annex 3 for the Bank’s position as at December 31, 2019 against the minimum requirements stipulated by the CBSL.
The Bank periodically evaluates the capital requirements of the next 05 years through the ICAAP, develops capital augmentation plans based thereon and submits same for the CBSL review. Accordingly, despite the significant impact on the internal capital generation capabilities of the Bank in 2018 and 2019 from SLFRS 9 adoption and the Debt Repayment Levy, the Bank has been able to secure availability of capital to fund its expansion plans and meet Higher Loss Absorbency (HLA) requirements recently prescribed by the CBSL for D-SIBs.
“Basel Workgroup” of the Bank consists of representatives from a cross section of business and support units to ascertain levels of capital adequacy in line with strategic direction of the Bank. While ICAAP acts as a foundation for such assessment, the Basel Workgroup is constantly on the lookout for improvements amidst changing landscape in different frontiers, to recommend to the ALCO on the desired way forward including indications on current and future capital needs, anticipated capital expenditure-based assessments and desirable capital levels, etc.
The Bank is aware of the importance of capital as a scarce and valuable resource. The Bank has access to contributions from shareholders as well as built up capital over a period of time by adopting prudent dividend policies, ploughing back a portion of the profits, etc. In addition, the Bank is continuously finding ways to improve judicious allocation of capital to requirements associated with the day-to-day activities so that an optimised level of capital allocation can be achieved. The challenges associated with mobilising capital from external sources are also given due cognisance, but not excluded as a sustainable option to boost the capital in the long run. The Bank is reasonably comfortable with the current availability of capital buffer to withstand an ambitious growth/ stressed market conditions, but not complacent with current comfort levels and believe in providing stakeholder confidence that the Bank is known for, through sound capital buffer levels.
Stress testing
As an integral part of ICAAP under Pillar II, the Bank conducted stress testing for severe but plausible shocks on its major risk exposures on a periodic basis to evaluate the sensitivity of the current and forward risk profile relative to risk appetite and their impact on resilience of capital, funding, liquidity and earnings.
It also supports a number of business processes, including strategic planning, the ICAAP including capital management, liquidity management, setting of risk appetite triggers and risk tolerance limits, mitigating risks through actions such as reviewing and changing limits, limiting or reducing exposures and hedging thereof, facilitating the development of risk mitigation or contingency plans across a range of stressed conditions supporting communication with internal and external stakeholders.
The Bank’s stress testing governance framework sets out the responsibilities and approaches to stress testing activities which are conducted at Bank, business line and risk type level. The Bank’s stress testing programme uses one or a combination of stress testing techniques, including scenario analysis, sensitivity analysis and reverse stress testing to perform stress testing for different purposes.
The framework covers all the material risks such as credit risk, credit concentration risk, operational risk, liquidity risk, FX risk, IRRBB using EVE and EAR perspectives. The Bank looks at different degrees of stress levels which are defined as Minor, Moderate and Severe in the Stress Testing Policy. The resultant impact on the capital through these stress tests is carefully analysed. If the stress tests bring about a deterioration of the capital which has no impact on the policy level on capital maintenance, same is defined as Minor risk, while a deterioration of up to 1% is considered as Moderate risk. If the impact results in the capital falling below the statutory requirement such a level will be considered as Severe risk, warranting immediate attention of the Management to rectify the situation.
As it provides a broader view of all risks borne by the Bank in relation to its risk tolerance and strategy in a hypothetical stress situation, stress testing has become an effective communication tool to senior management, risk owners and risk managers as well as supervisors and regulators. The results of the stress testing are reported to the EIRMC and BIRMC on a quarterly basis for appropriate, proactive decision making. Extracts from the stress testing results are set out in Table 25.
Impact on CAR at Minor, Moderate and Severe stress levels:
Table – 25
| Particulars | Description | 2019 | 2018 | ||||||
| Minor % | Moderate % | Severe % | Minor % | Moderate % | Severe % | ||||
| Credit risk – asset quality downgrade | Increasing the direct non-performing facilities over the direct performing facilities for the entire portfolio | -0.15 | -0.38 | -0.74 | -0.14 | -0.36 | -0.68 | ||
| Operational risk | Impact of; 1. Top five operational losses during last five years 2. Average of yearly operational risk losses during last three years whichever is higher | -0.05 | -0.13 | -0.25 | -0.06 | -0.14 | -0.27 | ||
| Foreign exchange risk | Percentage shock in the exchange rates for the Bank and Maldives operations (gross positions in each Book without netting) | -0.06 | -0.13 | -0.29 | -0.05 | -0.09 | -0.14 | ||
|
Liquidity risk (LKR) – Sri Lanka |
1. Withdrawal of percentage of the clients, banks and other banking institution deposits from the Bank within a period of three months | -0.03 | -0.11 | -0.26 | -0.02 | -0.10 | -0.28 | ||
| 2. Rollover of loans to a period greater than three months | |||||||||
|
Interest rate risk – EAR and EVE (LKR) – Sri Lanka |
To assess the long-term impact of changes in interest rates on Bank’s EVE through changes in the economic value of its assets and liabilities and to assess the immediate impact of changes in interest rates on Bank’s earnings through changes in its net interest income | -0.15 | -0.30 | -0.44 | -0.30 | -0.58 | -0.86 | ||
Monitoring and reporting
It is the responsibility of the risk management function of the Bank to identify, measure, monitor and report risk. In order to enhance the effectiveness of its role, staff attached to it is given regular training, enabling them to develop and refine their skills. They are well aided by IT systems which enabled extraction of data, analysis and modelling. Regular and ad-hoc reports are generated on Key Risk Indicators and risk matrices of the Bank as well as the subsidiaries, for review by the senior management, Executive and Board Committees, and the Board which rely on such reports for evaluating risk and provides strategic direction. The reports provide information on aggregate measures of risks across products, portfolios, tenures and geographies compared against agreed policy parameters, providing a clear representation of the risk profile and sensitivities of the risks assumed by the Bank and the Group.
Basel III – Market Discipline
Please refer Annex 3 for the minimum disclosure requirements under Pillar III as per the Banking Act Direction No. 01 of 2016.
Please refer Annex 3 for the D-SIB Assessment Exercise disclosed as required by the Banking Act Direction No. 10 of 2019.