
Sustainability
Our Environment and Our Process
Economic Outlook
Global Economy
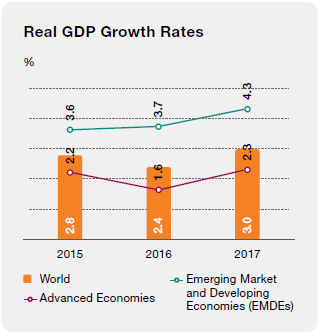
In 2017, the global economy recovered somewhat from its subdued performance in 2016. Growth is now estimated to have reached 3.0%, which is slightly higher than previous projections, It is heartening than countries accounting for more than three quarters of global GDP have seen an increased growth in 2017 compared with the previous year. There are positive signs of productivity recovering from the post-2008 crisis. The growth was mainly driven by Germany, Japan, South Korea, and the United States. Brazil, China, and South Africa also performed better than previously expected. In the last few months of the year, there was also a resurgence in global trade. Contributing factors were increasing investment in advanced economies and pick-up in manufacturing output in some Asian countries. Spare capacity is diminishing and is already practically zero in the US and several advanced economies. The unemployment rate too has returned to near pre-crisis levels in most advanced economies. Nevertheless core inflation remains low, which is a hangover of previous low commodity prices.
The US economy is expected to have recorded a moderate growth of around 2.3% in 2017. Though there are some uncertainties, reduction in corporate and personal taxes are expected to give a boost to the economy. Growth for the Euro region is estimated to be 2.4%. Germany, Italy and the Netherlands are expected to perform well, buoyed by stronger domestic as well as external demand. The UK economy, hampered by the uncertainty surrounding Brexit, is expected to grow only by 1.7% in 2017 and this is expected to reduce further to 1.5% in 2018. The Chinese economy however is expected to do reasonably well, growing at around 6.8%. Growth has been boosted by increase domestic demand and pick-up in global trade. India is also expected to achieve a growth of around 6.7% despite slackening due to the currency change initiative and the introduction of Goods and Services Tax (GST). The introduction of GST however augurs well for the long term.
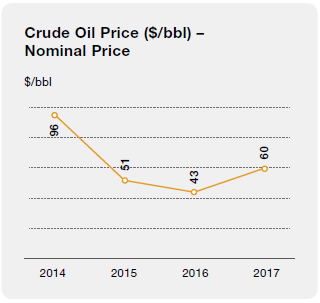
Oil producing nations, which were severely affected by low oil prices in the last two years, received some relief by way of a recovery in prices towards the end of 2017; nevertheless they continued to suffer significant revenue shortfalls. While oil prices exceeded USD 60 a barrel in December 2017, the peak for the last two years, they remained significantly below the highest price within the last 10 years which was USD 141 per barrel in 2008. Going forward, economic diversification remains a priority for countries severely dependent on oil exports. Growth in the Middle East and North Africa is expected to reach 1.8%. On the other hand, relatively low oil prices continued to be a boon for the current accounts of oil importing nations. Performance of other commodities was uneven, with food and precious metal prices remaining more or less static while metals and minerals prices increased in the range 10%-50%. Low income countries face many challenges including diversifying their economies, progressing towards the sustainable development goals and the subdued outlook for some commodity prices. Many countries in the Middle East and Africa were also affected by political instability, civil war and terrorism. South Asian countries suffered from natural disasters, fiscal slippages and weak tax revenues. Some countries such as Afghanistan are faced with uncertain security situations.
Overall there has been an increased global growth momentum and growth of 3.1% is expected for 2018 and 2019. Risks to growth appear to be moderate in the short term but are tilted to the downside in the medium term.
Sri Lankan Economy
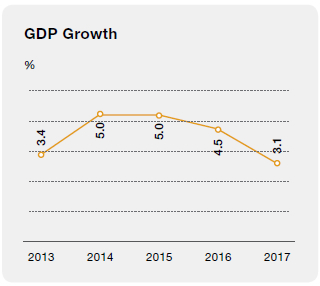
The Sri Lankan economy was faced with serious headwinds this year particularly by way of adverse weather conditions, including droughts and floods, which have resulted in downward revisions of original forecasts for the year. Growth in GDP is estimated at 3.1% for the year. While the agricultural sector was affected by weather conditions; industry and services however did relatively well. In particular, the performance of financial services, telecommunications and trade stood out.
During the year, new strategies were implemented to attract investments by leveraging the country’s competitive advantages and also using existing investors to bring in additional investment both directly and by taking advantage of their external networks. Foreign exchange regulations too have been liberalised through the new Exchange Act to improve the investment climate.
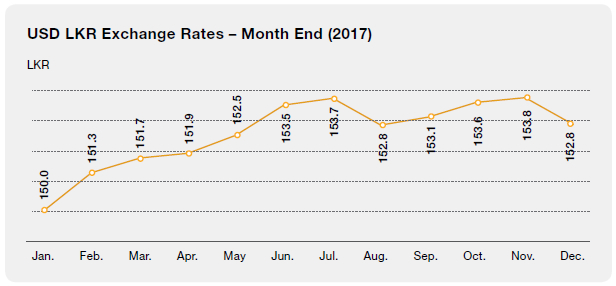
The Sri Lankan Rupee depreciated by 2% in 2017 YoY against the US Dollar. Outflows increased initially due to rising imports, debt service payments and foreigners divesting their investments in Government Securities. However, later the pressure on the currency was reduced due to net inflows to the Colombo Stock Exchange and revived investments in the Government Securities market. The currency depreciation was further eased by the receipt of the fourth tranche of the International Monetary Fund (IMF) Extended Fund Facility in December 2017, and the issuance of the International Sovereign Bond. The country’s credit ratings were favourably revised during the year. Fitch Ratings revised its rating from B+ negative to stable in February 2017 while the S&P rating was also upgraded from B+ negative to stable in November 2017.
Our export revenue notched USD 11.4 billion in 2017, an increase of 10% over the figure for 2016. Restoration of GSP+ by the European Union and the depreciation of the Rupee were contributing factors. Increases in exports were however offset by additional imports (which increased by 9%) caused by unfavourable weather as well as by a drop in remittances from expatriate workers; the impact of both resulted in a more adverse balance of payments situation. Worker remittances were unfavourably affected by economic conditions and geo-political tensions in the Middle East.
Despite tight monetary policy and slowing credit, inflation reached 7.3% YoY in 2017. Contributory factors were adverse weather conditions which drove-up food prices, rising international commodity prices, depreciation of the Rupee and upward revisions of indirect taxes. However, the transition to a Flexible Inflation Targeting (FIT) framework will facilitate better control of inflation in the future. Under the FIT framework, the Central Bank will be targeting an inflation rate of 4-6%. The gross official reserves of the country increased from USD 6.0 billion at end 2016 to USD 7.9 billion at end 2017.
The Banking Sector
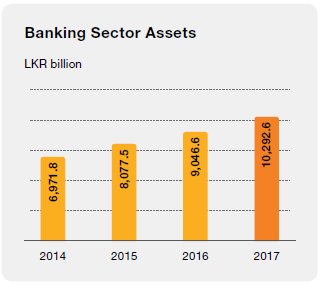
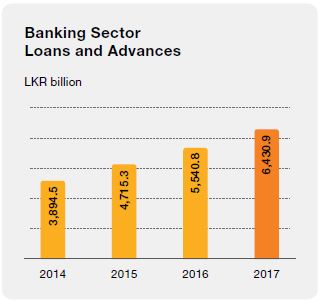
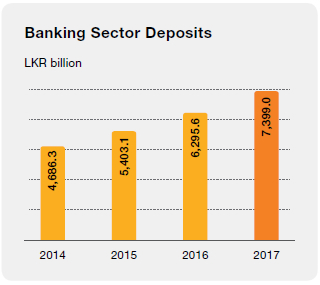
Although economic growth in general was lacklustre in 2017, the financial sector showed a robust performance accounting for 9% of the estimated GDP in 2017. The profits before tax of the banking sector reached LKR 194.7 billion in 2017 recording an impressive increase of 18% YoY over 2016. Net interest income increased by 12% over 2016, and notched LKR 341.6 billion. Total net assets, which were LKR 10.3 trillion as at end 2017 increased by 14% over a year before. In other respects too, the sector showed resilience with improvements in asset quality, capital and liquidity levels which were maintained well above statutory minimum levels. The prime source of funding was deposits which grew by 18% to LKR 7.4 trillion in 2017.Loans and advances grew by 16% during the year and reached LKR 6.4 trillion. The increase was across all economic sectors despite higher interest rates.
Several measures taken by the Central Bank of Sri Lanka (CBSL) during the year helped to drive the growth of the financial sector. They include the new Foreign Exchange Act which liberalised foreign exchange transactions and the strengthening of the framework to regulate non-Banking financial institutions. During the year, the industry had to take proactive measures for the enforcement of the new Basel III regulations which will tighten capital and liquidity requirements. The industry preparing for the implementation of Accounting Standard SLFRS 9 will bring major implications for impairment provisions.
The CBSL kept a tight rein on monetary policy by keeping interest rates high. The Standard Deposit Facility Rate (SDFR) and the Standard Lending Facility Rate (SLFR) were increased by 25 bps to 7.25% and 8.75% respectively from March 2017.
Under a Financial Sector Modernisation project, financed by the International Development Organisation further reforms will be implemented in the financial sector. Under this project, which will be spread over a period of 5 years, regulatory frameworks and financial infrastructure will be modernised. This will lead to increased accessibility to affordable finance for the SME sector and small entrepreneurs.
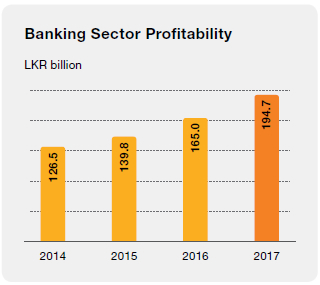
Although economic growth in general was lacklustre in 2017, the financial sector showed a robust performance accounting for 9% of the estimated GDP in 2017. The profits before tax of the banking sector reached LKR 194.7 billion in 2017 recording an impressive increase of 18% YoY over 2016.
Value Added Statement
An analysis of the Bank’s value creation and allocation of value among key stakeholder groups is depicted below:
|
2017 LKR million |
2016 LKR million |
Change % |
|
| Value Added | |||
| Income earned by providing banking services | 185,427 | 147,554 | 26 |
| Cost of services | (102,502) | (71,030) | 44 |
| Value added by banking services | 82,925 | 76,524 | 8 |
| Non-banking income | 3,784 | 6,568 | (42) |
| Impairment charges for loans and other losses | (9,341) | (4,397) | 112 |
| Value addition | 77,368 | 78,695 | (2) |
| Value Allocation | |||
| To Employees | |||
| Salaries, wages and other benefits | 16,996 | 16,844 | 1 |
| To Government | |||
| Dividends paid to Government of Sri Lanka | 12,346 | 17,346 | (29) |
| Income tax | 8,929 | 6,452 | 38 |
| VAT and NBT on financial services | 7,249 | 6,265 | 16 |
| 28,524 | 30,063 | (5) | |
| To Community | |||
| Social responsibility projects | 128 | 135 | (5) |
| To Providers of External Funds | |||
| Interest on other borrowings | 15,714 | 18,239 | (14) |
| Interest on debt issued | 5,014 | 4,571 | 10 |
| 20,728 | 22,810 | (9) | |
| To Expansion and Growth | |||
| Retained profit | 8,966 | 7,445 | 20 |
| Depreciation and amortisation | 1,925 | 1,453 | 32 |
| Deferred taxation | 101 | (55) | (286) |
| 10,992 | 8,843 | 24 | |
| 77,368 | 78,695 | (2) |

Economic Value Added
Economic Value Added (EVA) indicates the true economic profit of an organisation. EVA is an estimate of the amount by which earnings exceed or fall short of required minimum return for shareholders at comparable risks.
|
2017 LKR million |
2016 LKR million |
Change % |
|
| Invested Capital | |||
| Average Shareholders’ funds | 102,002 | 87,167 | 17 |
| Add: Cumulative provision for loan losses and provision for impairment and other losses | 57,179 | 47,832 | 20 |
| 159,181 | 134,999 | 18 | |
| Return on Invested Capital | |||
| Profit after taxation | 21,312 | 24,791 | (14) |
| Add: Provision for loan losses and other losses | 9,341 | 4,397 | 112 |
| Less: Loans written off | (1,181) | (31) | 3,709 |
| Total return on invested capital | 29,472 | 29,157 | 1 |
| Opportunity cost of invested capital* | (16,003) | (13,396) | 19 |
| Economic Value Added | 13,469 | 15,761 | (15) |
* Calculated based on weighted average 12 months Treasury Bill rate 2017 – 10.05% (2016 – 9.92%).