
Compliance Annexes
Capital Adequacy
What Means from Capital Adequacy and Why is it Important?
Strong capital position is a main component that every institute should consider for their long-term stabilisation. Therefore regulators endeavour to ensure that financial institutions, banks and investment firms have maintained enough capital to ensure smooth running of their business and have strength to meet unexpected economic fluctuations. This measure not only protects depositors within the industry but also the larger economy, as failures of institutions, specially banks, can have wider-scale repercussions.
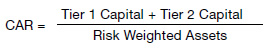
“Capital Adequacy” is therefore the statutory minimum capital reserve that a financial institution or investment firm must have available under the regulatory provisions and it is compelled to relevant firms to maintain certain level of capital, at any given time against their risk weighted assets. This requirement is measured by, as a percentage of the risk weighted assets and it is called capital adequacy ratio.
Transformation from Basel I to Basel III
The liquidation of a Europe-based bank in 1974 prompted the group of ten (G-10) nations to set up the Basel Committee on Banking Supervision (BCBS), under the direction and supervision of the Bank of International Settlements, which is in Basel, Switzerland. After the experience of drowning of Europe-based bank and as a result of the liquidation of the same, this Committee instigated the Basel I Accord in 1988 with a view to resilience of financial institutions.
The Basel I Accord was the outcome of a round of consultations and deliberations by central bankers from around the world, which resulted in the publishing by the BCBS of a set of minimum capital requirements for banks. This is also known as the 1988 Basel Accord, and was enforced by law in the G-10 countries in 1992. Basel I was primarily focused on Credit Risk and Risk Weighted Assets (RWA).
The Basel II Accord was introduced following substantial losses in the international markets since 1992, which were attributed to poor risk management practices. From 2004, the Basel II Accord makes it mandatory for financial institutions to use standardised measurements for credit risk, market risk, and operational risk.
Basel III
Basel III is an extension of the Basel II Framework, and introduces new capital and liquidity standards to strengthen the regulation, supervision, and risk management of the whole of the banking and finance sectors.
The Basel III requirements were in response to the deficiencies in financial regulation that is revealed by the 2000’s financial crisis. Basel III was intended to strengthen bank capital requirements by increasing bank liquidity and decreasing bank leverage.
The global capital framework and new capital buffers require financial institutions to hold more capital and higher quality of capital than under Basel II rules. The new leverage ratio introduces a non-risk-based measure to supplement the risk-based minimum capital requirements. The new liquidity ratios ensure that adequate funding is maintained in case there are other severe banking crises.
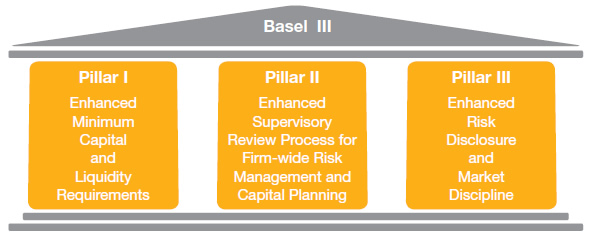
The three pillars as established by Basel II have been revised and strengthened, while the framework itself was extended with astute
innovative features:
Main Features of the Basel III
- An additional layer of common equity – the capital conservation buffer – that, when breached, restricts payouts of earnings to help protect the minimum common equity requirement. a countercyclical capital buffer, which places restrictions on participation by banks in system-wide credit booms with the aim of reducing their losses in credit bursts. Additional proposals for Domestic Systemically Important Banks (D-SIBs), including requirements for supplementary capital, augmented contingent capital and strengthened arrangements for cross-border supervision and resolution. According to the Central Bank of Sri Lanka, banks with a total asset base of over LKR 500 billion, in the latest annual audited Financial Statements will be identified as D-SIBS in the Banking sector. a leverage ratio – a minimum amount of loss-absorbing capital, relative to all of a bank’s assets and off-balance sheet exposures regardless of risk weighting. Leverage ratio will be implemented in Sri Lanka from 1 July 2018 with observation period already commenced from 1st quarter 2017, which will be monitored by the Central Bank of Sri Lanka. Liquidity requirements – a minimum liquidity ratio, the Liquidity Coverage Ratio (LCR), intended to provide enough cash to cover funding needs over a 30-day period of stress; and a longer-term ratio, the Net Stable Funding Ratio (NSFR), intended to address maturity mismatches over the entire balance sheet.
The implementation of the Basel III minimum capital requirements across the banking sector in Sri Lanka, under the Direction No. 01 of 2016 is now effective from 1 July 2017 in transitional phase.
Basel III – Transitional Phase-in-Arrangement of Capital Requirements for Banks with Assets
of LKR 500 billion and above
| Components of Capital |
01.07.2017
% |
01.01.2018
% |
01.01.2019
% |
| Common Equity Tier 1 | 4.50 | 4.50 | 4.50 |
| Capital Conservation Buffer | 1.25 | 1.875 | 2.50 |
| Surcharge on Domestic Systematically Important Banks (D-SIBs) | 0.50 | 1.00 | 1.50 |
| Additional Tier 1 Capital | 1.50 | 1.50 | 1.50 |
| Total Tier 1 Capital | 7.75 | 8.875 | 10.00 |
|
Minimum Total Capital Ratio + Capital Conservation Buffer + Capital Surcharge on D-SIBs |
11.75 | 12.875 | 14.00 |
Bank of Ceylon begun its preparation towards Basel III from 2015 when CBSL issued first consultancy paper for Basel III implementation in April 2015. By enhancing capital base and applying risk mitigating techniques, Bank was able to maintain the ratio well above the regulatory requirements as of 31 December 2017. Despite the challenging economic and market environment, BoC is well-positioned to meet the Basel III requirements when regulations become fully effective in 1 January 2019.
Basel III Disclosure Requirements
Key Regulatory Ratios – Capital and Liquidity
| Item | 2017 | |
| Bank | Group | |
| Basel III | ||
| Regulatory Capital (LKR ’000) | ||
| Common equity Tier 1 | 92,596,974 | 99,289,566 |
| Tier 1 capital | 92,596,974 | 99,289,566 |
| Total capital | 125,460,069 | 132,382,713 |
| Regulatory Capital Ratios (%) | ||
| Common equity Tier 1 capital ratio (minimum requirement – 6.25%) | 10.77 | 10.87 |
| Tier 1 capital ratio (minimum requirement – 7.75%) | 10.77 | 10.87 |
| Total capital ratio (minimum requirement – 11.75%) | 14.59 | 14.49 |
| Item | Bank | |
| 2017 | 2016 | |
| Regulatory Liquidity | ||
| Statutory liquid assets (LKR ’000) | 477,892,172 | 307,549,721 |
| Statutory Liquid Assets Ratio (%) | ||
| Domestic Banking Unit (Minimum Requirement – 20%) | 27.22 | 21.62 |
| Offshore Banking Unit (Minimum Requirement – 20%) | 21.91 | 28.08 |
| Liquidity coverage ratio – Rupee (minimum requirement 2017 – 80%, 2016 – 70%) | 141.46 | 174.10 |
| Liquidity coverage ratio – All Currencies (minimum requirement 2017 – 80%, 2016 – 70%) | 105.04 | 101.99 |
Basel III new guidelines were implemented with effect from 1 July 2017.
Basel III Computation of Capital Ratios – 2017
| Item |
Bank
LKR ’000 |
Group
LKR ’000 |
| Common Equity Tier 1 (CET 1) capital after adjustments | 92,596,974 | 99,289,566 |
| Common Equity Tier 1 (CET 1) capital | 97,701,176 | 100,813,614 |
| Equity capital (stated capital)/assigned capital | 20,000,000 | 20,000,000 |
| Reserve fund | 10,427,000 | 10,427,000 |
| Published retained earnings/(accumulated retained losses) | 63,472,250 | 65,100,871 |
| Published accumulated Other Comprehensive Income (OCI) | 2,231,116 | 2,856,370 |
| General and other disclosed reserves | 1,570,810 | 2,429,373 |
| Unpublished current year’s profit/(losses) and gains reflected in OCI | – | – |
| Ordinary shares issued by consolidated banking and financial subsidiaries held by third parties | – | – |
| Total Adjustments to CET 1 Capital | 5,104,202 | 1,524,048 |
| Goodwill (net) | – | – |
| Intangible assets (net) | 810,730 | 1,074,435 |
| Deferred tax assets (net) | – | 8,621 |
|
Investments in the capital of banking and financial institutions where the Bank does not own more than 10% of the issued ordinary share capital of the entity |
449,444 | 440,991 |
|
Significant investments in the capital of financial institutions where the Bank owns more than 10% of the issued ordinary share capital of the entity |
3,844,028 | – |
| Additional Tier 1 (AT I) capital after adjustment | – | – |
| Additional Tier 1 (AT I) capital | – | – |
| Qualifying additional Tier 1 capital instruments | – | – |
|
Instruments issued by consolidated banking and financial subsidiaries of the Bank and held by third parties |
– | – |
| Total adjustments to AT 1 capital | – | – |
| Investment in own shares | – | – |
| Others (specify) | – | – |
| Tier 2 capital after adjustments | 32,863,095 | 33,093,147 |
| Tier 2 capital | 34,275,944 | 34,275,944 |
| Qualifying Tier 2 capital instruments | 26,348,597 | 26,348,597 |
| Revaluation gains | 2,373,396 | 2,373,396 |
| General provisions | 5,553,951 | 5,553,951 |
| Instruments issued by Consolidated Banking and Financial Subsidiaries of the Bank and held by third parties | ||
| Total Adjustment to Tier 2 | 1,412,849 | 1,182,797 |
| Investment in own shares | – | – |
|
Investments in the capital of financial institutions and where the Bank does not own more than 10% of the issued capital carrying voting rights of the issuing entity |
1,205,469 | 1,182,797 |
|
Significant investments in the capital of banking and financial institutions where the Bank own more than 10% of the issued ordinary share capital of the entity |
207,380 | – |
| CET I capital | 92,596,974 | 99,289,566 |
| Total Tier 1 capital | 92,596,974 | 99,289,566 |
| Total capital | 125,460,069 | 132,382,713 |
| Item | Bank | Group |
| Total risk-weighted assets (RWA) (LKR ’000) | 859,663,681 | 913,616,033 |
| RWAs for credit risk | 764,409,191 | 808,714,937 |
| RWAs for market risk | 7,848,707 | 7,848,707 |
| RWAs for operational risk | 87,405,782 | 97,052,389 |
|
CET I capital ratio (including capital conservation buffer, countercyclical capital buffer and surcharge on D-SIBs) (%) |
10.77 | 10.87 |
| of which: Capital conservation buffer | 1.25 | 1.25 |
| of which: Countercyclical buffer | N/A | N/A |
| of which: Capital surcharge on D-SIBs | 0.50 | 0.50 |
| Total Tier 1 capital ratio (%) | 10.77 | 10.87 |
|
Total capital ratio (including capital conservation buffer, countercyclical capital buffer and surcharge on D-SIBs) (%) |
14.59 | 14.49 |
| of which: Capital conservation buffer | 1.25 | 1.25 |
| of which: Countercyclical buffer | N/A | N/A |
| of which: Capital surcharge on D-SIBs | 0.50 | 0.50 |
Basel III Computation of Liquidity Coverage Ratio – All Currency (Bank Only)
| Amount (LKR ’000) | ||||
| 2017 | 2016 | |||
| Item |
Total Unweighted
Value |
Total Weighted
Value |
Total Unweighted
Value |
Total Weighted
Value |
| Total stock of High-Quality Liquid Asset (HQLA) | 299,081,569 | 297,359,897 | 254,050,364 | 252,153,939 |
| Total adjusted Level 1 assets | 295,987,317 | 295,987,317 | 252,869,329 | 252,869,329 |
| Level 1 assets | 295,568,225 | 295,568,225 | 250,187,864 | 250,187,864 |
| Total adjusted Level 2A assets | 100,000 | 85,000 | 100,000 | 85,000 |
| Level 2 assets | 100,000 | 85,000 | 100,000 | 85,000 |
| Total adjusted Level 2B assets | 3,413,344 | 1,706,672 | 3,762,500 | 1,881,075 |
| Level 2B assets | 3,413,344 | 1,706,672 | 3,762,150 | 1,881,075 |
| Total cash outflows | 1,896,131,889 | 319,951,612 | 1,648,451,224 | 291,365,309 |
| Deposits | 1,090,725,752 | 109,072,575 | 928,546,190 | 92,854,619 |
| Unsecured wholesale funding | 428,492,592 | 185,171,536 | 346,481,276 | 172,670,361 |
| Secured funding transactions | 23,782,957 | – | 26,363,519 | – |
|
Undrawn portion of committed (irrevocable) facilities and other contingent funding obligations |
353,086,993 | 25,663,907 | 347,008,062 | 25,788,152 |
| Additional requirements | 43,595 | 43,595 | 52,177 | 52,177 |
| Total cash inflows | 78,429,645 | 36,858,631 | 69,394,824 | 44,137,437 |
| Maturing secured lending transaction backed by collateral | 18,388,000 | – | 1,900,600 | – |
| Committed facilities | – | – | – | – |
| Other inflows by counterparty which are maturing within 30 days | 46,347,809 | 36,858,631 | 51,628,626 | 44,137,437 |
| Operational deposits | 13,693,836 | – | 15,865,598 | – |
| Other cash inflows | – | – | – | – |
|
Liquidity coverage ratio percentage (stock of high quality liquid assets/ total net cash outflows over the next 30 calendar days)* 100 (%) |
105.04 | 101.99 | ||
Main Features of Regulatory Capital Instruments
Description of the Capital Instrument
| Issuer | Bank of Ceylon | Bank of Ceylon | Bank of Ceylon | Bank of Ceylon | Bank of Ceylon |
| Unique identifier | LK0357D20405 | LK0357D20421 | LK0357D20447 | LK0357D20462 | LK0357D20439 |
| Governing laws of the instrument | Laws of Sri Lanka | Laws of Sri Lanka | Laws of Sri Lanka | Laws of Sri Lanka | Laws of Sri Lanka |
| Original date of issuance | 25 October 2013 | 25 October 2013 | 25 October 2013 | 25 October 2013 | 25 October 2013 |
| Par value of instrument (LKR) | 100 | 100 | 100 | 100 | 100 |
| Issued quantity (Number of debentures) | 37,843,000 | 2,155,000 | 2,000 | 11,990,000 | 10,000 |
| Issued quantity (LKR ’000) | 3,784,300 | 215,500 | 200 | 1,199,000 | 1,000 |
| Perpetual or dated | |||||
| Original maturity date, if applicable | 24 October 2018 | 24 October 2018 | 24 October 2018 | 24 October 2021 | 24 October 2021 |
|
Amount recognised in regulatory capital (in LKR ’000 as at the reporting date) |
756,860 | 43,100 | 40 | 959,200 | 800 |
| Accounting classification (equity/liability) | Liability | Liability | Liability | Liability | Liability |
| Coupons/Dividends | |||||
| Fixed or floating dividend/coupon | FIXED | FIXED | FLOATING | FIXED | FLOATING |
| Coupon rate and any related index (%) | 13.00 | 12.60 | 11.13 | 13.25 | 11.13 |
| Non-cumulative or cumulative | Non-cumulative | Non-cumulative | Non-cumulative | Non-cumulative | Non-cumulative |
| Convertible or non-convertible | Non-convertible | Non-convertible | Non-convertible | Non-convertible | Non-convertible |
Description of the Capital Instrument
| Issuer | Bank of Ceylon | Bank of Ceylon | Bank of Ceylon | Bank of Ceylon | Bank of Ceylon |
| Unique identifier | LK0357D20454 | LK0357D20470 | LK0357D22500 | LK0357D22534 | LK0357D22526 |
| Governing laws of the instrument | Laws of Sri Lanka | Laws of Sri Lanka | Laws of Sri Lanka | Laws of Sri Lanka | Laws of Sri Lanka |
| Original date of issuance | 25 October 2013 | 25 October 2013 | 22 September 2014 | 22 September 2014 | 22 September 2014 |
| Par value of instrument (LKR) | 100 | 100 | 100 | 100 | 100 |
| Issued quantity (Number of debentures) | 12,000,000 | 16,000,000 | 51,256,350 | 2,157,800 | 8,250,600 |
| Issued quantity (LKR ’000) | 1,200,000 | 1,600,000 | 5,125,635 | 215,780 | 825,060 |
| Perpetual or dated | |||||
| Original maturity date, if applicable | 24 October 2022 | 24 October 2023 | 21 September 2019 | 21 September 2019 | 21 September 2019 |
|
Amount recognised in regulatory capital (in LKR ’000 as at the reporting date) |
1,200,000 | 1,600,000 | 2,050,254 | 86,312 | 330,024 |
| Accounting classification (equity/liability) | Liability | Liability | Liability | Liability | Liability |
| Coupons/Dividends | |||||
| Fixed or floating dividend/coupon | FIXED | FIXED | FIXED | FIXED | FLOATING |
| Coupon rate and any related index (%) | 13.25 | 13.75 | 8.00 | 7.75 | 10.43 |
| Non-cumulative or cumulative | Non-cumulative | Non-cumulative | Non-cumulative | Non-cumulative | Non-cumulative |
| Convertible or non-convertible | Non-convertible | Non-convertible | Non-convertible | Non-convertible | Non-convertible |
Description of the Capital Instrument
| Issuer | Bank of Ceylon | Bank of Ceylon | Bank of Ceylon | Bank of Ceylon | Bank of Ceylon |
| Unique identifier | LK0357D22542 | LK0357D22559 | LK0357D23201 | LK0357D23185 | LK0357D23193 |
| Governing laws of the instrument | Laws of Sri Lanka | Laws of Sri Lanka | Laws of Sri Lanka | Laws of Sri Lanka | Laws of Sri Lanka |
| Original date of issuance | 22 September 2014 | 22 September 2014 | 6 October 2015 | 6 October 2015 | 6 October 2015 |
| Par value of instrument (LKR) | 100 | 100 | 100 | 100 | 100 |
| Issued quantity (Number of debentures) | 18,334,950 | 300 | 2,885,900 | 122,200 | 44,783,860 |
| Issued quantity (LKR ’000) | 1,833,495 | 30 | 288,590 | 12,220 | 4,478,386 |
| Perpetual or dated | |||||
| Original maturity date, if applicable | 21 September 2022 | 22 September 2022 | 5 October 2020 | 5 October 2020 | 5 October 2020 |
|
Amount recognised in regulatory capital (in LKR ’000 as at the reporting date) |
1,833,495 | 30 | 173,154 | 7,332 | 2,687,032 |
| Accounting classification (equity/liability) | Liability | Liability | Liability | Liability | Liability |
| Coupons/Dividends | |||||
| Fixed or floating dividend/coupon | FIXED | FLOATING | FIXED | FIXED | FLOATING |
| Coupon rate and any related index (%) | 8.25 | 10.43 | 8.25 | 8.00 | 11.34 |
| Non-cumulative or cumulative | Non-cumulative | Non-cumulative | Non-cumulative | Non-cumulative | Non-cumulative |
| Convertible or non-convertible | Non-convertible | Non-convertible | Non-convertible | Non-convertible | Non-convertible |
Description of the Capital Instrument
| Issuer | Bank of Ceylon | Bank of Ceylon | Bank of Ceylon | Bank of Ceylon | Bank of Ceylon |
| Unique identifier | LK0357D23177 | LK0357D23219 | LK0357D23763 | LK0357D23797 | LK0357D23771 |
| Governing laws of the instrument | Laws of Sri Lanka | Laws of Sri Lanka | Laws of Sri Lanka | Laws of Sri Lanka | Laws of Sri Lanka |
| Original date of issuance | 6 October 2015 | 6 October 2015 | 29 December 2016 | 29 December 2016 | 29 December 2016 |
| Par value of instrument (LKR) | 100 | 100 | 100 | 100 | 100 |
| Issued quantity (Number of debentures) | 11,802,560 | 20,405,480 | 79,981,764 | 10,200 | 7,836 |
| Issued quantity (LKR ’000) | 1,180,256 | 2,040,548 | 7,998,176 | 1,020 | 784 |
| Perpetual or dated | |||||
| Original maturity date, if applicable | 5 October 2023 | 5 October 2023 | 28 December 2021 | 28 December 2021 | 28 December 2024 |
|
Amount recognised in regulatory capital (in LKR ’000 as at the reporting date) |
1,180,256 | 2,040,548 | 6,398,541 | 816 | 784 |
| Accounting classification (equity/liability) | Liability | Liability | Liability | Liability | Liability |
| Coupons/Dividends | |||||
| Fixed or floating dividend/coupon | FIXED | FLOATING | FIXED | FLOATING | FIXED |
| Coupon rate and any related index (%) | 9.50 | 11.34 | 13.25 | 10.47 | 12.75 |
| Non-cumulative or cumulative | Non-cumulative | Non-cumulative | Non-cumulative | Non-cumulative | Non-cumulative |
| Convertible or non-convertible | Non-convertible | Non-convertible | Non-convertible | Non-convertible | Non-convertible |
Description of the Capital Instrument
| Issuer | Bank of Ceylon | Bank of Ceylon |
| Unique identifier | LK0357D23789 | BOC17UL001 |
| Governing laws of the instrument | Laws of Sri Lanka | Laws of Sri Lanka |
| Original date of issuance | 29 December 2016 | 29 December 2017 |
| Par value of instrument – LKR | 100 | 100 |
| Issued quantity (Number of debentures) | 200 | 50,000,000 |
| Issued quantity (LKR ’000) | 20 | 5,000,000 |
| Perpetual or dated | ||
| Original maturity date, if applicable | 28 December 2024 | 28 December 2025 |
| Amount recognised in regulatory capital (in LKR ’000 as at the reporting date) | 20 | 5,000,000 |
| Accounting classification (equity/liability) | Liability | Liability |
| Coupons/Dividends | ||
| Fixed or floating dividend/coupon | FLOATING | FIXED |
| Coupon rate and any related index (%) | 10.47 | 12.75 |
| Non-cumulative or cumulative | Non-cumulative | Non-cumulative |
| Convertible or non-convertible | Non-convertible | Non-convertible |
Credit Risk Under Standardised Approach
Credit Risk Exposures and Credit Risk Mitigation (CRM) Effects – Bank
| Asset Class | As at 31 December 2017 | |||||
|
Exposures before Credit Conversion Factor (CCF) and CRM |
Exposures Post-CCF and CRM |
RWA and RWA Density |
||||
|
On Balance Sheet
Amount LKR ’000 |
Off Balance Sheet
Amount LKR ’000 |
On Balance Sheet
Amount LKR ’000 |
Off Balance Sheet
Amount LKR ’000 |
RWA Amount LKR ’000 |
RWA Density(ii) % |
|
| Claims on Central Government and CBSL | 744,103,499 | 14,377,840 | 744,103,499 | 2,875,568 | – | 0.00 |
|
Claims on foreign sovereigns and their central banks |
14,076,995 | – | 14,076,995 | – | 13,229,105 | 93.98 |
| Claims on public sector entities | 266,487,443 | 117,738,026 | 22,219,935 | 4,982,987 | 27,202,923 | 100.00 |
|
Claims on official entities and multilateral development banks |
– | – | – | – | – | – |
| Claims on banks exposures | 39,786,210 | 16,495,852 | 39,786,210 | 16,495,852 | 31,175,173 | 55.39 |
| Claims on financial institutions | 20,634,029 | – | 20,634,029 | – | 11,897,065 | 57.66 |
| Claims on corporates | 223,203,521 | 207,658,167 | 195,205,660 | 39,029,515 | 229,696,555 | 98.06 |
| Retail claims | 431,296,587 | 81,566,976 | 396,420,542 | 12,564,565 | 337,677,260 | 82.56 |
| Claims secured by gold | 47,728,809 | – | 47,728,809 | – | 1,856,163 | 3.89 |
| Claims secured by residential property | 63,201,877 | – | 63,201,877 | – | 42,690,911 | 67.55 |
|
Claims secured by commercial real estate |
14,951,370 | – | 14,951,370 | – | 14,951,370 | 100.00 |
| Non-performing assets (NPAs)(i) | 4,379,161 | – | 4,379,161 | – | 5,574,595 | 127.30 |
| Higher-risk categories | 977,012 | – | 977,012 | – | 2,442,530 | 250.00 |
| Cash items and other assets | 99,205,282 | – | 99,205,282 | – | 46,015,541 | 46.38 |
| Total | 1,970,031,795 | 437,836,860 | 1,662,890,381 | 75,948,487 | 764,409,191 | 43.96 |
Credit Risk Exposures and Credit Risk Mitigation (CRM) Effects – Group
| Asset Class | As at 31 December 2017 | |||||
|
Exposures before Credit Conversion Factor (CCF) and CRM |
Exposures Post-CCF and CRM |
RWA and RWA Density |
||||
|
On Balance Sheet
Amount LKR ’000 |
Off Balance Sheet
Amount LKR ’000 |
On Balance Sheet
Amount LKR ’000 |
Off Balance Sheet
Amount LKR ’000 |
RWA
Amount LKR ’000 |
RWA Density(ii) % |
|
| Claims on Central Government and CBSL | 752,065,398 | 14,377,840 | 752,065,398 | 2,875,568 | – | 0.00 |
|
Claims on foreign sovereigns and their central banks |
14,076,995 | – | 14,076,995 | – | 13,229,105 | 93.98 |
| Claims on public sector entities | 266,487,443 | 117,738,026 | 22,219,935 | 4,982,987 | 27,202,923 | 100.00 |
|
Claims on official entities and multilateral development banks |
– | – | – | – | – | – |
| Claims on banks exposures | 37,069,446 | 16,495,852 | 37,069,446 | 16,495,852 | 28,458,409 | 53.13 |
| Claims on financial institutions | 20,634,029 | – | 20,634,029 | – | 11,897,065 | 57.66 |
| Claims on corporates | 252,836,498 | 207,658,167 | 224,838,637 | 39,029,515 | 259,329,531 | 98.28 |
| Retail claims | 431,296,587 | 81,566,976 | 396,420,542 | 12,564,565 | 337,677,260 | 82.56 |
| Claims secured by gold | 47,728,809 | – | 47,728,809 | – | 1,856,163 | 3.89 |
| Claims secured by residential property | 63,201,877 | – | 63,201,877 | – | 42,690,911 | 67.55 |
|
Claims secured by commercial real estate |
14,951,370 | – | 14,951,370 | – | 14,951,370 | – |
| Non-Performing Assets (NPAs)(i) | 4,379,161 | – | 4,379,161 | – | 5,574,595 | 127.30 |
| Higher-risk categories | 162,300 | – | 162,300 | – | 405,750 | 250.00 |
| Cash items and other assets | 123,793,849 | – | 123,793,849 | – | 65,441,854 | 52.86 |
| Total | 2,028,683,762 | 437,836,861 | 1,721,542,348 | 75,948,487 | 808,714,936 | 44.99 |
Note:
(i) NPAs as per Banking Act Directions on Classifications and Advances, Income recognition and provisioning.
(ii) RWA Density – Total RWA/Exposures Post CCF and CRM.
Exposures by Asset Classes and Risk Weights – Bank
| Description | As at 31 December 2017 (Post CCF and CRM) | |||||||
|
Risk Weight Asset Classes |
0%
LKR ’000 |
20%
LKR ’000 |
50%
LKR ’000 |
75%
LKR ’000 |
100%
LKR ’000 |
150%
LKR ’000 |
>150%
LKR ’000 |
Total Credit
Exposure Amount LKR ’000 |
|
Claims on Central Government and Central Bank of Sri Lanka |
744,103,499 | – | – | – | – | – | 744,103,499 | |
|
Claims on foreign sovereigns and their central banks |
– | – | 1,695,781 | – | 12,381,214 | – | – | 14,076,995 |
| Claims on public sector entities | – | – | – | – | 22,219,935 | – | – | 22,219,935 |
|
Claims on official entities and multilateral development banks |
– | – | – | – | – | – | – | |
| Claims on banks exposures | – | 14,944,273 | 7,614,770 | – | 17,227,167 | – | – | 39,786,210 |
| Claims on financial institutions | – | 4,471,200 | 10,320,007 | – | 5,842,822 | – | – | 20,634,029 |
| Claims on corporates | – | 1,835,552 | 2,747,765 | 190,622,343 | – | – | 195,205,660 | |
| Retail claims | – | – | 285,231,386 | 111,189,156 | – | – | 396,420,542 | |
| Claims secured by gold | 38,447,993 | 9,280,816 | – | – | – | – | 47,728,809 | |
|
Claims secured by commercial residential property |
– | – | 41,021,932 | – | 22,179,945 | – | – | 63,201,877 |
|
Claims secured by commercial real estate |
– | – | – | – | 14,951,370 | – | – | 14,951,370 |
| Non-Performing Assets (NPAs) | – | – | – | – | 1,988,292 | 2,390,869 | – | 4,379,161 |
| Higher-risk categories | – | – | – | – | 977,012 | 977,012 | ||
| Cash items and other assets | 42,637,252 | 13,190,611 | – | – | 43,377,419 | – | – | 99,205,282 |
| Total | 825,188,744 | 43,722,452 | 63,400,255 | 285,231,386 | 441,979,663 | 2,390,869 | 977,012 | 1,662,890,381 |
Exposures by Asset Classes and Risk Weights – Group
| Description | As at 31 December 2017 (Post CCF and CRM) | |||||||
|
Risk Weight Asset Classes |
0%
LKR ’000 |
20%
LKR ’000 |
50%
LKR ’000 |
75%
LKR ’000 |
100%
LKR ’000 |
150%
LKR ’000 |
>150%
LKR ’000 |
Total Credit
Exposure Amount LKR ’000 |
|
Claims on Central Government and Central Bank of Sri Lanka |
752,065,398 | – | – | – | – | – | – | 752,065,398 |
|
Claims on foreign sovereigns and their central banks |
– | – | 1,695,781 | – | 12,381,214 | – | – | 14,076,995 |
| Claims on public sector entities | – | – | – | – | 22,219,935 | – | – | 22,219,935 |
|
Claims on official entities and multilateral development banks |
– | – | – | – | – | – | – | – |
| Claims on banks exposures | – | 14,944,273 | 7,614,770 | – | 14,510,403 | – | – | 37,069,446 |
| Claims on financial institutions | – | 4,471,200 | 10,320,007 | – | 5,842,822 | – | – | 20,634,029 |
| Claims on corporates | – | 1,835,552 | 2,747,765 | – | 220,255,320 | – | – | 224,838,637 |
| Retail claims | – | – | – | 285,231,386 | 111,189,156 | – | – | 396,420,542 |
| Claims secured by gold | 38,447,993 | 9,280,816 | – | – | – | – | – | 47,728,809 |
|
Claims secured by commercial residential property |
– | – | 41,021,932 | – | 22,179,945 | – | – | 63,201,877 |
|
Claims secured by commercial real estate |
– | – | – | – | 14,951,370 | – | – | 14,951,370 |
| Non-Performing Assets (NPAs) | – | – | – | – | 1,988,292 | 2,390,869 | – | 4,379,161 |
| Higher-risk categories | – | – | – | – | – | – | 162,300 | 162,300 |
| Cash items and other assets | 47,799,506 | 13,190,611 | – | – | 62,803,732 | – | – | 123,793,849 |
| Total | 838,312,897 | 43,722,452 | 63,400,255 | 285,231,386 | 488,322,189 | 2,390,869 | 162,300 | 1,721,542,348 |
Market Risk Under Standardised Measurement Method
| Item | 2017 | |
|
Bank
LKR ’000 |
Group
LKR ’000 |
|
| (a) Capital charge for interest rate risk | 112,204 | 112,204 |
| General interest rate risk | 112,204 | 112,204 |
| (i) Net long or short position | 112,204 | 112,204 |
| (ii) Horizontal disallowance | – | – |
| (iii) Vertical disallowance | – | – |
| (iv) Options | – | – |
| Specific interest rate risk | – | – |
| (b) Capital charge for equity | 604,055 | 604,055 |
| (i) General equity risk | 324,439 | 324,439 |
| (ii) Specific equity risk | 279,616 | 279,616 |
| (c) Capital charge for foreign exchange and gold | 205,964 | 205,964 |
| Total capital charge for market risk [(a)+(b)+(c)] | 922,223 | 922,223 |
| Total risk weighted amount for market risk | 7,848,707 | 7,848,707 |
Operational Risk Under Basic Indicator Approach – Bank
| Gross Income as at 31 December 2017 | |||||
| Business Lines | Capital Charge Factor | Fixed Factor |
1st Year
LKR ’000 |
2nd Year
LKR ’000 |
3rd Year
LKR ’000 |
| The basic indicator approach | 15% | 66,324,079 | 70,270,961 | 68,808,549 | |
| Capital charges for operational risk | – | – | 10,270,179 | ||
| Risk weighted amount for operational risk | – | – | 87,405,782 | ||
Operational Risk Under Basic Indicator Approach – Group
| Gross Income as at 31 December 2017 | |||||
| Business Lines | Capital Charge Factor | Fixed Factor |
1st Year
LKR ’000 |
2nd Year
LKR ’000 |
3rd Year
LKR ’000 |
| The basic indicator approach | 15% | 71,016,573 | 76,299,836 | 80,756,706 | |
| Capital charges for operational risk | – | – | 11,403,656 | ||
| Risk weighted amount for operational risk | – | – | 97,052,389 | ||
Differences between Accounting and Regulatory Scopes and Mapping of Financial Statement Categories with Regulatory Risk Categories – Bank only
| Amount as at 31 December 2017 | |||||
| a | b | c | d | e | |
| Item |
Carrying Values
Reported in Published Financial Statements LKR ’000 |
Carrying Values
Under Scope of Regulatory Reporting LKR ’000 |
Subject to
Credit Risk Framework LKR ’000 |
Subject to
Market Risk Framework LKR ’000 |
Not Subject to
Capital Requirements or Subject to Dedication from Capital LKR ’000 |
| Assets | 1,951,803,953 | 1,971,261,258 | 1,962,790,186 | 12,965,786 | 8,471,072 |
| Cash and cash equivalents | 72,843,108 | 72,843,108 | 72,843,108 | 862,266 | – |
| Balances with Central Banks | 68,689,012 | 69,212,148 | 69,212,148 | – | – |
| Placements with banks | 8,067,490 | 25,134,938 | 25,134,938 | – | – |
| Securities purchased under resale agreements | 18,455,555 | 19,750,000 | 19,750,000 | – | – |
| Derivative financial instruments | 1,618,823 | – | – | – | – |
| Financial instruments – Held for trading | 8,359,274 | 8,208,176 | 8,192,986 | 8,057,180 | 15,190 |
| Financial investments – Loans and receivables | 213,167,048 | 202,432,055 | 202,432,055 | – | – |
| Loans and advances to customers | 1,163,160,914 | 1,167,114,297 | 1,167,114,297 | – | – |
| Financial investments – Available for sale | 17,921,170 | 13,668,917 | 10,682,504 | 4,046,340 | 2,986,413 |
| Financial investments – Held to maturity | 308,256,082 | 307,384,458 | 307,384,458 | – | – |
| Investments in subsidiary companies | 6,513,048 | 6,513,048 | 1,854,308 | – | 4,658,740 |
| Investments in associate companies | 92,988 | 92,988 | 92,988 | – | – |
| Investment properties | 2,882,928 | 2,882,928 | 2,882,928 | – | – |
| Property, Plant and Equipment | 23,046,114 | 17,031,057 | 17,031,057 | – | – |
| Leasehold properties | 101,481 | 101,481 | 101,481 | – | – |
| Intangible assets | 810,730 | 810,729 | – | 810,729 | |
| Deferred tax assets | – | – | – | – | – |
| Other assets | 37,818,188 | 58,080,930 | 58,080,930 | – | – |
| On balance sheet liabilities | 1,840,648,878 | 1,865,353,554 | – | – | – |
| Due to banks | 2,203,199 | 2,203,199 | – | – | – |
| Securities sold under repurchase agreements | 44,487,462 | 44,087,142 | – | – | – |
| Derivative financial instruments | 70,715 | – | – | – | |
| Due to customers | 1,546,832,036 | 1,510,317,734 | – | – | – |
| Other borrowings | 178,191,089 | 175,782,928 | – | – | – |
| Debt securities issued | – | – | – | – | – |
| Current tax liabilities | 1,877,342 | 1,877,342 | – | – | – |
| Deferred tax liabilities | 5,820,329 | 2,272,386 | – | – | – |
| Other liabilities | 18,596,249 | 86,812,823 | – | – | – |
| Subordinated term debts | 42,570,457 | 42,000,000 | – | – | – |
| Off balance sheet liabilities | 507,258,821 | 522,647,043 | 457,836,859 | – | – |
| Guarantees | 49,450,446 | 49,450,446 | 49,450,446 | – | – |
| Performance bonds | 34,143,409 | 34,143,409 | 34,143,409 | – | – |
| Letters of credit | 104,675,380 | 104,675,380 | 104,675,380 | – | – |
| Other contingent items | 43,212,005 | 43,212,005 | 43,212,005 | – | – |
| Undrawn loan commitment | 29,679,521 | 29,679,521 | 29,679,521 | – | – |
| Other commitments | 246,098,060 | 261,486,282 | 176,676,098 | – | – |
| Shareholder’s equity | 20,000,000 | 20,000,000 | – | – | – |
| Equity Capital (Stated Capital)/Assigned Capital | |||||
| of which amount eligible for CET I | 20,000,000 | 20,000,000 | – | – | – |
| of which amount eligible for AT I | – | – | – | – | – |
| Retained earnings | 63,472,250 | 65,951,935 | – | – | – |
| Accumulated other comprehensive income | 3,718,526 | 400,140 | – | – | – |
| Other reserves | 23,964,299 | 19,555,630 | – | – | – |
| Total shareholder’s equity | 111,155,075 | 105,907,705 | – | – | – |
| Total on balance sheet liabilities and equity capital and reserves |
1,951,803,953 | 1,971,261,259 | – | – | – |
Explanations of Differences between Accounting and Regulatory Exposure Amounts
Difference arises due to fair value adjustments, impairment under incurred loss model on financial instruments and the classification adjustments between line items of the financial position under SLFRSs.
Derivative Financial Instruments
Derivatives are financial instruments that derive their value in response to changes in interest rates, financial instrument prices, commodity prices, foreign exchange rates, credit risk, indices etc.
Derivative financial instruments are measured at fair value using forward pricing models in Published Financial Statement and more details are given in Note 24 and Note 40 in this Report.
Loans and Advances to Customers
Allowance for Impairment
Time-based provisions under Central Bank guide lines have been netted off from the amortised cost when arriving loans and advances to the customers under regulatory reporting, however as per LKAS 39 “impairment under incurred loss model” have been netted off from amortised cost when arriving loans and advances to the customers under reporting purposes. More details are given under Note 27.
Day One Difference
When the transaction price differs from the fair value of other observable current market transactions in the same instrument, Bank recognises fair value of such transactions as per LKAS 39. More details are given in Note 4.4.4 and Note 37. However, Bank recognises cost of such transactions under regulatory reporting.
Financial Investment – Available for Sale
Financial Investment available for sale are measured at fair value under published Financial Statements and carried at cost for regulatory reporting purposes.
The details of financial investments – available for sale and the fair valuation of these instruments are disclosed in Note 28 and Note 59 respectively.
The following disclosures are included in Note 60 on Risk Management.
(i) Summary discussion on adequacy/meeting current and future capital requirement
(ii) Bank risk management approach
(iii) Risk management related to key risk exposures
Computation of Capital Adequacy Ratio Under Basel II – 2016
|
Bank
LKR million |
Group
LKR million |
|
| Tier 1: Core Capital | ||
| Paid-up ordinary shares | 15,000 | 15,000 |
| Permanent reserve fund | 7,996 | 7,996 |
| Published retained profits | 54,155 | 55,659 |
| General and other reserves | 1,209 | 1,764 |
| Non-controlling interests | – | 879 |
| Deductions | ||
| 50% of investments in unconsolidated banking and financial subsidiaries) | (2,179) | – |
| Other deductions | (2,053) | (2,150) |
| Total eligible core capital (Tier 1 capital) | 74,128 | 79,148 |
| Tier 2: Supplementary Capital | ||
| Revaluation reserves (as approved by Central Bank of Sri Lanka) | 2,373 | 2,373 |
| General provisions | 4,648 | 4,647 |
| Approved subordinated term debt | 27,378 | 27,377 |
| Deductions | (3,669) | (1,489) |
| Total eligible supplementary capital (Tier 2 capital) | 30,730 | 32,909 |
| Total capital base | 104,858 | 112,057 |
Risk-Weighted Assets – 2016
| Computation of Risk-Weighted Assets | Bank | Group | |||
| Business Lines | Risk Weight Factor |
On Balance
Sheet Assets and Credit Equivalent of Off Balance Sheet Assets LKR million |
Risk Weighted
Assets LKR million |
On Balance
Sheet Assets and Credit Equivalent of Off balance Sheet Assets LKR million |
Risk weighted
Assets LKR million |
| Assets | |||||
| Claims on Government of Sri Lanka and Central Bank of Sri Lanka | 0 | 604,897 | – | 611,663 | – |
| Claims on foreign sovereigns and their central banks | 0-150 | 18,047 | 17,217 | 18,047 | 17,217 |
| Claims on public sector entities (PSEs) | 20-150 | 72,847 | 72,847 | 72,847 | 72,847 |
| Claims on banks | 20-150 | 63,910 | 33,074 | 65,167 | 34,331 |
| Claims on financial institutions | 20-150 | 26,260 | 13,486 | 26,260 | 13,486 |
| Claims on corporates | 20-150 | 200,222 | 195,155 | 226,381 | 221,314 |
| Retail claims | 75-100 | 374,859 | 307,972 | 374,859 | 307,973 |
| Claims secured by residential property | 50-100 | 54,492 | 36,135 | 54,491 | 36,135 |
| Non-performing assets (NPAs) | 50-150 | 4,457 | 5,797 | 4,457 | 5,797 |
| Cash items | 0-20 | 55,742 | 2,673 | 61,280 | 2,673 |
|
Exposures collateralised by cash, gold and Government Securities |
0 | 242,523 | – | 242,523 | – |
| Property, Plant and Equipment | 100 | 15,584 | 15,584 | 26,464 | 26,464 |
| Other assets | 100 | 34,879 | 34,875 | 35,806 | 35,806 |
| Total exposure | 1,768,719 | 734,820 | 1,820,245 | 774,043 | |
| Off Balance Sheet Exposures |
Credit
Conversion Factor % |
Assets
LKR million |
Credit
Equivalent LKR million |
Assets
LKR million |
Credit
Equivalent LKR million |
| Direct credit substitutes | 100 | 42,383 | 42,383 | 42,383 | 42,383 |
| Transaction-related contingencies | 50 | 33,839 | 16,919 | 33,839 | 16,919 |
| Short-term self-liquidating trade-related contingencies | 20 | 150,448 | 30,090 | 150,448 | 30,090 |
| Other commitments with and original maturity of up to one year or which can be unconditionally cancelled at any time | 0 | 81,126 | – | 81,126 | – |
| Commitments with an original maturity up to one year and maturity of over one year | 20-50 | 31,393 | 15,589 | 31,393 | 15,589 |
| Foreign exchange contracts | 2-5 | 157,776 | 3,155 | 157,776 | 3,155 |
| Total off balance sheet exposure | 496,965 | 108,136 | 496,965 | 108,136 |
Market Risk – The Standardised Measurement Approach – 2016
| Off Balance Sheet Exposures |
Bank
LKR million |
Group
LKR million |
| Capital Charge for | ||
| Interest rate risk | 77 | 77 |
| Equity | 551 | 551 |
| Foreign exchange and gold | 1,359 | 1,359 |
| Total capital charges for market risk | 1,987 | 1,987 |
| Total risk-weighted assets for market risk | 19,872 | 19,872 |
Operational Risk – The Basic Indicator Approach – 2016
|
Bank
LKR million |
Group
LKR million |
|
| Capital Charge for Operational Risk | ||
| Total gross income of three consecutive years | 190,071 | 209,143 |
| Average gross income | 63,357 | 69,714 |
| Total capital charges for operational risk – (15%) | 9,503 | 10,457 |
| Total risk-weighted assets for operational risk | 95.035 | 104,572 |
Capital Adequacy Summery – 2016
|
Bank
LKR million |
Group
LKR million |
|
| Computation of Ratios | ||
| Total Risk Weighted Assets | ||
| Total weighted assets for credit risk | 734,820 | 774,043 |
| Total weighted assets for market risk | 19,872 | 19,872 |
| Total weighted assets for operational risk | 95,036 | 104,572 |
| Subtotal | 849,728 | 898,487 |
| Minimum Capital Charges | ||
| Credit risk | 73,482 | 77,404 |
| Market risk | 1,987 | 1,987 |
| Operational risk | 9,503 | 10,457 |
| Total eligible core capital (Tier 1 capital) | 74,128 | 79,148 |
| Total eligible supplementary capital (Tier 2 capital) | 30,730 | 32,909 |
| Total capital base | 104,858 | 112,057 |
| Core capital ratio | 8.7% | 8.8% |
| Total capital adequacy ratio | 12.3% | 12.5% |