People’s Leasing & Finance PLC
Annual Report 2019/20
Financial capital


Being a finance company, financial capital is the lifeblood of our business which is directly linked with all other capitals within our value creation process. It comprises of the funds contributed by the shareholders and the reserves built up over the years by retaining part of the profit as well as funds sourced from investors in debt securities, borrowings from banks and deposits from customers. Executing the financial intermediary role, we invest these funds in loans and advances and other investments to generate sustainable returns which in turn are shared among the key stakeholders of the Company.
Accounts for 13.40% of the industry’s loans and advances
Overview of the Company’s Financial Performance
In the wake of one of the most challenging years in our history, People’s Leasing & Finance PLC completed the financial year 2019/20 with a profit after tax of Rs. 2,942.51 million. The overall slowdown in the economy following the Easter Sunday attacks and COVID-19 global pandemic caused negative sentiments on key business segments of the country and lowered the disposable income level of our customers. In addition, challenging economic setting of low growth rates, year-round effect from LTV rules and deteriorating external value of rupee also had a negative bearing upon the financial performance of the leasing sector of the country during the year.
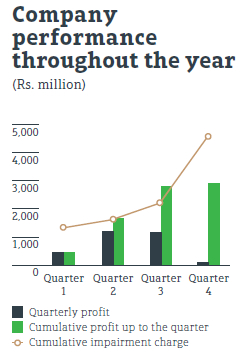
After a sluggish start to the year following the Easter Sunday attacks in April, the Company’s performance began to improve and achieved almost 90% of its original forecast in eleven months period up to February 2020. However, with the emergence of COVID-19 outbreak in the country, the Company’s March financial performance was adversely impacted with high impairment charges and disposal losses resulting in a decline in cumulative profit for the year ended 31 March 2020.
A detailed analysis of our financial performance during the year under review follows:
Net interest income
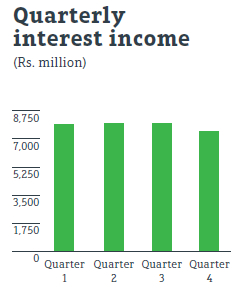
Year-on-year growth of the interest income was limited to 2.0% mainly due to the shortfall in achieving the budgeted business volumes in the immediate aftermath of the Easter Sunday attacks and delays in repayments of customers due to COVID-19 pandemic. In this backdrop, total interest earning assets evidenced a marginal decline of 1.89% compared to 31 March 2019. Interest income and net interest income experienced a significant decline in the last quarter because of the restricted business activities since mid-March 2020 given to the COVID-19 outbreak in the country and the reduction in interest rates at the latter part of the financial year.
Growth in interest expense was also limited given the low interest rate regime and the reduction in interest bearing liabilities, yet witnessed a slight increase of 0.90% due to interest charge for operating lease liabilities of Rs. 238.58 million recognised during the year 2019/20 with the adoption of SLFRS 16 – “Leases”.
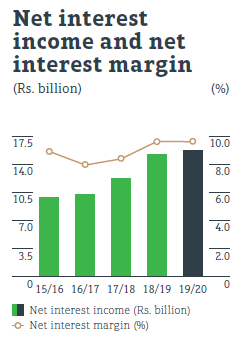
Growth in interest income by 2.02% while curtailing the growth in interest expense to 0.90% contributed to the growth in net interest income by 3.18% to Rs. 15,672.52 million as against Rs. 15,190.20 million in the financial year 2018/19. However, net interest margin (NIM) contracted marginally in 2019/20 to 9.68% from the 9.70% recorded in 2018/19.
Other income
Other income comprising fees and commission income, net gains/(losses) on financial assets – fair value through profit or loss and other operating income reflects 12.68% improvement over the previous year to Rs. 2,140.21 million mainly with the increase in services provided to subsidiaries which resulted in increased shared income and increase in fee-based income.
Operating expenses
Operating expenses mainly comprising of personnel expenses and other operating expenses, grew slightly by 0.69% to Rs. 6,506.65 million in comparison to Rs. 6,462.19 million in the last financial year. Personnel expenses which accounts for the significant portion of operating expenses recorded 7.66% year-on-year growth with the increase in number of employees compared to the preceding financial year and annual salary increment granted in October 2019.
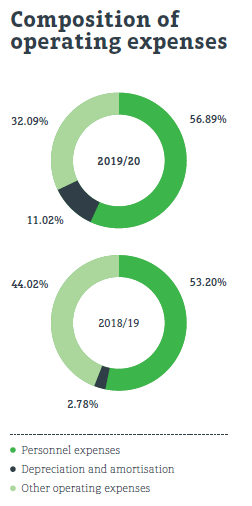
As a consequence of the new accounting standard SLFRS 16 – “Leases” becoming effective, rent payments included in other operating expenses was replaced with amortisation of right-of-use assets and interest cost on operating lease liabilities leading to a 26.58% decline in other operating expenses over the last year.
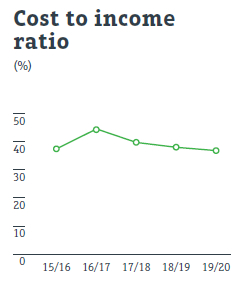
However, growth in overall operating expenses was below the total operating income growth of 4.23% resulting in an improved cost to income ratio of 36.53% compared to 37.81% in the financial year 2018/19.
Impairment charges and asset quality
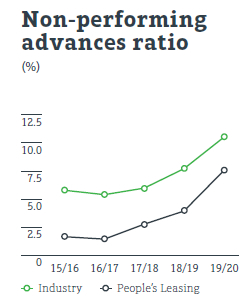
The Company’s credit quality was under pressure during the financial year, a situation that was experienced across the industry mainly due to slowdown in economic activities following the Easter Sunday attacks and difficulties encountered on recoveries in the midst of COVID-19 outbreak that occurred in mid-March 2020. Consequently, gross non-performing advances ratio (NPA) of the Company rose to 7.62% by the end March 2020 in comparison to 3.91% in March 2019. However, the ratio still remained well below the industry average ratio of 10.6% reported in December 2019. (Industry average as per the CBSL Annual Report.)
As a result of reduced recoveries, the Company saw its impairment charges and other losses for loans and receivables for the year ended 31 March 2020 rising to Rs. 4,646.68 million as against Rs. 1,586.51 million in the previous year which had a direct impact on the Company’s profitability for the year. In accordance with the practical expedient issued by CA Sri Lanka, the Company considered February 2020 Days Past Due (DPD) for calculating the Probability of Default (PD) as at 31 March 2020 modified for economic factor adjustments, instead of March DPD, due to March figures been impacted by the setting of COVID-19 pandemic.
Taxes
Income tax expense of the Company for the year under review amounted to Rs. 1,609.32 million resulting in an effective tax rate of 35.36%. Since the new rate of 24% is applicable only for three months of the financial year and the rate has not yet been enacted, the Company used 28% for the provisioning of income tax for the financial year. Accordingly, the positive impact of the rate reduction for the final quarter has not been taken into account. The reduced rate will be taken into consideration at the time of paying the tax.
As per the notices issued by the Department of Inland Revenue, Debt Repayment Levy (DRL) and Economic Service Charge (ESC) were abolished with effect from 1 January 2020 whilst Nation Building Tax (NBT) was abolished with effect from 1 December 2019. Hence, DRL has been charged at 7% only for the first nine months of the financial year, on the value addition attributable to the supply of financial services. NBT stood at 2% prior to the abolition and this has a positive impact over the earnings since the Company was bearing the tax expense on behalf of the customer. In addition to these changes, value added tax (VAT) rate was also revised to 8% from 15% with effect from 1 January 2020.
Total direct taxes paid by the Company during the year under review increased to Rs. 5,711.95 million in comparison to Rs. 2,942.05 million in 2018/19 financial year whilst indirect taxes paid by the Company during the year ended 31 March 2020 amounted to Rs. 1,312.90 million.
Profitability – PBT and PAT
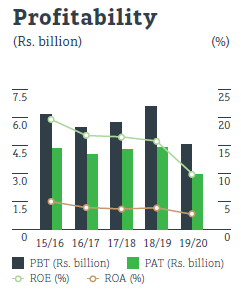
On account of the increased impairment charges and hampered income levels under extremely challenging business setting, the Company’s profit before and after tax for the year contracted to Rs. 4,551.83 million and Rs. 2,942.51 million respectively.
With the reduction in profitability, Return on Assets (ROA) and Return on Equity (ROE) of the Company deteriorated to 2.64% and 10.00% respectively in the financial year 2019/20. However, the ratios remained ahead of the industry average ratios of 2.2% and 7.5% respectively for the year. (Industry averages as per the CBSL Annual Report).
Loans and receivables portfolio
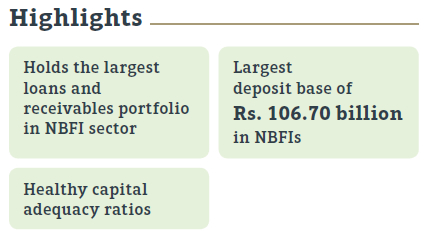
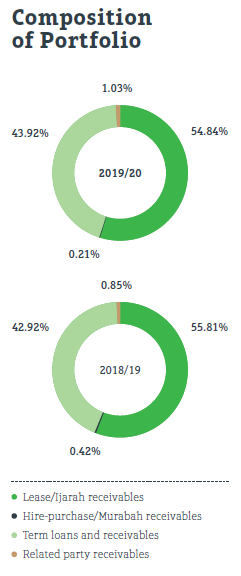
Gross loans and receivables portfolio of the Company as of 31 March 2020 stood at Rs. 156,497.75 million in comparison to Rs. 156,652.24 million as at 31 March 2019. Net portfolio after accounting for individual and collective impairment amounted to Rs. 147,747.51 million as at 31 March 2020 which is the highest portfolio in the non-bank financial institutions sector of the country. This portfolio which represents 86.07% of the total assets of the Company reflects a marginal year-on-year decline of 2.61%. Given the pessimism that prevailed in the market,
new business volume for the year declined to Rs. 70,696.89 million as against Rs. 95,282.60 million in the preceding financial year. Lease/Ijarah receivables remained as the highest contributor to the total gross portfolio, yet indicated a marginal drop compared to the last financial year.
The performance of the new product in our portfolio, gold loan was outstanding, with the portfolio reaching Rs. 895.70 million as at 31 March 2020.
Despite the negative sentiments in the capital market throughout the year, our margin trading receivables posted an increase of 8.47% over the preceding year and reached Rs. 2,232.78 million as at 31 March 2020.
Investment mix
We invested 7.37% of our total assets in interest generating assets other than loans and receivables. These investments mainly comprise of fixed and savings deposits in banks and financial institutions, investments in treasury bills and reverse repurchase agreements which amounted to Rs. 12,649.87 million as of 31 March 2020. The Company’s investment in reverse repurchase agreements and investment in unit trusts recorded a significant growth compared to the last year. However, given the sluggish performance of the Colombo Bourse during the year, market value of the Company’s investment in quoted equity securities deteriorated to Rs. 13.55 million from Rs. 23.19 million as of the last financial year end.
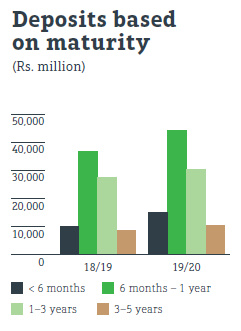
Deposit base
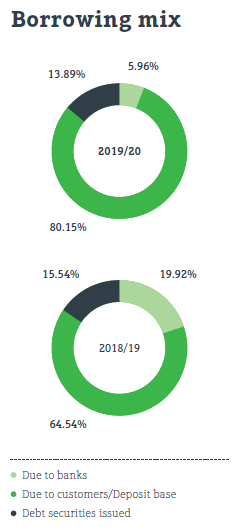
During the year under review, our deposit base comprising of fixed and savings deposits including Islamic deposits topped the Rs. 100 billion mark and reached Rs. 106,701.03 million, up by 20.75% compared to the deposit base as at
31 March 2019. In the midst of rising public distrust surrounding the finance sector in the recent past, People’s Leasing has today secured the largest deposit base in the industry. With this accelerated growth, deposits now represent 80.15% of our borrowing mix in comparison to 64.54% in last financial year.
Our savings base surpassed Rs. 6 billion with a significant year-on-year growth of 26.91% and reached Rs. 6,770.64 million as at 31 March 2020.
The Company still faces the difficulties in finding deposits with longer maturity to match with the long-term lending portfolio. As a result, the deposit base is more skewed towards maturities between
six to twelve months.
Capital and liquidity
As of 31 March 2020, total equity comprising of capital, retained earnings and other reserves amounted to Rs. 30,246.63 million up by 5.75% over the last year. Pursuant to the payment of final dividend for the financial year 2018/19 in the form of a scrip dividend, stated capital of the Company increased to Rs. 13,915.41 million with total number of shares of 1,627,703,388.
Our Tier 1 and Total Capital Ratios of 15.12% and 15.99% respectively are well ahead of the new capital adequacy requirements set out in the Finance Business Act Direction No. 03 of 2018 and are a reflection of a strong financial position.
| 2019/20 | 2018/19 | |
| Tier 1 capital (Rs. million) | 29,269.43 | 26,517.79 |
| Total capital (Rs. million) | 30,941.75 | 28,065.76 |
| Total risk weighted assets amount (Rs. million) | 193,545.73 | 184,636.04 |
| Tier 1 capital ratio – minimum 7% (minimum 6% – 2018/19) (%) | 15.12 | 14.36 |
| Total capital ratio – minimum 11% (minimum 10% – 2018/19) (%) | 15.99 | 15.20 |
The Company also maintained a healthy liquidity position with Rs. 14,459.38 million liquid assets as at 31 March 2020 leading to a ratio of 111.51, thus remaining well above the minimum liquidity requirements specified
by the CBSL.
Group results overview
People’s Leasing Group recorded a post-tax profit of
Rs. 3,591.75 million during the year ended 31 March 2020 compared to Rs. 5,011.27 million during the year ended 31 March 2019. The Group recorded a 5.07% increase in net interest income during the financial year 2019/20 compared to the financial year 2018/19. Group performance was also negatively impacted by the overall economic slowdown.
Total assets of the Group indicated a slight growth compared to the total assets
as at 31 March 2019 and reached Rs. 185,997.29 million as at 31 March 2020. Total net loans and receivables portfolio evidenced 1.8% decline and reached Rs. 154,134.93 million as at 31 March 2020 compared
to the portfolio as at 31 March 2019.
| Indicator (Group) | 2019/20 | 2018/19 |
| Return on assets (%) | 3.07 | 4.26 |
| Return on equity (%) | 10.71 | 16.21 |
| Earnings per share (Rs.) | 2.11 | 3.05 |
| Net assets value per share (Rs.) | 20.25 | 19.44 |
Value generated and distributed
Financial value generated through the effective use of financial capital is distributed or shared with key stakeholders of the Company after retaining the required portion for its future growth. Yet, on account of the increased impairment charges, and reduction in income growth with the impact of COVID-19 outbreak the Company’s economic value distribution had exceeded the economic value generated.
| 2019/20 Rs. million |
2018/19 Rs. million |
|
| Direct economic value generated | ||
| Interest income | 31,459.11 | 30,836.30 |
| Fee and commission income | 1,694.01 | 1,508.95 |
| Other operating income | 446.20 | 390.39 |
| Economic value generated | 33,599.32 | 32,735.64 |
| Economic value distributed | ||
| To providers of capital | ||
| Dividend to equity holders | 1,929.32 | 1,974.83 |
| Interest on borrowings | 4,256.40 | 6,963.55 |
| Interest to deposit holders | 11,530.60 | 8,682.55 |
| 17,716.32 | 17,620.93 | |
| To employees | ||
| Salaries and other benefits | 3,701.39 | 3,438.17 |
| 3,701.39 | 3,438.17 | |
| To Government | ||
| Income tax expense | 2,822.84 | 3,351.43 |
| Tax on financial services | 2,002.46 | 2,087.21 |
| Other taxes paid | 266.54 | 241.41 |
| 5,091.84 | 5,680.05 | |
| To community | ||
| On corporate social responsibility (CSR) and donations | 58.85 | 122.23 |
| 58.85 | 122.23 | |
| Operating costs | ||
| Depreciation and amortisation | 717.02 | 179.61 |
| Impairment charges for loans and receivables and other losses | 4,751.80 | 1,954.88 |
| Other operating expenses | 1,808.64 | 2,572.16 |
| 7,277.46 | 4,706.65 | |
| Economic value distributed | 33,845.86 | 31,568.03 |
| Economic value retained | (246.54) | 1,167.60 |
Economic value added
Economic value added indicates the surplus value created for the shareholders on their investment.
| Economic value added for the year | 2019/20 Rs. million |
2018/19 Rs. million |
| Shareholders’ funds | 30,246.63 | 28,603.36 |
| Add: Accumulated provision for impairment charges |
8,750.24 | 4,944.34 |
| Add: Cumulative market building expenses |
696.75 | 885.95 |
| 39,693.62 | 34,433.65 | |
| Profit attributable to: | ||
| Shareholders | 2,942.51 | 4,416.12 |
| Add: Market building expenses for the year |
196.56 | 324.81 |
| Add: Impairment charge | 3,805.90 | 993.22 |
| Add: Deferred tax charge for the year |
(1,213.52) | (1,182.29) |
| 5,781.45 | 4,551.96 | |
| Economic cost % (average Treasury Bill rate + 2% risk premium) (%) | 10.22 | 10.73 |
| Economic cost | 3,787.90 | 3,508.66 |
| Economic value addition | 1,948.55 | 1,043.30 |
Market value added
Given the lacklustre performance of the capital market throughout the year, the share price of the Company declined during the year causing a decrease in market value added as at 31 March 2020 compared to the last year.
| For the year | 2019/20 Rs. million |
2018/19 Rs. million |
| Market capitalisation/ market value of equity |
19,857.98 | 21,170.16 |
| Less: Shareholders’ funds | 30,246.63 | 28,603.36 |
| Market value added | (10,388,65) | (7,433.20) |