People’s Leasing & Finance PLC
Annual Report 2019/20
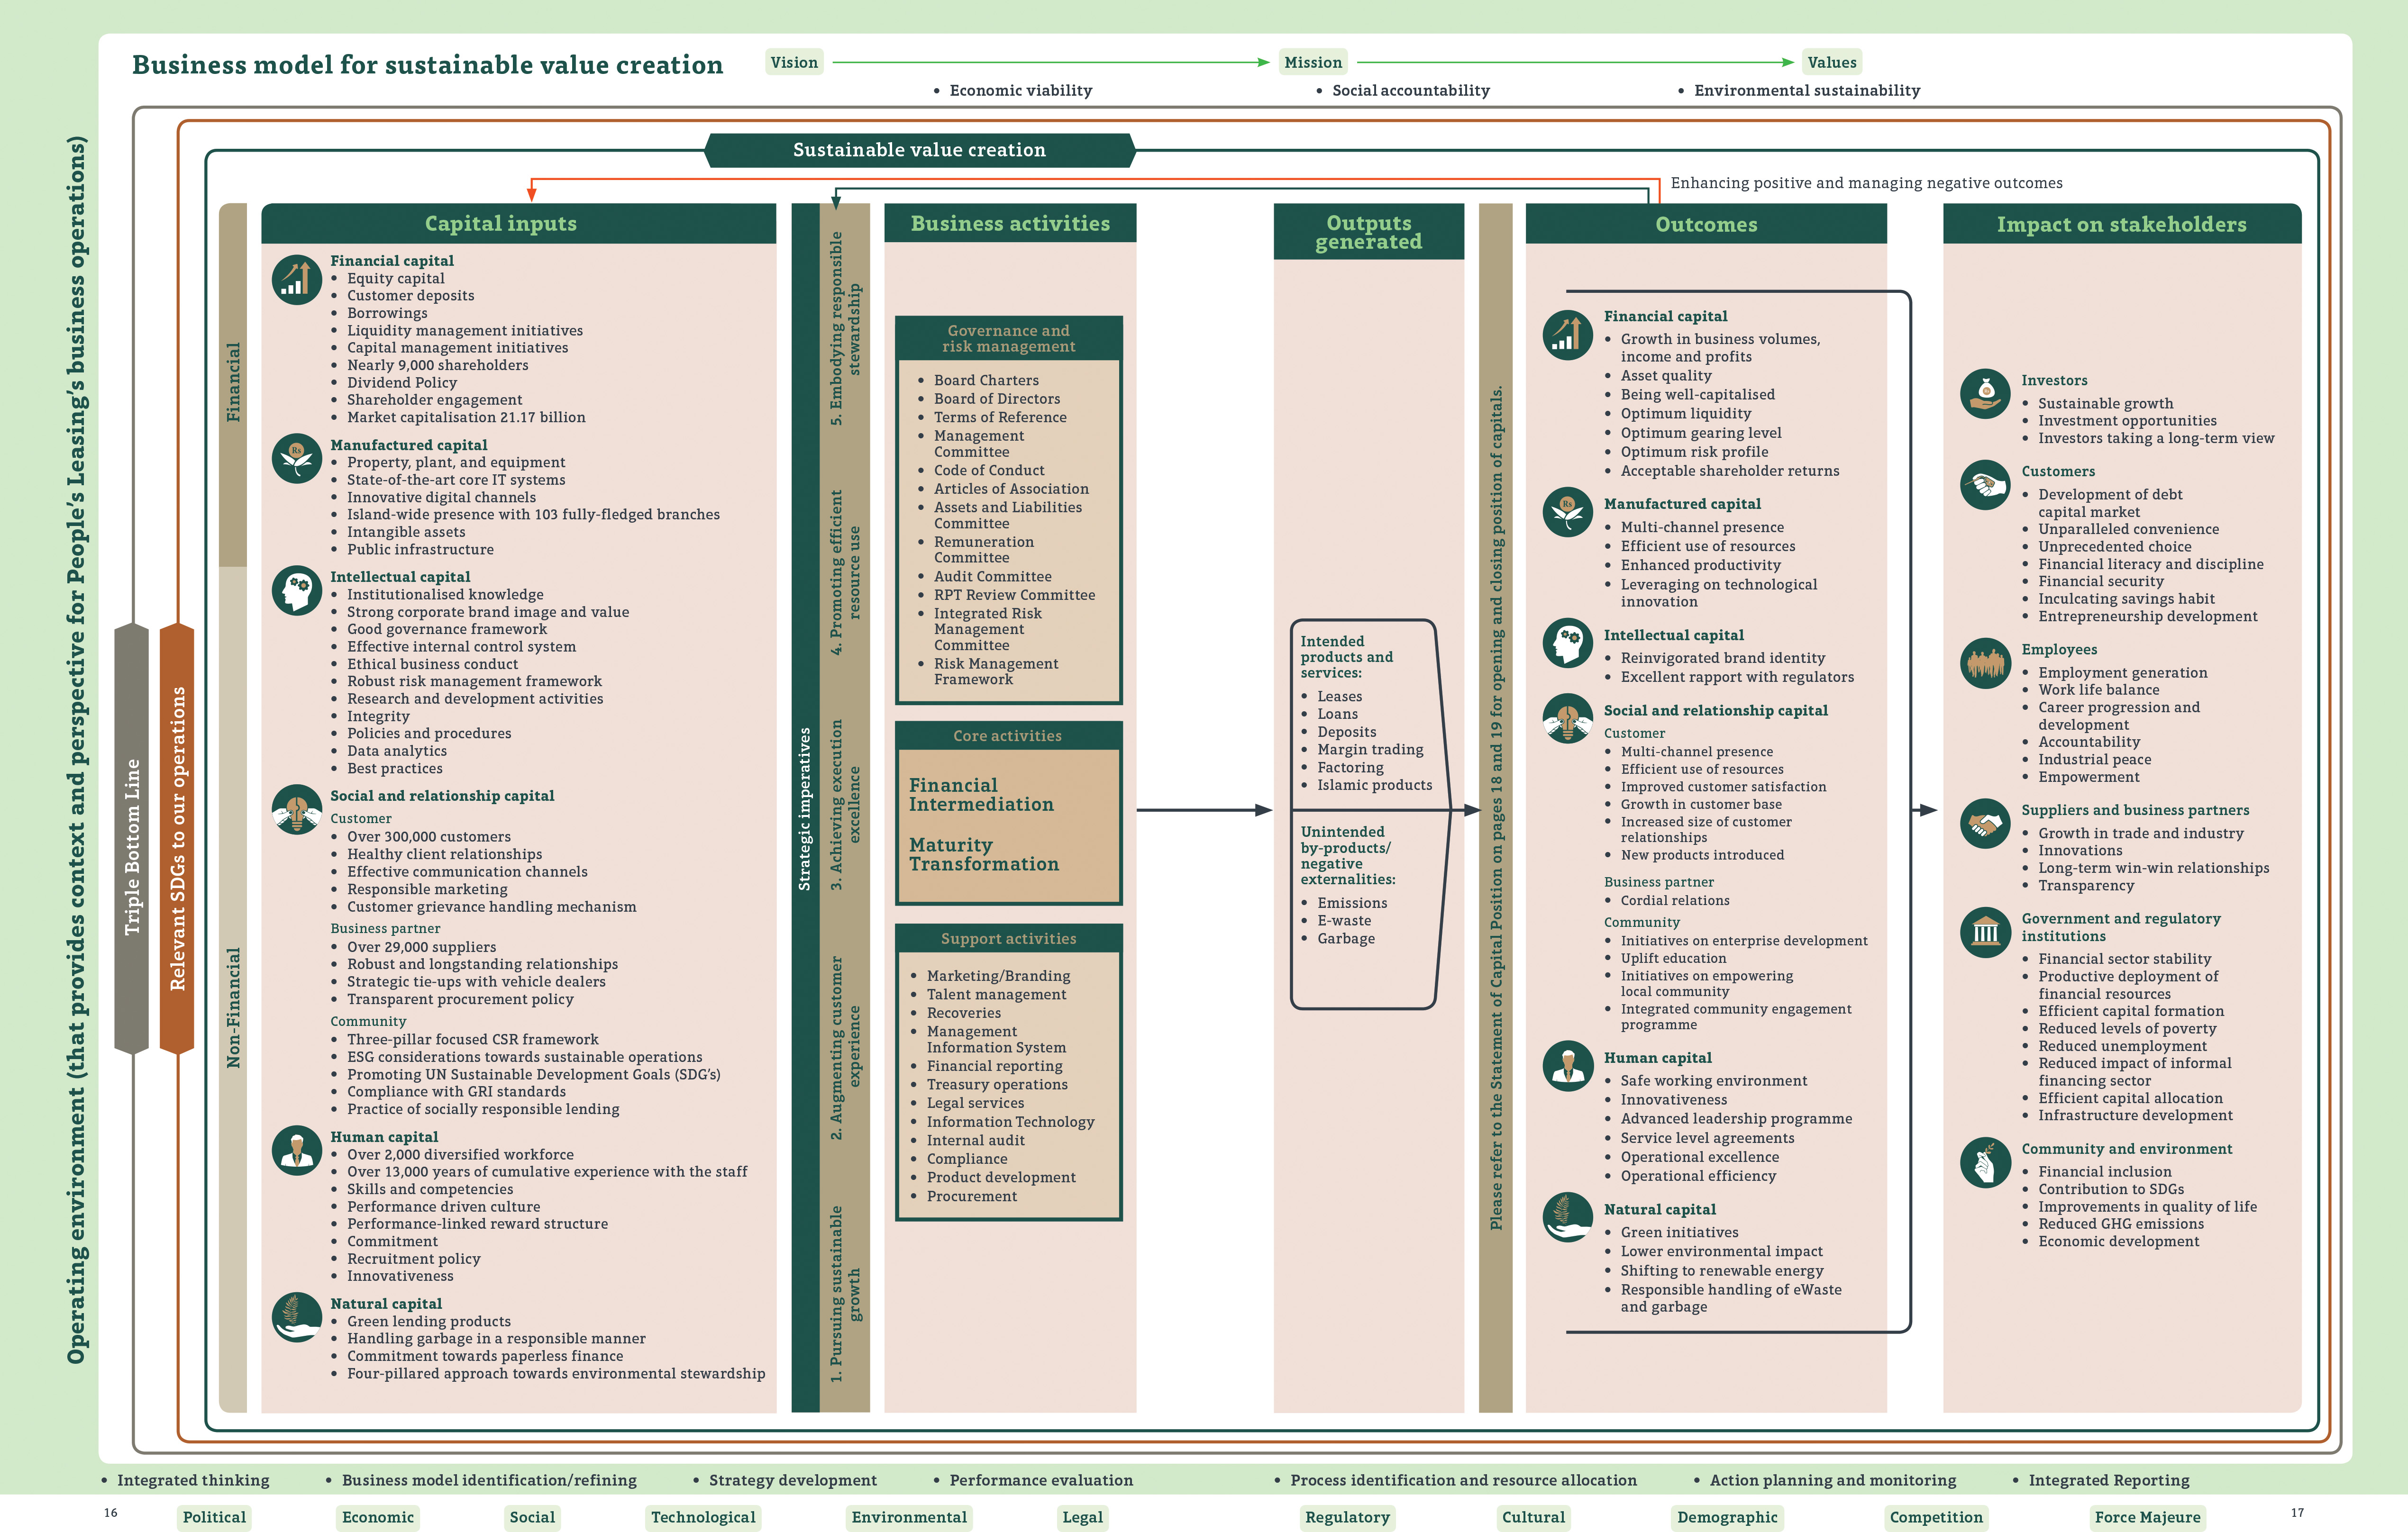
Business model


Statement of capital position
(Value creation as manifested by outcomes on capitals)
| Capital | Indicator | For the year ended/ as at 31 March 2020 |
For the year ended/ as at 31 March 2019 |
Growth | |
 Financial capital |
Gross income (Rs. million) | 33,599.31 | 32,735.64 | 2.64% | |
| Profit after tax (Rs. million) | 2,942.51 | 4,416.12 | (33.37%) | ||
| Total assets (Rs. million) | 171,660.19 | 172,541.28 | (0.51%) | ||
| Return on assets (%) | 2.64 | 3.95 | (1.31) | ||
| Return on equity (%) | 10.00 | 15.88 | (5.88) | ||
| Net assets per share (Rs.) | 18.58 | 18.10 | 2.65% | ||
| Tier 1 capital ratio (%) | 15.12 | 14.36 | 0.76 | ||
| Total capital ratio (%) | 15.99 | 15.20 | 0.79 | ||
| Market capitalisation (Rs. million) | 19,857.98 | 21,170.16 | (6.18%) | ||
| Price to book value (times) | 0.66 | 0.74 | (10.81%) | ||
 Manufactured capital |
Property, plant and equipment (PPE) (Rs. million) | 1,143.93 | 1,098.29 | 4.16% | |
| Investment in PPE during the year (Rs. million) | 213.93 | 147.67 | 44.87% | ||
| Branch network | 103 | 103 | – | ||
| Gold loan units | 14 | 6 | 8 | ||
 Intellectual capital |
Brand value (Rs. million) | 8,786 | 8,719 | 0.77% | |
| Intangible assets (Rs. million) | 257.58 | 324.91 | (20.72%) | ||
| New products introduced (No.) | 1 | 6 | (5.00) | ||
| Expenditure in cybersecurity and expenditure on obtaining certifications (Rs. million) | 1.39 | 0.55 | 152.73% | ||
| Cumulative service of employees (years) | Over 15,000 | Over 13,000 | Over 2000 | ||
| Per employee average experience | Over 6 years | Over 5 years | One year | ||
| Credit rating | A+(lka) by Fitch Ratings Lanka Limited B- Fitch Rating International* | AA-(lka) from Fitch Ratings Lanka Limited B- Fitch Rating International | |||
 Social and relationship capital |
|||||
| Customer | Total number of customers | 339,798 | 311,135 | 9.21% | |
| – Lending customers | 126,715 | 121,129 | 4.61% | ||
| – Deposit customers | 282,944 | 248,587 | 13.82% | ||
| Number of new customers | 29,537 | 32,848 | (10.08%) | ||
| Percentage of repeat customers (%) | 44.22 | 43.47 | 0.75% | ||
| Loans and receivable portfolio (Rs. million) | 147,747.51 | 151,707.90 | (2.61%) | ||
| Market share in deposits (%) | 14.10 | 12.33 | 1.77 | ||
| Market share in total assets (%) | 11.98 | 12.05 | (0.07) | ||
| Savings to total deposits (%) | 6.35 | 6.04 | 0.31 | ||
| Business partner | Number of vehicle suppliers | 32,406 | 28,661 | 13.07% | |
| Total value of vehicle supplies procured (Rs. million) | 60,616.17 | 66,800.57 | (9.26%) |
||
| Community | Investment in local communities (Rs. million) | 55.53 | 120.29 | (64.76%) | |
| Number of entrepreneurs trained/educated | 101 | 1,710 | (94.09%) | ||
| Total investment on entrepreneurship development (Rs. million) | 3.05 | 8.15 | (62.58%) | ||
 Human capital |
Number of employees | 2,401 | 2,329 | 3.09% | |
| Training hours per employee (hours) | 8.73 | 17.90 | (9.17) | ||
| Training cost (Rs. million) | 3.38 | 12.93 | (73.86%) | ||
| Profit (PAT) per employee (Rs. million) | 1.24 | 2.00 | (38.00%) | ||
| Employee retention rate (%) | 90.82 | 88.90 | 2.16 | ||
 Natural capital |
Investment in environmental initiatives (Rs. million) | 3.32 | 1.94 | 71.13% | |
| Carbon footprint (tCO2eq) | 7,955.83 | 6,113.66 | 30.13% | ||
| Energy consumption (kWh) | 14.5x10 6 | 4.5x10⁶ | 9.95x10⁶ | ||
| Green facilities (Rs. billion) | 1.87 | 5.48 | (65.88%) | ||
*Withdrew Fitch International rating from 30 April 2020 onwards.