10
Supplementary reports
Quarterly analysis


Statement of profit or loss
| Company | ||||||||||
| 1st Quarter April-June |
2nd Quarter July-September |
3rd Quarter October-December |
4th Quarter January-March |
Total | ||||||
| Rs. million | 2018 | 2017 | 2018 | 2017 | 2018 | 2017 | 2019 | 2018 | 2019 | 2018 |
| Interest income | 7,221 | 6,260 | 7,630 | 6,565 | 7,969 | 6,745 | 8,016 | 7,135 | 30,836 | 26,705 |
| Less: Interest expenses | 3,683 | 3,512 | 3,825 | 3,635 | 4,013 | 3,681 | 4,125 | 3,672 | 15,646 | 14,500 |
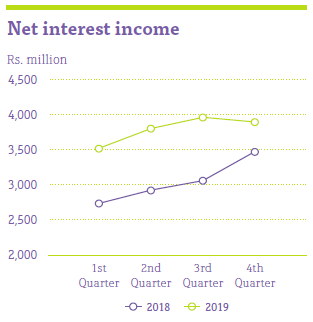
| Net interest income | 3,538 | 2,748 | 3,805 | 2,930 | 3,956 | 3,064 | 3,891 | 3,463 | 15,190 | 12,205 |
| Fee and commission income | 263 | 237 | 346 | 323 | 346 | 300 | 554 | 518 | 1,509 | 1,378 |
| Net gains/losses on financial assets – FVTPL/held for trading |
(9) | 32 | (14) | (12) | (8) | (7) | 3 | 6 | (28) | 19 |
| Other operating income | 45 | 80 | 152 | 160 | 35 | 37 | 186 | 224 | 418 | 501 |
| Total operating income | 3,838 | 3,097 | 4,289 | 3,401 | 4,329 | 3,394 | 4,634 | 4,211 | 17,089 | 14,103 |
| Less: Impairment charges for loans and receivables and other losses | 818 | 539 | 305 | 398 | 469 | 445 | (6) | 48 | 1,586 | 1,430 |
| Impairment charges for investment in associate | – | – | – | – | – | – | 349 | – | 349 | – |
| Impairment charges for goodwill | – | – | – | – | 30 | – | (10) | – | 20 | – |
| Net operating income | 3,020 | 2,558 | 3,984 | 3,003 | 3,830 | 2,949 | 4,301 | 4,163 | 15,134 | 12,673 |
| Less: | ||||||||||
| Personnel expenses | 808 | 660 | 898 | 678 | 945 | 661 | 787 | 975 | 3,438 | 2,974 |
| Depreciation and amortisation | 46 | 45 | 44 | 49 | 45 | 49 | 45 | 50 | 180 | 193 |
| Other operating expenses | 670 | 684 | 695 | 710 | 698 | 681 | 781 | 361 | 2,844 | 2,436 |
| Total operating expenses | 1,524 | 1,389 | 1,637 | 1,437 | 1,718 | 1,391 | 1,613 | 1,386 | 6,462 | 5,603 |
| Operating profit before tax on financial services |
1,496 | 1,169 | 2,347 | 1,566 | 2,142 | 1,558 | 2,688 | 2,777 | 8,672 | 7,070 |
| Less: Tax on financial services | 335 | 224 | 449 | 324 | 620 | 301 | 683 | 451 | 2,087 | 1,300 |
| Operating profit before income tax | 1,161 | 945 | 1,898 | 1,242 | 1,522 | 1,257 | 2,005 | 2,326 | 6,585 | 5,770 |
| Less: Income tax expense | 341 | 259 | 552 | 340 | 547 | 342 | 729 | 520 | 2,169 | 1,461 |
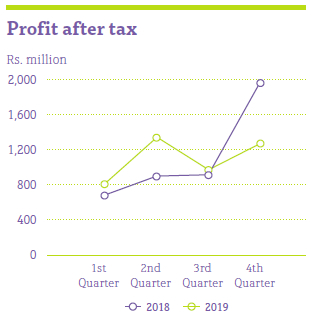
| Profit for the period | 820 | 686 | 1,346 | 902 | 975 | 915 | 1,276 | 1,806 | 4,416 | 4,309 |
Company presented the first three Interim Financial Statements for 2019 based on LKAS 39 availing the option granted by CA Sri Lanka. Accordingly the cumulative impact for 2019 from the application of SLFRS 9 has been adjusted in the fourth quarter.
Appropriate classifications were taken place, which may differ with quarterly published Interim Financial Statements.
Statement of Financial Position
| Company | ||||||||
| 1st Quarter As at 30 June |
2nd Quarter As at 30 September |
3rd Quarter As at 31 December |
4th Quarter As at 31 March |
|||||
| Rs. million | 2018 | 2017 | 2018 | 2017 | 2018 | 2017 | 2019 | 2018 |
| Assets | ||||||||
| Cash and cash equivalents | 2,180 | 4,541 | 2,529 | 3,682 | 3,002 | 3,908 | 3,294 | 4,413 |
| Balances with banks and financial institutions | 3,016 | 2,755 | 3,076 | 3,476 | 3,157 | 4,079 | 3,405 | 4,371 |
| Financial assets -Fair value through profit or loss/Held-for-trading | 166 | 238 | 105 | 188 | 27 | 174 | 23 | 175 |
| Loans and receivables | 144,107 | 133,661 | 149,221 | 134,886 | 154,522 | 137,368 | 151,707 | 140,165 |
| Financial assets – Fair value through other comprehensive income/Available-for-sale | 197 | 294 | 150 | 277 | 157 | 208 | 126 | 219 |
| Debt Instrument at amortised cost/ Held to maturity |
6,959 | 3,992 | 6,883 | 5,177 | 7,041 | 4,787 | 8,003 | 4,890 |
| Current tax receivables | – | – | – | – | – | – | – | 90 |
| Investments in subsidiaries | 3,214 | 2,075 | 3,214 | 2,075 | 3,214 | 3,214 | 3,214 | 3,214 |
| Investments in associate | 586 | 586 | 586 | 586 | 586 | 586 | 238 | 586 |
| Investment property | – | 101 | – | 101 | – | 101 | – | 134 |
| Property, plant and equipment | 1,146 | 1,247 | 1,078 | 1,208 | 1,122 | 1,199 | 1,098 | 1,167 |
| Goodwill and intangible assets | 345 | 336 | 342 | 333 | 316 | 340 | 325 | 346 |
| Leasehold property | 86 | 89 | 86 | 89 | 85 | 88 | 84 | 87 |
| Other assets | 854 | 915 | 981 | 962 | 1,070 | 947 | 1,024 | 834 |
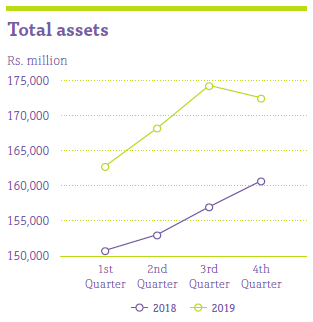
| Total assets | 162,856 | 150,830 | 168,251 | 153,040 | 174,299 | 156,999 | 172,541 | 160,691 |
| Liabilities | ||||||||
| Due to banks | 25,222 | 33,363 | 29,549 | 28,437 | 33,998 | 27,155 | 27,274 | 39,922 |
| Due to customers | 70,106 | 48,202 | 71,518 | 58,543 | 74,205 | 65,110 | 88,369 | 69,763 |
| Debt securities issued | 32,216 | 36,767 | 30,599 | 33,442 | 28,793 | 32,196 | 21,275 | 15,784 |
| Other financial liabilities | 3,890 | 3,704 | 3,673 | 3,380 | 3,852 | 3,553 | 2,480 | 4,646 |
| Current tax liabilities | 49 | 309 | 308 | 263 | 589 | 239 | 2,238 | – |
| Deferred tax liabilities | 2,276 | 1,923 | 2,276 | 1,797 | 2,276 | 1,797 | 837 | 2,276 |
| Other liabilities | 2,066 | 1,961 | 1,992 | 1,692 | 2,446 | 1,722 | 1,465 | 1,270 |
| Total liabilities | 135,825 | 126,229 | 139,915 | 127,554 | 146,159 | 131,772 | 143,938 | 133,661 |
| Equity | ||||||||
| Stated capital | 13,236 | 13,236 | 13,236 | 13,236 | 13,236 | 13,236 | 13,236 | 13,236 |
| Statutory reserve fund | 1,876 | 1,656 | 1,938 | 1,701 | 1,986 | 1,747 | 2,058 | 1,838 |
| Retained earnings | 11,493 | 9,262 | 13,190 | 10,118 | 12,932 | 9,801 | 13,362 | 11,502 |
| Other reserves | 426 | 447 | (28) | 431 | (14) | 443 | (53) | 454 |
| Total equity | 27,031 | 24,601 | 28,336 | 25,486 | 28,140 | 25,227 | 28,603 | 27,030 |
| Total liabilities and equity | 162,856 | 150,830 | 168,251 | 153,040 | 174,299 | 156,999 | 172,541 | 160,691 |