7
Staying on course
Evaluating our performance


Managing capital
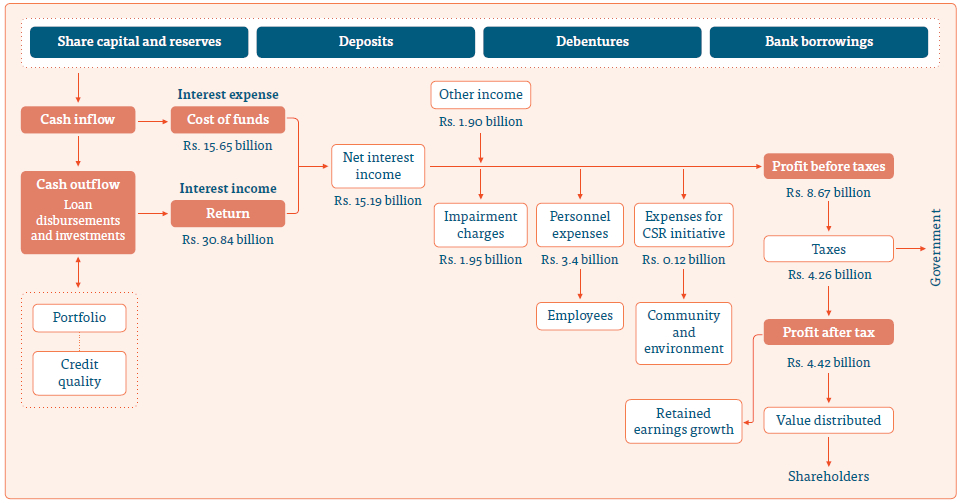
Being a financial services provider and as a result of the role it played in the establishment and perpetuation of the business, financial capital is a dominant input for our value creation process.
On one hand, we need to generate a return on equity acceptable to the shareholders which can only be done by operating at higher levels of gearing since the return on assets in our industry is inherently lower. On the other hand, given the stewardship role we play, we need to be accountable to the customers whose deposits are used for lending. The underlying activities of financial intermediation and maturity transformation elevate our risk profile compared to players in other industries. As a result, we are subject to stringent and mounting capital requirements, making our operations a capital-intensive business.
In the context, we are cognisant of the need to prudently manage the available capital while balancing the risks undertaken and the returns generated and creating leeway for expansion and growth in the future. We also acknowledge that funding and liquidity is no less important than capital for our sustainability. As a 75% owned subsidiary of the People’s Bank, the second largest commercial bank in the country, People’s Leasing financial stability and strength need not be overemphasised. Besides a loyal following of shareholders, we have been able to augment our capital over the years through the profitable operation and the prudent dividend policy.
Leveraging the shareholders’ funds of Rs. 27.03 billion, People’s Leasing has been able to mobilise deposits to the tune of Rs. 69.76 billion and resort to borrowings of further Rs. 55.71 billion, thereby funding a total asset base of Rs. 160.69 billion as at 1 April 2018 with an on-balance sheet gearing of 4.64 times. Corresponding figures as at 31 March 2019 were Rs. 28.60 billion and Rs. 88.37 billion and Rs. 48.55 billion respectively with an on-balance sheet gearing of 4.79 times. This is a reflection of our stability, robustness of our financial intermediation and the financial value we have been able to create in the process.
Summary of our performance
Despite the challenging and complex operating environment, People’s Leasing successfully completed the financial year 2018/19 recording its highest ever profit after tax of Rs. 4,416.12 million. This profit was achieved even after accounting for
the newly introduced Debt Repayment Levy which resulted an unbudgeted expense of Rs. 436.97 million and the additional impairment charge of
Rs. 348.79 million made for the Company’s investment in People’s Merchant Finance. Political uncertainty coupled with various policy measures taken to curtail vehicle importation resulted lower level of client activity in our leasing business. However, we saw our loan portfolio growing at a faster rate permitting us to secure the largest loans and receivables portfolio in the non-banking financial institutions sector as of the financial year-end. Headline interest income surpassed Rs. 30 billion mark and reached Rs. 30,836.30 million while reflecting 15.47% increment over the interest income recorded in the previous financial year.
Our balance sheet remained strong with the second largest asset base in the NBFI sector of Rs. 172,541.28 million up by 7.37% compared to the last year. Net assets value per share improved to Rs. 18.10 from Rs. 17.11 as at 31 March 2018 demonstrating our commitment to deliver long-term value to our shareholders.
A detailed analysis of our financial performance during the year under review follows:
Statement of profit or loss
| Company | Group | |||||
| For the year ended 31 March | 2019 Rs. ’000 | 2018 Rs. ’000 | Change % | 2019 Rs. ’000 | 2018 Rs. ’000 | Change % |
| Gross income | 32,735,639 | 28,603,037 | 14.45 | 38,356,205 | 33,144,417 | 15.72 |
| Interest income | 30,836,300 | 26,704,635 | 15.47 | 32,234,340 | 27,582,045 | 16.87 |
| Less: interest expense | 15,646,099 | 14,500,158 | 7.90 | 15,891,298 | 14,626,672 | 8.65 |
| Net interest income | 15,190,201 | 12,204,477 | 24.46 | 16,343,042 | 12,955,373 | 26.15 |
| Net earned premium | – | – | – | 4,728,573 | 4,053,270 | 16.66 |
| Fee and commission income | 1,508,952 | 1,378,361 | 9.47 | 1,004,297 | 819,727 | 22.52 |
| Net gains/(losses) on financial assets – FVTPL/Held for trading | (27,887) | 18,987 | (246.87) | (44,351) | 59,910 | (174.03) |
| Net gains/( losses) from derecognision of financial assets | – | – | – | – | – | – |
| Other operating income | 418,274 | 501,054 | (16.52) | 433,346 | 629,465 | (31.16) |
| Total operating income | 17,089,540 | 14,102,879 | 21.18 | 22,464,907 | 18,517,745 | 21.32 |
| Less: impairment charges for loans and receivables and other losses | 1,586,506 | 1,429,971 | 10.95 | 1,708,203 | 1,470,062 | 16.20 |
| Impairment charges for investment in associate | 348,794 | – | 100.00 | 152,572 | – | 100.00 |
| Impairment charges for goodwill | 19,580 | – | 100.00 | 19,580 | – | 100.00 |
| Net operating income | 15,134,660 | 12,672,908 | 19.43 | 20,584,552 | 17,047,683 | 20.75 |
| Less: expenses | ||||||
| Personnel expenses | 3,438,167 | 2,974,253 | 15.60 | 4,166,618 | 3,391,640 | 22.85 |
| Depreciation and amortisation | 179,607 | 192,506 | (6.70) | 302,360 | 294,235 | 2.76 |
| Benefits, claims and underwriting expenditure | – | – | – | 3,328,705 | 2,776,132 | 19.90 |
| Other operating expenses | 2,844,419 | 2,436,355 | 16.75 | 3,048,420 | 2,543,486 | 19.85 |
| Total operating expenses | 6,462,193 | 5,603,114 | 15.33 | 10,846,103 | 9,005,493 | 20.44 |
| Operating profit before taxes on financial services | 8,672,467 | 7,069,794 | 22.67 | 9,738,449 | 8,042,190 | 21.09 |
| Less: tax on financial services | 2,087,210 | 1,300,122 | 60.54 | 2,117,910 | 1,326,916 | 59.61 |
| Operating profit after taxes on financial services | 6,585,257 | 5,769,672 | 14.14 | 7,620,539 | 6,715,274 | 13.48 |
| Share of profit/(loss) of an associate (net of tax) | – | – | – | (33,234) | (52,942) | 37.23 |
| Profit before income tax expense | 6,585,257 | 5,769,672 | 14.14 | 7,587,305 | 6,662,332 | 13.88 |
| Less: income tax expense | 2,169,136 | 1,460,342 | 48.54 | 2,576,037 | 1,644,619 | 56.63 |
| Profit for the year | 4,416,121 | 4,309,330 | 2.48 | 5,011,268 | 5,017,713 | (0.13) |
| Profit attributable to – | ||||||
| Equity holders of the Company | 4,416,121 | 4,309,330 | 2.48 | 4,813,578 | 4,816,920 | (0.07) |
| Non-controlling interest | – | – | – | 197,690 | 200,793 | (1.55) |
| Profit for the year | 4,416,121 | 4,309,330 | 2.48 | 5,011,268 | 5,017,713 | (0.13) |
| Basic/Diluted earnings per ordinary share (Rs.) | 2.80 | 2.73 | 2.56 | 3.05 | 3.05 | – |
| Dividend per ordinary share (Rs.) | 1.25 | 1.25 | – | |||
Statement of financial position
| Company | Group | |||||
| As at 31 March | 2019 Rs. ’000 | 2018 Rs. ’000 | Change % | 2019 Rs. ’000 | 2018 Rs. ’000 | Change % |
| Assets | ||||||
| Cash and cash equivalents | 3,294,055 | 4,412,683 | (25.35) | 4,310,595 | 4,765,518 | (9.55) |
| Balances with banks and financial institutions | 3,404,533 | 4,370,473 | (22.10) | 7,375,423 | 8,758,715 | (15.79) |
| Financial assets – Fair value through profit or loss/Held for trading | 23,190 | 174,736 | (86.73) | 72,386 | 315,485 | (77.06) |
| Loans and receivables | 151,707,902 | 140,165,437 | 8.23 | 156,955,837 | 141,915,077 | 10.60 |
| Insurance and reinsurance receivables | – | – | – | 885,395 | 406,687 | 117.71 |
| Financial assets – Fair value other comprehensive income/Available for sale | 125,651 | 219,132 | (42.66) | 125,651 | 219,132 | (42.66) |
| Debt instrument at amortised cost/Held to maturity | 8,002,625 | 4,889,641 | 63.66 | 9,091,945 | 6,013,963 | 51.18 |
| Current tax receivables | – | 89,849 | (100.00) | – | 89,849 | (100.00) |
| Investments in subsidiaries | 3,213,788 | 3,213,788 | – | – | – | – |
| Investments in associate | 237,633 | 586,427 | (59.48) | 237,633 | 423,439 | (43.88) |
| Investment property | – | 134,400 | (100.00) | 1,131,596 | 1,265,996 | (10.62) |
| Property, plant and equipment | 1,098,286 | 1,166,883 | (5.88) | 4,017,301 | 4,112,715 | (2.32) |
| Goodwill and intangible assets | 324,905 | 346,395 | (6.20) | 432,340 | 452,883 | (4.54) |
| Leasehold property | 84,065 | 87,131 | (3.52) | 84,065 | 87,131 | (3.52) |
| Deferred tax assets | – | – | – | 47,584 | 28,155 | 69.01 |
| Other assets | 1,024,644 | 833,619 | 22.92 | 1,164,884 | 1,301,155 | (10.47) |
| Total assets | 172,541,277 | 160,690,594 | 7.37 | 185,932,635 | 170,155,900 | 9.27 |
| Liabilities | ||||||
| Due to banks | 27,273,933 | 39,921,789 | (31.68) | 30,475,326 | 41,834,394 | (27.15) |
| Due to customers | 88,368,656 | 69,763,219 | 26.67 | 88,923,196 | 69,377,794 | 28.17 |
| Debt securities issued | 21,275,031 | 15,783,502 | 34.79 | 21,134,040 | 15,783,502 | 33.90 |
| Other financial liabilities | 2,480,377 | 4,645,818 | (46.61) | 2,464,936 | 4,473,552 | (44.90) |
| Insurance liabilities and reinsurance payable | – | – | – | 4,880,873 | 4,054,586 | 20.38 |
| Current tax liabilities | 2,238,257 | – | 100.00 | 2,323,647 | 62,673 | 3,607.57 |
| Deferred tax liabilities | 837,179 | 2,275,868 | (63.21) | 1,141,973 | 2,338,807 | (51.17) |
| Other liabilities | 1,464,489 | 1,270,576 | 15.26 | 1,606,686 | 1,376,451 | 16.73 |
| Total liabilities | 143,937,922 | 133,660,772 | 7.69 | 152,950,677 | 139,301,759 | 9.80 |
| Equity | ||||||
| Stated capital | 13,236,073 | 13,236,073 | – | 13,236,073 | 13,236,073 | – |
| Statutory reserve fund | 2,058,219 | 1,837,413 | 12.02 | 2,070,667 | 1,837,413 | 12.69 |
| Retained earnings | 13,361,805 | 11,502,165 | 16.17 | 15,198,424 | 13,167,172 | 15.43 |
| Other reserves | (52,742) | 454,171 | (111.61) | 207,274 | 448,413 | (53.78) |
| Total equity attributable to equity holders of the Company | 28,603,355 | 27,029,822 | 5.82 | 30,712,438 | 28,689,071 | 7.05 |
| Non-controlling interest | – | – | – | 2,269,520 | 2,165,070 | 4.82 |
| Total equity | 28,603,355 | 27,029,822 | 5.82 | 32,981,958 | 30,854,141 | 6.90 |
| Total liabilities and equity | 172,541,277 | 160,690,594 | 7.37 | 185,932,635 | 170,155,900 | 9.27 |
| Contingent liabilities and commitments | 7,775,864 | 7,470,875 | 4.08 | 7,788,708 | 7,623,364 | 2.17 |
| Net asset value per ordinary share (Rs.) | 18.10 | 17.11 | 5.82 | 20.88 | 19.53 | 6.90 |
Net interest income
Our top line interest income evidenced a significant year on year growth of 15.47%. Both the average portfolio return which improved from 18.78% in the previous financial year to 20.44% and the average volume of interest-earning assets which increased from Rs. 145,609.06 million in the previous year to Rs. 156,537.20 million in the year under review contributed to this growth.
Interest income generated from the loans and receivables which accounted for 96.76% of the total interest income reflected 15.88% improvement over the interest income recorded in the preceding financial year.
Whilst achieving a significant improvement in interest income, we managed to curtail the growth in interest expenses to 7.90%. Despite the growth in average interest-bearing liabilities from Rs. 122,224.37 million in the previous year to Rs. 131,193.07 million in the current year, the Company’s focus on expanding low cost deposit base against the short-term variable rate bank borrowings limited the growth in the average interest rate on interest-bearing liabilities to 11.93%.
Analysis of growth in interest income
| 2018/19 over 2017/18 | |||
| 2018/19 | 2017/18 | Growth
% |
|
|
|
|||
| Loans and receivables | 145,936.67 | 137,110.07 | 6.44 |
| Other interest earning assets | 10,600.53 | 8,498.99 | 24.73 |
| Total | 156,537.20 | 145,609.06 | 7.51 |
|
|
2,004.21 | ||
|
|
|||
| Loans and receivables | 20.44 | 18.78 | 1.67 |
| Other interest earning assets | 9.44 | 11.28 | (1.84) |
| Total | 19.70 | 18.34 | 1.36 |
|
of interest on the above (Rs. million) |
2,127.45 | ||
|
the last year (Rs. million) |
4,131.67 | ||
Analysis of growth in interest expense
| 2018/19 over 2017/18 | |||
| 2018/19 | 2017/18 | Growth
% |
|
|
|
|||
| Due to customers | 79,065.94 | 57,242.89 | 38.12 |
| Bank borrowings | 33,597.86 | 37,753.10 | -11.01 |
| Other interest-bearing liabilities | 18,529.27 | 27,228.39 | -31.95 |
| Total | 131,193.07 | 122,224.37 | 7.34 |
|
|
1,064.01 | ||
|
|
|||
| Due to customers | 10.98 | 12.16 | (1.18) |
| Bank borrowings | 13.60 | 13.37 | 0.23 |
| Other interest-bearing liabilities | 12.92 | 9.15 | 3.77 |
| Total | 11.93 | 11.86 | 0.06 |
|
|
81.94 | ||
|
|
1,145.94 | ||
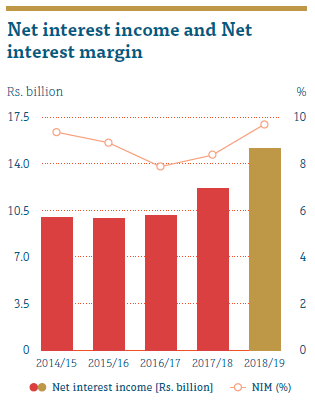
Growth in interest income by 15.47% while curtailing the growth in interest expense to 7.90% and the consequent improvement in the net interest margin (NIM) to 9.70% against 8.36% in 2017/18 contributed to the growth in net interest income of 24.46% to Rs. 15,190.20 million.
Expense management
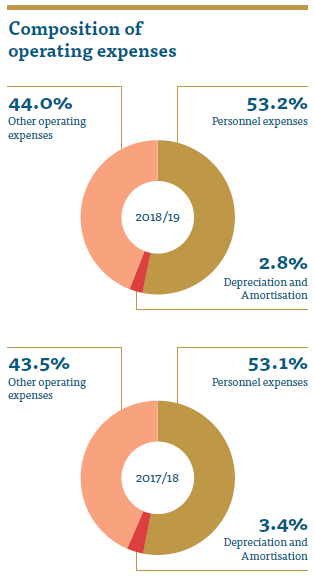
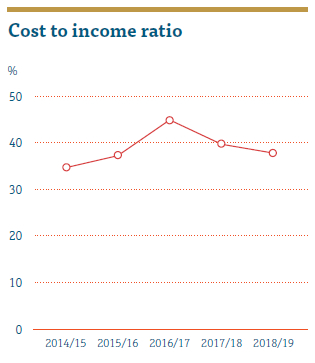
Under a subdued business setting, the Company continued with the consolidation of operations as against the expansion as in previous year to curb any significant improvement in operational expenses. Operating expenses which mainly comprises personnel expenses and other operating expenses grew by 15.33% compared to the last year. However, growth in overall operating expenses to Rs. 6,462.19 million was below the total operating income growth of 21.18% resulting in an improved cost to income ratio of 37.81% compared to 39.73% in financial year 2017/18.
Responsible tax payer
As a responsible corporate citizen, People’s Leasing has been paying all corporate taxes in a timely manner. Income tax expense for the year under review amounted to Rs. 2,169.14 million resulting in an effective tax rate of 32.94%. As per the Finance Act No. 35 of 2018 certified on 1 November 2018, the Government introduced a Debt Repayment Levy effective from 1 October 2018 to 31 December 2021 at the rate of 7% on the value addition attributable to the supply of financial services. Accordingly, the Company paid Rs. 436.97 million as debt repayment levy which was not initially budgeted by the Company. As a result, tax on financial services revealed a significant increase of 60.54% over the tax on financial services in 2017/18.
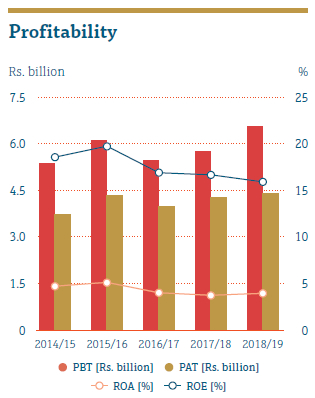
Profitability – PAT and PBT
Amidst a challenging economic and regulatory environment, we recorded the highest ever profit before and after tax up to date of Rs. 6,585.26 million and Rs. 4,416.12 million respectively. This growth was mainly supported by the growth in top line interest income and effective management of interest margins.
Return on Assets (ROA) for the year improved to 3.95% compared to 3.71% recorded in the financial year 2017/18. However, Return on Equity (ROE) for the year amounted to 15.88% reflecting a marginal decrease compared to the preceding year given that the average equity grew at 7.55% compared to growth in profit by 2.48% only.
Impairment charges and asset quality
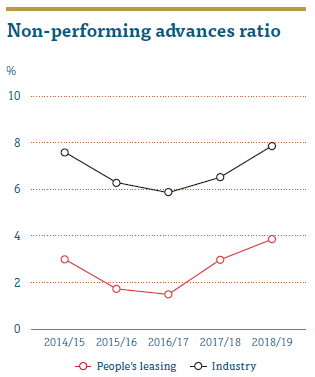
During the year under review, our asset quality was under pressure given difficulties faced by customers with the slowdown in economic activities. Against this backdrop, our non-performing advances (NPA) ratio increased to 3.91% as of year end from 2.70% in March 2018, but it still remained well below the industry average ratio of 7.7%.
Given the waning recoveries, impairment charges on loans and receivables including disposal losses increased to Rs. 1,586.51 million from Rs. 1,429.97 million in the previous financial year. Transition to SLFRS 9 from LKAS 39 also resulted in an additional impairment charge of Rs. 895.46 million. More details of the transition is presented in Note 4 to the Financial Statements: Transition Disclosure.
Pursuant to the capital infusion to People’s Merchant Finance PLC (PMF) by way of a private placement and a rights issue the Company’s Investment in PMF was diluted from an associate to and ordinary investment. Accordingly we recognised an additional impairment of Rs. 348.79 million for our investment in PMF as a prudent measure.
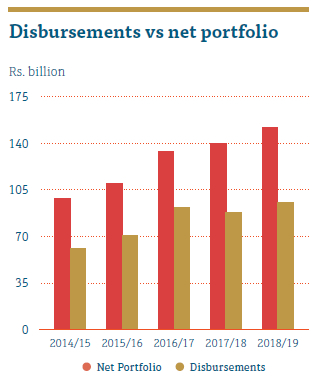
Loans and receivables portfolio
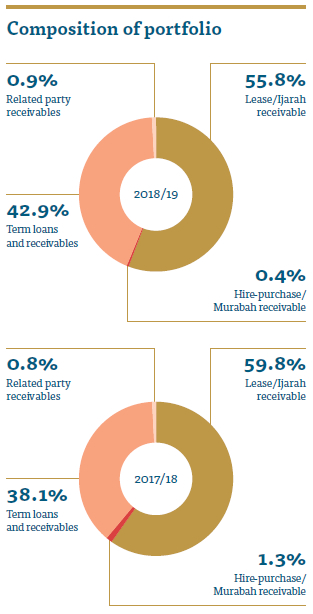
As of the financial year ended 31 March 2019, People’s Leasing owned the largest loans and receivables portfolio of the NBFI sector which amounted to Rs. 151,707.90 million. Portfolio was up by 8.23% compared to the portfolio of Rs. 140,165.44 million as at 31 March 2018 on account of the total disbursement of Rs. 95,282.60 million during the year. (Refer page 85 for more details on disbursements). Given the LTV rules imposed on vehicle financing and the policy measures taken to curb excessive demand for vehicle importation, growth of our lease portfolio was limited to 2.08% over the last year, yet remains as the main contributor to the total gross portfolio with a share of 55.81%. However, gross loans portfolio reflected a significant improvement of 23.23% over the previous year and reached Rs. 67,237.44 million. It was the 60.27% increase in gross motor loans portfolio over the last year that mostly supported the growth of total gross loans portfolio. Gold loans portfolio, the newly added to our product bundle recorded a significant growth of 293.81% over the last year and reached Rs. 240.12 million by the year-end.
Performance of factoring, one of our variable rate products was outstanding during the year with the portfolio growing at 68.45% over the portfolio as at 31 March 2018. However, due to the pessimism that prevailed in the capital market throughout the year under review, our margin trading portfolio witnessed a decline to Rs. 2,066.21 million as at 31 March 2019 from Rs. 2,642.18 million at the previous year-end.
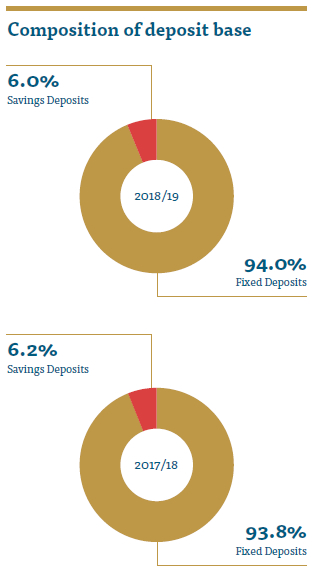
Deposit base
Our deposit base comprises fixed and savings deposits including Islamic deposits mobilised by the Company. Consequent to the shift in funding strategy from reliance on bank borrowings to promoting deposits, our deposit base recorded a robust growth since last financial year permitting us to own the second largest deposit base in the NBFI sector. Total deposit base notched Rs. 88,368.66 million with an increment of 26.67% over the deposit base as at 31 March 2018. With this improvement, deposits now represent 64.54% of our borrowing mix in comparison to 55.60% in last year. However, the Company still encounters with the difficulty in finding deposits with a longer maturity to match with our long-term lending portfolio since the deposit base is more skewed towards maturities between six to twelve months.
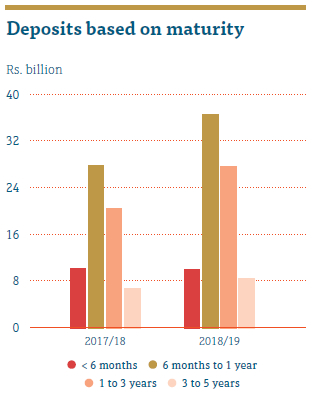
Our savings base topped Rs. 5 billion mark and reached Rs. 5,335.19 million with a significant improvement of 23.08% over the savings base as at 31 March 2018.
Capital and Liquidity
As of 31 March 2019, total equity comprising stated capital, retained earnings and other reserves amounted to Rs. 28,603.36 million up by 5.82% over the last year. On the back of increased profitability, retained earnings triggered a notable improvement even after paying dividends and transfers to reserves. Our Tier 1 and Total Capital Ratios of 14.36% and 15.20% respectively are well ahead of the new capital adequacy requirements set out in the Finance Business Act Direction No.3 of 2018 and are a reflection of a strong financial position.
| 2018/19 | 2017/18 | |
| Tier 1 capital (Rs. million) | 26,517.79 | 26,515.11 |
| Total capital (Rs. million) | 28,065.76 | 23,733.49 |
| Total risk-weighted amount (Rs. million) | 184,632.63 | 144,222.71 |
| Tier I ratio (minimum 6%) (%) | 14.36 | 18.38 |
| Total capital ratio (minimum 10%) (%) | 15.20 | 16.46 |
Proposed final dividend for the financial year 2018/19 of Rs. 0.50 per share in the form of a scrip dividend will not have any negative impact on the total equity of the Company.
Whilst focusing on profitability, we ensure that we adhered with the liquidity requirements of the CBSL by maintaining Rs. 13,192.50 million in liquid assets as at 31 March 2019, leading to a ratio of 108.91%.
Value generated and distributed
Economic value generated by the Company through its operations was distributed among the employees, providers of capital, the Government and the community whilst retaining a part for the expansion and future growth as follows:
Direct economic value generated and distributed
| 2018/19 Rs. million | 2017/18 Rs. million | |
|
|
||
| Interest income | 30,836.30 | 26,704.64 |
| Fee and commission income | 1,508.95 | 1,378.36 |
| Other operating income | 390.39 | 520.04 |
|
|
32,735.64 | 28,603.04 |
|
|
||
|
|
||
| Dividend to equity holders | 1,974.83 | 1,974.83 |
| Interest to borrowings | 6,963.55 | 7,539.88 |
| Interest to deposit holders | 8,682.55 | 6,960.28 |
| 17,620.93 | 16,474.99 | |
|
|
||
| Salaries and other benefits | 3,438.17 | 2,974.25 |
| 3,438.17 | 2,974.25 | |
|
|
||
| Income tax expense | 3,351.43 | 1,101.05 |
| Tax on financial services | 2,087.21 | 1,300.12 |
| Other taxes paid | 46.09 | 40.09 |
| 5,484.73 | 2,441.26 | |
|
|
||
| On corporate social responsibility (CSR) and donations | 122.23 | 103.70 |
| 122.23 | 103.70 | |
|
|
||
| Depreciation and amortisation | 179.61 | 192.51 |
| Impairment charges for loans and receivables and other losses | 1,586.51 | 1,429.97 |
| Impairment charges for investment in associate | 348.79 | – |
| Impairment charges for goodwill | 19.58 | – |
| Other operating expenses | 2,767.48 | 2,384.07 |
| 4,901.97 | 4,006.55 | |
| Economic value distributed | 31,568.03 | 26,000.75 |
| Economic value retained | 1,167.60 | 2,602.30 |
During the financial year 2018/19 no financial assistance was received from the Government.
Economic value added
Economic value added indicates the surplus value created for the shareholders on their investment.
| Economic value added for the year | 2018/19 Rs. million |
2017/18
Rs. million |
| Shareholders' funds | 28,603.36 | 27,029.82 |
| Add – Accumulated provision for impairment charges | 4,944.34 | 3,055.56 |
| Add – Cumulative market building expenses | 885.95 | 880.00 |
| 34,433.65 | 30,965.38 | |
|
|
||
| Shareholders | 4,416.12 | 4,309.33 |
| Add : Market building expenses for the year | 324.81 | 175.37 |
| Add : Impairment provision | 1,954.88 | 1,406.00 |
| Add : Deferred tax charge/(reversal) for the year |
|
359.30 |
|
|
6,250.00 | |
| Economic cost % (average Treasury Bill rate + 2 % risk premium) | 10.73% | 11.74% |
| Economic cost | 3,508.66 | 3,423.76 |
| Economic value addition |
|
2,826.24 |
Market value added
Despite the growth in core business activities and improvements recorded in profitability, given the gloom that existed in the capital market throughout the year and as witnessed in relation to the market prices of majority of the listed entities, share price of the Company declined during the year causing a decrease in market value added as at 31 March 2019 compared to the last year.
| For the year | 2018/19
Rs. million |
2017/18
Rs. million |
| Market capitalisation/market value of equity | 21,170.16 | 24,961.83 |
| Less: Shareholders' funds | 28,603.36 | 27,029.82 |
| Market value added | (7,433.20) | (2,067.99) |
Group results overview
People’s Leasing Group reported a profit before and after tax of Rs. 7,587.31 million and Rs. 5,011.27 million respectively for the financial year ended 31 March 2019. Despite the increase in tax on financial services specially with the introduction of new debt repayment levy, increasing operating expenses and rise in impairment charges, the Group recorded a 13.88% improvement in profit before tax compared to the last financial year. Snapshot of the performance of each subsidiary is given in our online report.
Key Financial Indicators – People’s Leasing Group
| 2018/19 | 2017/18 | |
|
|
||
| Return on assets (%) | 4.26 | 4.07 |
| Return on equity (%) | 16.21 | 17.67 |
| Earnings per share (Rs.) | 3.05 | 3.05 |
| Net assets value per share (Rs.) | 19.44 | 18.16 |