10
Supplementary reports
Investor relations


Through the sustainable growth of People’s Leasing our investors expect optimal returns on their investment. To maintain their long-term trust and confidence in us, we make every effort to present them with a timely, relevant, and balanced view of the Company’s operational results, financial position, and cash flows.
Significance of Investors in value creation process
Shareholders and holders of debt instruments issued by the Company make up our investor portfolio. The capital they infused at the commencement of operations and, subsequently, for the Company’s expansion, has been invaluable, contributing to the manufacturing capital we need to create value. Such funding also provides a buffer against any unforeseen losses that may arise from our operations as we meet all necessary regulatory requirements relating to capital. Investors in debt instruments issued by the Company have provided funds for operational expansion.
In return, the responsibility we take very seriously is that of creating satisfactory returns on the capital invested. In meeting and exceeding our investors’ expectations, we strive for the optimum risk – return trade-off, achievable only by maintaining a high standard of performance that ensures sustainable value creation underpinned by a sound system of corporate governance and risk management. Our success in meeting this goal is evidenced by our growth, results, and the perfect track record of compliance.
While striving to maintain the rights conferred on our investors by various statutes, we also make every effort to maintain effective two-way communication with them and to ensure that they are able to make informed decisions.
Overcoming challenges
We operated within a challenging environment during the year under review as detailed in our Operating Environment on pages 62 and 63. It was a year that impacted not only our own business and the financial industry but also the stock market. The ASPI and S&P SL20 declined by 14.20% and 24.96%, respectively, contributing to a deterioration of our own share price which traded at a discount of 0.74 to book value as at end March 2019. Despite this decline, our share price remained one of the highest in the NBFI sector, speaking to the effective communication of not just our current performance but also our future prospects.
Share Market Performance
| Overall market | Banks, finance and insurance | |||
| 2019 | 2018 | 2019 | 2018 | |
| All share price index | 5,557.24 | 6,476.78 | N/A | N/A |
| S&P SL20 index | 2,738.95 | 3,650.10 | N/A | N/A |
| Market capitalisation (Rs. billion) | 2,605.90 | 3,032.71 | 706.74 | 809.70 |
| Foreign inflows (Rs. billion) | 62.65 | 131.83 | 24.26 | 40.71 |
| Foreign outflows (Rs. billion) | 89.36 | 129.38 | 20.53 | 36.37 |
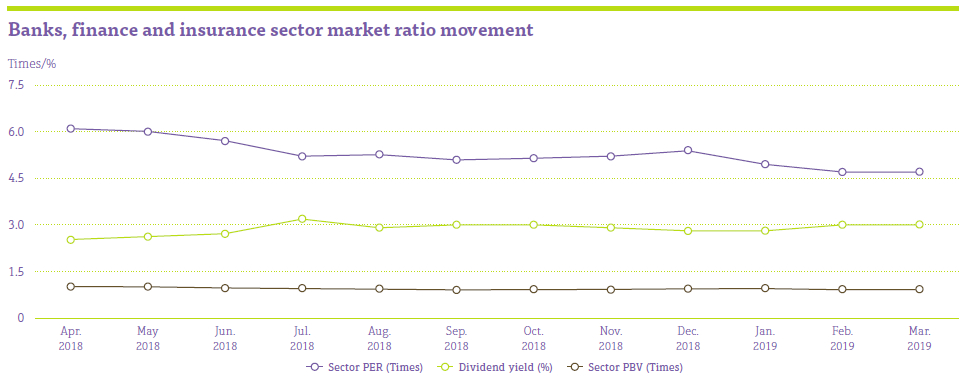
| Price earnings ratio (Times) | 8.72 | 11.19 | 4.68 | 6.87 |
| Price to book value (Times) | 1.10 | 1.35 | 0.88 | 1.07 |
| Dividend yield (%) | 3.56 | 2.91 | 3.00 | 2.50 |
With a public holding (free float) of 24.96% in voting shares against the regulatory minimum of 7.5%, the Company’s shares are actively traded in the CSE, and investors are provided with a convenient “enter and exit” mechanism.
Recording moderate growth against this backdrop, the NBFI sector also saw its profitability negatively impacted by deteriorating asset quality and increasing impairment charges and with the implication of debt repayment levy. In spite of this situation, the sector maintained its overall capital and liquidity levels well above the minimum requirements. With measures to strengthen the financial sector’s supervisory and regulatory framework continuing, the sector’s safety and resilience were further enhanced during the year.
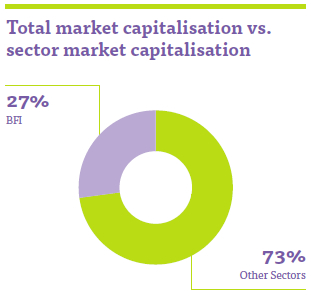
As at end March 2019, total market capitalisation had declined from Rs. 3,032.71 billion at the end of March 2018 to Rs. 2,605.90 billion reflecting a 14.07% decrease. The sector market capitalisation similarly decreased over the same period.
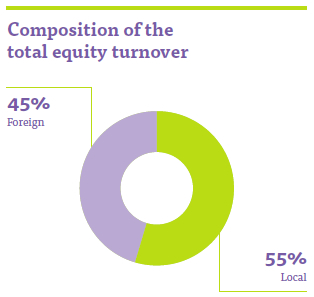
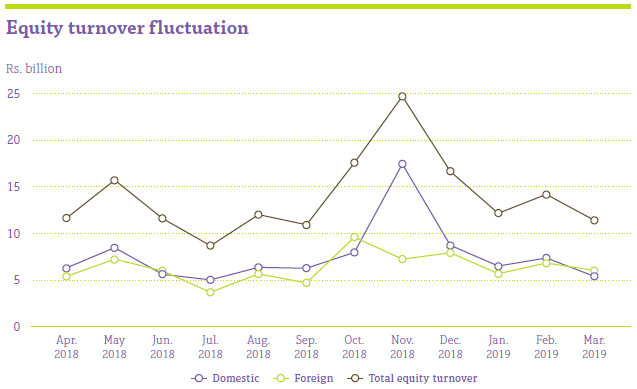
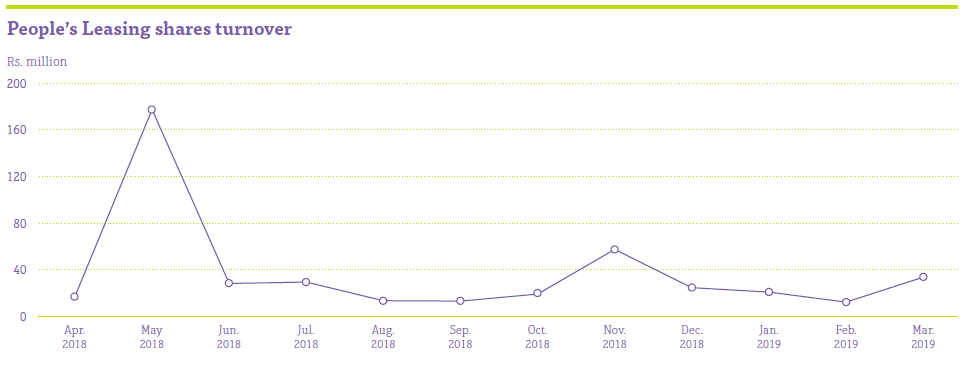
Equity turnover fluctuated throughout the year with total equity and foreign equity turnover reaching the highest levels in November 2018.
Compliance report on the contents of Annual Report in terms of the Listing Rules of the CSE
The Company has fully complied with all applicable requirements of Section 7.6 of the Listing Rules of the CSE on the contents of the Annual Report and Accounts of a listed entity. Please refer table on page 59 for references to the relevant sections of this Annual Report where specific information is disclosed together with the relevant page numbers.
Methods of communication with this important stakeholder group include:

While the total market dividend yield increased to 3.56%, market PE and PBV ratios show a decline over the year.
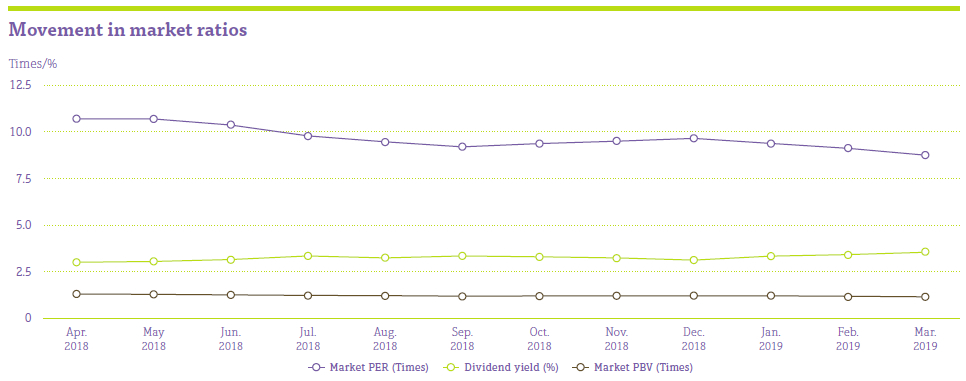
The Bank, Finance and Insurance sector dividend yield also increased slightly reflecting the same trend in total market yield.
People’s Leasing financial performance
| For the finance year | 2019 | 2018 | % Change |
| Earnings per share – Group (Rs.) | 3.05 | 3.05 | – |
| Dividend per share (Rs.) | 1.25 | 1.25 | – |
| Dividend payout (%) | 44.72 | 45.83 | (1.11) |
| Dividend yield (%) | 9.33 | 7.91 | 1.42 |
| Dividend cover(times) | 2.24 | 2.18 | 2.48 |
| Net asset value per share (Rs.) | 18.10 | 17.11 | 5.82 |
| Price earning (times) | 4.79 | 5.18 | 17.24 |
| Price to book value (times) | 0.74 | 0.92 | (19.86) |
| Return on equity (%) | 15.88 | 16.66 | (0.79) |
| Earning growth (%) | 2.56 | 7.48 | (4.92) |
People’s Leasing share
The ordinary shares issued by People’s Leasing are listed on the CSE and the code of shares is “PLC.N000”.
Audited Financial Statements are required to be submitted within three months from the reporting date. In compliance with this requirement, the Financial Statements for the year ended 31 March 2019 are included in this report.
People’s Leasing share trading
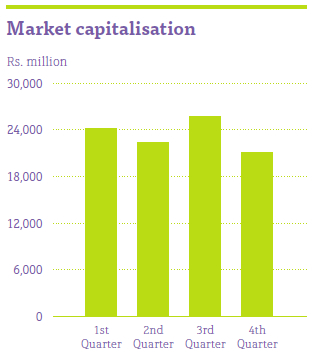
People’s Leasing market capitalisation has decreased over the year reflecting the same trend pattern of the total market capitalisation.
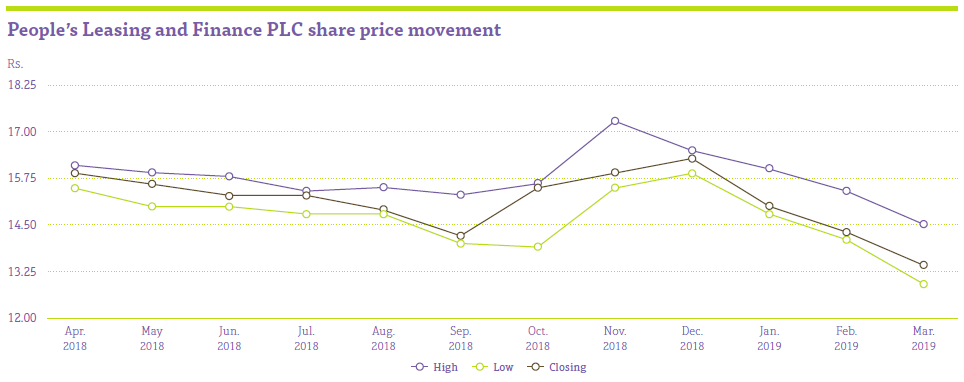
Market value of People’s Leasing as at 31 March 2019 is Rs. 13.40, showing a decline compared to the price as at 31 March 2018 which was Rs. 15.80. However in November 2018 the share recorded the highest market price of Rs. 17.30.
Share information
| 2018/19 | Q4 | Q3 | Q2 | Q1 | 2017/18 | |
| Share price (Rs.) | ||||||
| Highest | 17.30 | 16.00 | 17.30 | 15.50 | 16.10 | 19.20 |
| Lowest | 12.90 | 12.90 | 13.90 | 14.00 | 15.00 | 15.50 |
| Closing | 13.40 | 13.40 | 16.30 | 14.20 | 15.30 | 15.80 |
| Number of transactions | 7,846 | 1,686 | 1,906 | 1,791 | 2,463 | 5,881 |
| Number of shares traded (Nos. million) | 29.25 | 4.78 | 6.33 | 3.75 | 14.39 | 41.57 |
| Turnover (Rs. million) | 448.47 | 67.06 | 101.60 | 56.21 | 223.60 | 729.76 |
| PLC turnover to total market turnover (%) | 0.27 | 0.18 | 0.17 | 0.18 | 0.57 | 0.30 |
| Number of days traded | 240 | 58 | 61 | 62 | 59 | 237 |
| Average daily turnover (Rs. million) | 1.87 | 1.16 | 1.67 | 0.91 | 3.79 | 3.08 |
| Market capitalisation – CSE (MC) (Rs. billion) | 2,605.90 | 2,605.90 | 2,839.45 | 2,752.86 | 2,893.76 | 3,032.71 |
| Market capitalisation – PLC (MC)(Rs. billion) | 21.17 | 21.17 | 25.75 | 22.43 | 24.17 | 24.96 |
| PLC MC to CSE MC (%) | 0.81 | 0.81 | 0.91 | 0.81 | 0.84 | 0.82 |
| Market turnover (Rs. million) | 167,419.60 | 37,755.59 | 59,081.58 | 31,592.61 | 38,989.83 | 245,435.16 |
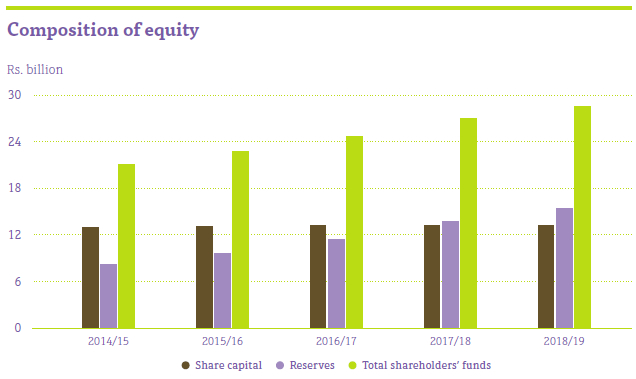
Share capital
The Share capital of the Company remained the same as the previous year amounting to Rs. 13.23 billion.
During the year under review, the total number of ordinary shares stood the same at 1,579,862,482. In line with the increase in reserves, total equity grew to Rs. 28.60 billion against Rs. 27.03 billion recorded in the preceding year.
Information on movement in number of shares represented by stated capital
| Number of shares at the beginning of the financial year |
Addition/(redemption) of shares during the financial year |
Cumulative shares at the end of the financial year |
Issued capital at the end of the financial year (Rs.) |
||||
| Ordinary shares | Preference shares | Ordinary shares | Preference shares | Ordinary shares | Preference shares | ||
| 1995/96 | 2 | – | – | – | 2 | – | 20 |
| 1996/97 | 2 | – | – | – | 2 | – | 20 |
| 1997/98 | 2 | – | 2,500,000 | – | 2,500,002 | – | 25,000,020 |
| 1998/99 | 2,500,002 | – | – | – | 2,500,002 | – | 25,000,020 |
| 1999/00 | 2,500,002 | – | 1,500,000 | – | 4,000,002 | – | 40,000,020 |
| 2000/01 | 4,000,002 | – | 2,000,006 | – | 6,000,008 | – | 60,000,080 |
| 2001/02 | 6,000,008 | – | 4,000,000 | – | 10,000,008 | – | 100,000,080 |
| 2002/03 | 10,000,008 | – | – | – | 10,000,008 | – | 100,000,080 |
| 2003/04 | 10,000,008 | – | 10,000,000 | 50,000,000 | 20,000,008 | 50,000,000 | 700,000,080 |
| 2004/05 | 20,000,008 | 50,000,000 | – | – | 20,000,008 | 50,000,000 | 700,000,080 |
| 2005/06 | 20,000,008 | 50,000,000 | 30,000,000 | – | 50,000,008 | 50,000,000 | 1,000,000,080 |
| 2006/07 | 50,000,008 | 50,000,000 | – | -5,000,000 | 50,000,008 | 45,000,000 | 950,000,080 |
| 2007/08 | 50,000,008 | 45,000,000 | – | -10,000,000 | 50,000,008 | 35,000,000 | 850,000,080 |
| 2008/09 | 50,000,008 | 35,000,000 | – | -10,000,000 | 50,000,008 | 125,000,000 | 1,850,000,080 |
| 2009/10 | 50,000,008 | 125,000,000 | – | -10,000,000 | 50,000,008 | 115,000,000 | 1,850,000,080 |
| 2010/11 | 50,000,008 | 115,000,000 | – | -10,000,000 | 50,000,008 | 105,000,000 | 1,850,000,080 |
| 2011/12 | 50,000,008 | 105,000,000 | 1,510,000,152 | -15,000,000 | 1,560,000,160 | 90,000,000 | 12,958,000,800 |
| 2012/13 | 1,560,000,160 | 90,000,000 | – | -20,000,000 | 1,560,000,160 | 70,000,000 | 12,736,073,308 |
| 2013/14 | 1,560,000,160 | 70,000,000 | 19,862,322 | -20,000,000 | 1,579,862,482 | 50,000,000 | 12,736,073,308 |
| 2014/15 | 1,579,862,482 | 50,000,000 | – | -20,000,000 | 1,579,862,482 | 30,000,000 | 12,936,073,308 |
| 2015/16 | 1,579,862,482 | 30,000,000 | – | -20,000,000 | 1,579,862,482 | 10,000,000 | 13,136,073,308 |
| 2016/17 | 1,579,862,482 | 10,000,000 | – | -10,000,000 | 1,579,862,482 | – | 13,236,073,308 |
| 2017/18 | 1,579,862,482 | – | – | – | 1,579,862,482 | – | 13,236,073,308 |
| 2018/19 | 1,579,862,482 | – | – | – | 1,579,862,482 | – | 13,236,073,308 |
Distribution of ordinary shareholders
| Distribution of ordinary shareholders |
31 March 2019 | 31 March 2018 | ||||||
| Number of shareholders |
Shareholder percentage % |
Number of shares |
Share percentage % |
Number of
shareholders |
Shareholder percentage % |
Number of shares |
Share percentage % |
|
| Less than or equal to 1,000 | 4,361 | 48.67 | 2,447,084 | 0.15 | 4,189 | 47.60 | 2,442,250 | 0.15 |
| 1,001 – 10,000 | 3,353 | 37.42 | 13,320,695 | 0.84 | 3,377 | 38.37 | 13,370,358 | 0.85 |
| 10,001 – 100,000 | 1,052 | 11.74 | 32,642,795 | 2.07 | 1,037 | 11.78 | 32,184,556 | 2.04 |
| 100,001 – 1,000,000 | 167 | 1.86 | 48,534,524 | 3.07 | 170 | 1.93 | 51,291,010 | 3.25 |
| Over 1,000,000 | 28 | 0.31 | 1,482,917,384 | 93.86 | 28 | 0.32 | 1,480,574,308 | 93.72 |
| Total | 8,961 | 100.00 | 1,579,862,482 | 100.00 | 8,801 | 100.00 | 1,579,862,482 | 100.00 |
Composition of ordinary shareholders
| Distribution of ordinary shareholders |
31 March 2019 | 31 March 2018 | ||||||
| Number of shareholders |
Shareholder percentage % |
Number of shares |
Share percentage % |
Number of shareholders |
Shareholder percentage % |
Number of shares |
Share percentage % |
|
| Resident – Individuals | 8,615 | 96.14 | 72,066,324 | 4.56 | 8,455 | 96.07 | 72,762,232 | 4.61 |
| Resident – Institutions | 288 | 3.21 | 1,404,791,918 | 88.92 | 291 | 3.31 | 1,406,480,645 | 89.03 |
| Non-resident – Individuals | 48 | 0.54 | 4,823,034 | 0.31 | 46 | 0.52 | 3,862,280 | 0.24 |
| Non-resident – Institutions | 10 | 0.11 | 98,182,206 | 6.21 | 9 | 0.10 | 96,757,325 | 6.12 |
| Total | 8,916 | 100.00 | 1,579,862,482 | 100.00 | 8,801 | 100.00 | 1,579,862,482 | 100.00 |
Public holding
The Company’s public holding stood at 24.96% as at 31 March 2019 and the number of shareholders representing the public holding was 8,953. There was no significant change in the Company’s public holding compared to the previous year.
Twenty largest shareholders
| No. | Name of the shareholder | 31 March 2019 | Comments | 31 March 2018 | ||
| Number of shares |
percentage % |
Number of shares |
percentage % |
|||
| 1. | People’s Bank | 1,184,896,862 | 75.00 | No change | 1,184,896,862 | 75.00 |
| 2. | Employees Provident Fund | 85,748,846 | 5.43 | No change | 85,748,846 | 5.43 |
| 3. | BNYM SANV RE-Neon Liberty Lorikeet Master Fund LP | 73,084,030 | 4.63 | No change | 73,084,030 | 4.63 |
| 4. | National Savings Bank | 43,668,157 | 2.76 | No change | 43,668,157 | 2.76 |
| 5. | Rubber Investment Trust Limited A/C No. 01 | 16,861,361 | 1.07 | 1 Position up | 15,323,883 | 0.97 |
| 6. | Citibank New York S/A Norges Bank Account 2 | 15,775,303 | 1.00 | 1 Position down | 15,775,303 | 1.00 |
| 7. | Bank of Ceylon No. 1 Account | 11,453,600 | 0.72 | No change | 11,453,600 | 0.72 |
| 8. | Sri Lanka Insurance Corporation Ltd. – General Fund | 7,022,962 | 0.44 | No change | 7,022,962 | 0.44 |
| 9. | AIA Insurance Lanka PLC A/C No. 07 | 5,197,515 | 0.33 | No change | 5,197,515 | 0.33 |
| 10. | Ceylon Investments PLC A/C No. 01 | 4,954,891 | 0.31 | No change | 4,954,891 | 0.31 |
| 11. | Union Assurance PLC/No-01A/C | 3,821,672 | 0.24 | No change | 3,821,672 | 0.24 |
| 12. | Ceylon Guardian Investment Trust PLC A/C No. 02 | 3,340,505 | 0.21 | No change | 3,340,505 | 0.21 |
| 13. | Caceis Bank, Luxembourg Branch – TCM Investment Funds Luxembourg |
2,887,743 | 0.18 | No change | 2,887,743 | 0.18 |
| 14. | Hatton National Bank PLC A/C No. 4 (HNB Retirement Pension Fund) |
2,719,743 | 0.17 | No change | 2,719,743 | 0.17 |
| 15. | Employees Trust Fund Board | 2,356,087 | 0.15 | No change | 2,356,087 | 0.15 |
| 16. | Akbar Brothers (Pvt) Ltd. A/C No.1 | 2,004,114 | 0.13 | No change | 1,894,014 | 0.12 |
| 17. | First Capital Limited | 1,700,000 | 0.11 | 1 Position up | 1,700,000 | 0.11 |
| 18. | Pershing LLC S/A Averbach Grauson & CO. | 1,680,000 | 0.11 | New entrant | – | – |
| 19. | Deutsche Bank AG as Trustee for Guardian Acuity Equity Fund | 1,638,092 | 0.10 | 2 Position down | 1,715,000 | 0.11 |
| 20. | Guardian Fund Management Limited/The Aitken Spence and Associated Companies Executive Staff Provident | 1,616,715 | 0.10 | New entrant | – | – |
| Subtotal | 1,472,428,198 | 93.20 | 1,470,746,944 | 93.09 | ||
| Other shareholders | 107,434,284 | 6.80 | 109,115,538 | 6.91 | ||
| Total | 1,579,862,482 | 100.00 | 1,579,862,482 | 100.00 | ||
Directors’ and CEO’s shareholding
| Name | Position | Number of shares as at | |
| 31 March 2019 | 31 March 2018 | ||
| Mr Hemasiri Fernando | Chairman | – | – |
| Mr M P Amirthanayagam | Deputy Chairman | 10,000 | 10,000 |
| Mr J A Fernando | Director | – | – |
| Mr J P Amaratunga | Director | – | – |
| Mr M A M Rizwan | Director | – | – |
| Mr R M Jayasena | Director | – | – |
| Mr G B R P Gunawardana | Director | – | – |
| Mr G H A A Shabbir | Director | – | – |
| Mr N W A M U K K E Weerasinghe | Director | – | – |
| Dr K D Gunawardana | Director | – | – |
| Mr A S Ibrahim | CEO | – | – |
| 10,000 | 10,000 | ||
Solvency and debt capital
| For the financial year | 2018/19 | 2017/18 | Change % |
| Debt to equity ratio excluding deposits (Times) | 1.70 | 2.06 | (17.64) |
| Tier 1 capital/Core capital ratio – % | 14.36 | 18.38 | (4.02) |
| Total capital ratio/Total risk weighted capital ratio – % | 15.20 | 16.46 | (1.26) |
| Interest cover (Times) | 1.42 | 1.40 | 1.64 |
| Current ratio (Times) | 0.82 | 0.80 | 2.69 |
The debt to equity ratio showed a positive 17.64% change as a result of a strategic decision to reduce the Company’s dependency on debt financing and instead concentrate on growing deposits to fund the operations.
Central Bank of Sri Lanka introduced Finance Business Act Directions No. 3 of 2018 Capital Adequacy Requirements with effect from 1 July 2018 and the decrease in ratios are due to the change in methodology of computation which the new direction focus on operational risk aspect as well. However, People’s Leasing maintained well above the regulatory requirements of 6% and 10% according to the aforementioned direction.
This indicates that the Company preserves sufficient capital to act as a cushion against future risks.
Debenture market information with last year
As a financing option People’s Leasing uses debentures to raise funds to boost the operation whilst minimising the maturity mismatch face by the Company. All of the issued debentures are unsecured and are listed on CSE. During the year People’s Leasing issued 6,000 million debentures and as at 31 March 2019 outstanding debenture liability is amounted to Rs. 21,260 million.
2019/20
| Type | Type A | Type B | Type A | Type B | Type C | Type A | Type B |
| Tenure (years) | 4 years | 5 years | 3 years | 4 years | 5 years | 4 years | 5 years |
| Issue date | 15 November | 15 November | 16 November | 16 November | 16 November | 18 April | 18 April |
| Maturity date | 19 November | 20 November | 19 November | 20 November | 21 November | 22 April | 23 April |
| Interest rate | Fixed | Fixed | Fixed | Fixed | Fixed | Fixed | Fixed |
| Coupon rate (%) | 9.60 | 9.95 | 11.90 | 12.25 | 12.60 | 12.40 | 12.80 |
| Effective annual yield (%) | 9.83 | 9.95 | 12.25 | 12.63 | 13.00 | 12.40 | 12.80 |
| Interest rate comparable Government security (%) | 11.07 | 11.62 | 11.07 | 11.62 | 11.37 | 9.79 | 10.68 |
| Frequency of interest payable | Semi-annual | Annual | Semi-annual | Semi-annual | Semi-annual | Annual | Annual |
| Rating | |||||||
| Amount (Rs. million) | 2,176 | 3,824 | 542 | 659 | 6,799 | 705 | 5,295 |
| ISIN No. | LKR0399D23229 | LKR0399D23237 | LKR0399D23732 | LK0399D23740 | LKR0399D23757 | LKR0399D23997 | LKR0399D23989 |
| Market value (Rs.) | |||||||
| Highest | Not-traded | Not-traded | 100.00 | 100.00 | 100.00 | Not-traded | Not-traded |
| Lowest | Not-traded | Not-traded | 100.00 | 100.00 | 100.00 | Not-traded | Not-traded |
| Closing | Not-traded | Not-traded | 100.00 | 100.00 | 100.00 | Not-traded | Not-traded |
| Current yield (%) | 9.60 | 9.95 | 11.90 | 12.25 | 12.60 | 12.40 | 12.80 |
| YTM (%) | 9.60 | 9.95 | 11.90 | 12.25 | 12.61 | 12.40 | 12.80 |
2017/18
| Type | Type B | Type A | Type B | Type A | Type B | Type C |
| Tenure (years) | 4 years | 4 years | 5 years | 3 years | 4 years | 5 years |
| Issue date | 14 September | 15 November | 15 November | 16 November | 16 November | 16 November |
| Maturity date | 18 September | 19 November | 20 November | 19 November | 20 November | 21 November |
| Interest rate | Fixed | Fixed | Fixed | Fixed | Fixed | Fixed |
| Coupon rate (%) | 9.63 | 9.60 | 9.95 | 11.90 | 12.25 | 12.60 |
| Effective annual yield (%) | 9.63 | 9.83 | 9.95 | 12.25 | 12.63 | 13.00 |
| Interest rate comparable Government security (%) | 10.29 | 11.07 | 11.62 | 11.07 | 11.62 | 11.37 |
| Frequency of interest payable | Annual | Semi-annual | Annual | Semi-annual | Semi-annual | Semi-annual |
| Rating | ||||||
| Amount (Rs. million) | 1,200 | 2,176 | 3,824 | 542 | 659 | 6,799 |
| ISIN No. | LK0399D22510 | LKR0399D23229 | LKR0399D23237 | LKR0399D23732 | LK0399D23740 | LKR0399D23757 |
| Market value (Rs.) | ||||||
| Highest | Not-traded | Not-traded | Not-traded | Not-traded | Not-traded | 99.96 |
| Lowest | Not-traded | Not-traded | Not-traded | Not-traded | Not-traded | 99.96 |
| Closing | Not-traded | Not-traded | Not-traded | Not-traded | Not-traded | 99.96 |
| Current yield (%) | 9.27 | 9.60 | 9.95 | 11.90 | 12.25 | 12.60 |
| YTM (%) | 8.36 | 9.60 | 9.95 | 11.90 | 12.25 | 12.61 |