This financial review provides details of the Bank’s financial performance across the year. It is meant to be read in conjunction with the Operating Context and Outlook , which explains the broader global, local, and sector trends that contextualise the Bank’s performance, and the Management Discussion and Analysis , which analyses how the Bank grew its financial and other capitals in relation to its strategic imperatives. (Refer Business Model for Sustainable Value Creation ).
Performance of the Bank
An overview
Total assets of the Bank grew by Rs. 212.995 Bn. or 12.27% (2020: 25.15%) during the year under review and stood at Rs. 1.949 Tn. as at December 31, 2021. The growth in assets was mainly funded by the growth in deposits of Rs. 177.128 Bn. or 13.99% (2020: 20.19%), which reached Rs. 1.443 Tn. as at the year end. Net lending portfolio grew by Rs. 117.773 Bn. or 13.13% (2020: 1.38%) during the year.
The profit after tax of the Bank for the year 2021 increased to Rs. 23.606 Bn. from Rs. 16.373 Bn. reported in 2020 recording a growth of 44.17% (2020: -3.83%). This is a significant achievement when viewed in the context of the magnitude of the challenges posed by the operating environment and the increase in impairment provision. Total operating income for the year increased to Rs. 91.395 Bn. from Rs. 74.940 Bn. reported in 2020 by 21.96% (2020: 13.52%) which contributed to the increase in the operating profit before taxes to Rs. 37.810 Bn. from Rs. 28.017 Bn. by 34.96% (2020: -5.13%) despite the increase in the impairment charges and other losses to Rs. 24.692 Bn. from Rs. 21.484 Bn. by 14.94% (2020: 94.22%).
Graph – 06: Profit growth
Overall exemplary performance witnessed in both the ASPI and S&P SL20 indices of the Colombo Stock Exchange (CSE) during the year 2021 was not reflected in the banking sector due to the perceived elevated risks associated with the sector arising from the volatile operating environment. However, the price to book value and the market capitalisation of the Bank’s shares remained the highest among peers in the Banking sector. The Bank’s market capitalisation ranked ninth among all listed companies on the Colombo Stock Exchange as at December 31, 2021.
With due consideration to the performance of the Bank during the year, the dividend policy and the Bank’s commitment to pay a reasonable dividend to the shareholders, the Board of Directors has recommended a first and final dividend of Rs. 7.50 per share (2020: Rs. 6.50 per share) for the year 2021.
Given that the Bank accounted for 98.27% (2020: 98.51%) of the total assets and 97.18% (2020: 95.83%) of the profit of the Group, the analysis below provides a detailed account of the Bank’s financial performance, followed by a brief commentary on the performance of the Bank’s overseas operations, subsidiaries and the associate as given below in this section.
Income Statement
Financial intermediation
Gross income grew by 7.46% (2020: 0.68%) to Rs. 160.886 Bn. for the year from Rs. 149.711 Bn. reported in 2020. Both interest income and the fee and commission income recorded growth, which was partly off-set by income from other sources. However, average assets for the year grew by a higher 17.99% (2020: 16.08%) compared to gross income, to Rs. 1.843 Tn. from Rs. 1.562 Tn. reported in 2020. As a result, the financial intermediation margin (gross income /average total assets) decreased to 8.73% (2020: 9.59%), a drop of 86 bps. The financial intermediation margin for the banking sector for the year was 8.53% compared to 9.57% for 2020.
Fund-based operations
Interest income, which accounted for 81.08% (2020: 81.71%) of the gross income of Rs. 160.886 Bn., increased to Rs. 130.443 Bn. during the year from Rs. 122.330 Bn. in 2020, recording a growth of 6.63% (2020: -4.26%). This was mainly attributable to the growth in average interest-earning assets by Rs. 258.347 Bn. which was partly off-set by the drop in average rate of interest on interest earning assets by 0.81%. The excess liquidity that arose from growth in deposits being higher than the growth in loans and advances, was invested in government securities. As a result, interest income earned from sources other than loans and advances, accounted for 39.38% (2020: 29.88%) of total interest income, an increase of 40.54% (2020: 34.08%). In contrast, interest income from loans and advances decreased by 7.82% (2020: -14.66%) owing to the lower interest rate environment that prevailed during the most part of the year.
Interest expenses, which accounted for 50.47% of the interest income (2020: 59.48%), decreased to Rs. 65.832 Bn. during the year from Rs. 72.759 Bn. reported in 2020, recording a negative growth of 9.52% (2020: -9.70%). This was mainly due to timely repricing of liabilities to reflect the decreasing interest rate regime and a significant improvement of the CASA ratio to an industry leading 47.83% by 5.11%. The decline in the average rate of interest on interest-bearing liabilities by 1.29% was partly off-set by a growth in average interest-bearing liabilities by Rs. 222.145 Bn.
Consequently, net interest income improved to Rs. 64.611 Bn. from Rs. 49.571 Bn. reported in 2020, recording a commendable growth of 30.34% (2020: 5.01%), accounting for 70.69% of the total operating income (2020: 66.15%). The net interest margin improved by 34bps to 3.51% from 3.17% reported in 2020.
Fee-based operations
Fee and commission income amounted to Rs. 15.410 Bn. compared to Rs. 11.269 Bn. reported in 2020, recording a growth of 36.76% (2020: -9.17%) due to an increase in income from credit and debit cards related services and trade and remittance businesses during the year.
Fee and commission expenses, which relate mostly to credit and debit cards related services too increased to Rs. 3.659 Bn. from Rs. 2.012 Bn. reported in 2020, recording a growth of 81.84% (2020: -4.96%). Consequently, net fee and commission income increased to Rs. 11.751 Bn. compared to Rs. 9.256 Bn. reported in 2020, recording a growth of 26.95% (2020: -10.04%), and it accounted for 12.86% of the total operating income (2020: 12.35%).
Other income
Total other income of the Bank amounted to Rs. 15.032 Bn. for the year compared to Rs. 16.113 Bn. reported in 2020, and recorded a drop of 6.70% (2020: 89.11%). This was due to net gains from de-recognition of financial assets for 2021 being only Rs. 3.002 Bn. compared to Rs. 6.390 Bn. reported in 2020. However, the negative impact of the above was partly off-set by net other operating income increasing by Rs. 2.251 Bn. or 28.69% (2020: 30.23%) to Rs. 10.095 Bn. from Rs. 7.844 Bn., mainly as a result of an increase in exchange profit due to a 6.50% (2020: 2.81%) depreciation of the Sri Lankan Rupee against the US Dollar during 2021. Net gains from trading increased by Rs. 57.921 Mn. or 3.08% in 2021.
Total operating income
Consequent to the improvements in net interest income and net fee and commission income, which was partly off-set by the negative growth in other income, total operating income grew to Rs. 91.395 Bn. from Rs. 74.940 Bn. reported in 2020 by Rs. 16.454 Bn. or 21.96% (2020: 13.52%).
Graph – 07: Total operating income
Impairment charges
Impairment charges and other losses for the year increased to Rs. 24.692 Bn. or 14.94% (2020: 94.22%) from Rs. 21.484 Bn. reported in 2020, the highest ever provision the Bank has made for a single year in its history. This was due to the Bank making additional provisions of Rs. 8.071 Bn. (2020: Rs. 5.189 Bn.) for expected credit losses by way of management overlays to account for potential losses in the loans and advances portfolio that the impairment models may not be capturing due to the high level of uncertainty and volatility that prevailed throughout the year, and a provision of Rs. 6.893 Bn. (2020: Rs. 2.497 Bn.) on account of FCY denominated securities issued by the Government of Sri Lanka consequent to the downgrading of the sovereign rating.
Graph – 08: Impairment charges
*Based on LKAS 39
Net operating income
The growth in total operating income by Rs. 16.454 Bn. more than off-set the increase in impairment charges and other losses of Rs. 3.209 Bn., resulting in the net operating income posting a growth of Rs. 13.246 Bn. or 24.78% to Rs. 66.702 Bn. for the year compared to Rs. 53.457 Bn. reported in 2020.
Operating expenses
Total operating expenses for the year amounted to Rs. 28.892 Bn. compared to Rs. 25.440 Bn. reported in 2020 and recorded an increase of Rs. 3.452 Bn. or 13.57% (2020: 0.06%). This was mainly as a result of the increase in personnel expenses by 12.07% (2020: 3.42%) to Rs. 16.321 Bn. from 14.564 Bn. for 2020, following the signing of the new collective agreement effective from January 01, 2021, with the Ceylon Bank Employees Union and the salary increases granted to the executive cadre. In addition, other operating expenses for the year too increased by 19.08% (2020: -8.17%) to Rs. 9.392 Bn. from Rs. 7.887 Bn for 2020.
Consequent to the increase in net other operating income and efforts taken to contain the operating expenses despite the inflationary pressures, the Bank’s Cost to Income ratio (excluding Value Added Tax on financial services) for the year 2021 improved to 31.61% (2020: 33.95%).
Profit before and after taxes
The growth in net operating income by 24.78% coupled with the increase in total operating expenses being curtailed to 13.57% resulted in operating profit before Value Added Tax on financial services improving to Rs. 37.810 Bn. compared to Rs. 28.017 Bn. in 2020 by Rs. 9.794 Bn. or 34.96% (2020: -5.13%).
In line with the growth in operating profit, the Value Added Tax on financial services for the year increased to Rs. 5.809 Bn. compared to Rs. 4.505 Bn. reported in 2020 and recorded an increase of Rs. 1.304 Bn. or 28.94% (2020: -37.35%). Consequently, the Bank’s Cost to Income ratio (including Value Added Tax on financial services) for the year 2021, also improved to 37.97% (2020: 39.96%).
As a result, profit before income tax expense for the year increased to Rs. 32.001 Bn. from Rs. 23.511 Bn. reported in 2020 and recorded an improvement of Rs. 8.490 Bn. or 36.11% (2020: 5.25%). Income tax charge for year amounted to Rs. 8.395 Bn. compared to Rs. 7.138 Bn. reported in 2020, an increase of 17.62% (2020: 34.32%). The proportionately lower increase in the income tax charge for the year was primarily due to two factors. Firstly, the income tax provision for the current year has been computed at 24% compared to the rate of 28% used in 2020. Secondly, there was a reversal of an excess provision for income tax made in 2020 during the year under review as the income tax provision for 2020 had been computed at the rate of 28% since the 24% tax rate proposed in the Government Budget 2020 had not been enacted at the time the financial statements for 2020 were finalised.
Consequently, the profit after tax for the year recorded a higher growth of 44.17% (2020: -3.83%) and stood at Rs. 23.606 Bn. compared to Rs. 16.373 Bn. reported for 2020.
Graph – 09: Profit before and after tax
Profitability
Reflecting the higher growth in profit after tax and the relatively lower growth in assets and equity during the year, both Return on Assets (ROA) and Return on Equity (ROE) improved to 1.28% (2020: 1.05%) and 14.66% (2020: 11.28%) respectively. ROA (before tax) for the year too improved to 1.74% (2020: 1.51%).
Graph – 10: ROA and ROE
Other Comprehensive Income (OCI)
Other comprehensive income of the Bank reported a loss of Rs. 10.705 Bn. during the year as against the profit of Rs. 1.406 Bn. reported in 2020, primarily due to net losses arising from investments in financial assets at fair value through OCI, amounting to Rs. 12.599 Bn. (2020: Rs. -1.401 Bn.). The Bank invested excess liquidity in Government securities and a hike in interest rates on Government securities mainly during the latter part of 2021, caused the above loss.
Accordingly, the total comprehensive income of the Bank for the year 2021 decreased to Rs. 12.901 Bn. from Rs. 17.780 Bn. reported in 2020, a negative growth of 27.44% (2020: -9.64%).
Statement of Financial Position
Assets
Total assets of the Bank grew by a healthy 12.27% (2020: 25.15%) during the year to reach Rs. 1.949 Tn. from Rs. 1.736 Tn. at the previous year end. This growth is well in excess of the industry growth of 12.46%. This was due to the growth in loans and advances portfolio and the excess liquidity being invested in Government securities.
Graph – 11: Composition of total assets
Loans and advances to customers
One of the significant achievements during the year was that the loans and advances portfolio of the Bank crossed Rs. 1 Tn. mark and the Bank once again became the first private sector bank in the country to achieve this milestone after being the first private sector bank in the country to cross the Rs. 1 Tn. in total assets (in 2016) and deposits (in 2019). Reversing the trend observed in most parts of 2020, credit to the private sector increased during the year despite the adverse macro-economic environment that prevailed in the country. The gross loans and advances as at December 31, 2021 stood at Rs. 1.079 Tn. compared to Rs. 947.842 Bn. a year ago and the net loans and advances as at December 31, 2021 stood at Rs. 1.015 Tn. compared to Rs. 896.845 Bn. as at end 2020, recording a noteworthy growth of 13.13% (2020: 1.38%), and it accounted for 52.05% (2020: 51.66%) of total assets as at December 31, 2021.
The Bank continued to extend concessions and accommodate moratorium requests to the borrowers affected by both the Easter Sunday attack and the COVID-19 pandemic. However, loans and advances under moratoria reduced from Rs. 252.674 Bn. as at December 31, 2020 to Rs. 50.877 Bn. by end 2021 with certain sectors gradually coming out of the Government granted forbearance measures.
Asset quality
Quality of the loans and advances portfolio is a key determinant of the sustainability of the Bank’s operations. The conservative risk profile, with a moderate risk appetite and a robust risk management framework, helped the Bank to end the year with improvements in both the gross and the net NPL ratios at 4.62% (2020: 5.11%) and 1.44% (2020: 2.18%), respectively, compared to industry averages of 4.82% and 2.16%, respectively.
Cumulative impairment provisions for loans and advances as a percentage of the total loans and advances portfolio as at the end of the year increased to 5.94% (2020: 5.38%), while the total regulatory provisions to gross loans and advances portfolio too improved to 3.52% (2020: 3.32%) as at the year end. Further, the specific provision coverage ratio (based on the regulatory provisions that existed up to December 31, 2021) increased to 68.93% by end of 2021 (2020: 57.42%) compared to 56.40% for the industry. These measures helped the Bank to improve the open credit exposure ratio (which is net exposure on NPLs as a percentage of regulatory capital) to 8.79% at end of 2021 (2020: 11.88%). In addition, both the impaired loans (stage 3) ratio and the impairment (Stage 3) to Stage 3 Loans Ratio too improved to 3.85% (2020: 6.78%) and 42.76% (2020: 30.87%) respectively, by end of 2021. The improvements in both the above ratios were consequent to the Bank re-evaluating the stage assessment criteria for individually impaired credit facilities and making necessary changes to reflect the actual risks associated with customers subjected to individual impairment. Both these ratios are based on the proposed regulatory provisions under the Banking Act Direction of No. 13 of 2021, issued by the Central Bank of Sri Lanka, which became effective from January 01, 2022.
The loans-to-customers portfolio of the Bank is fairly well diversified across a wide range of industry sectors with no significant exposure to any particular sector. Please see Note 34.1 for the details.
Graph – 12: Deposits and advances
Deposits
With the solid domestic franchise in Sri Lanka, customer deposits continued to be the single biggest source of funding for the Bank, accounting for 74.03% (2020: 72.92%) of the total assets as at December 31, 2021. Deposits grew by 13.99% (2020: 20.19%) to Rs. 1.443 Tn. as at December 31, 2021. The growth in deposits during the year was Rs. 177.128. Bn., with a monthly average growth of Rs. 14.761 Bn. The CASA ratio too improved significantly to 47.83% (2020: 42.72%) as at December 31, 2021 compared to industry average of 36.01%.
Other liabilities
The significant increase in deposit liabilities when compared to the lower growth in loans and advances meant that the Bank had excess liquidity during most part of the year. As a result, the Bank reduced its external borrowings during the year which helped the Bank to reduce its interest expenses and improve its net interest income and the interest margins as mentioned earlier. With increased Repo borrowing of Rs. 60.474 Bn., total other liabilities as at the current year-end increased to Rs. 341.226 Bn. from Rs. 313.106 Bn. in 2020. During the year, the Bank raised Rs. 8.595 Bn. through an issue of BASEL III compliant debenture and redeemed debentures amounting to Rs. 9.502 Bn. that matured during the year.
Capital
The Bank is guided by its Internal Capital Adequacy Assessment Plan (ICAAP) and the Board approved dividend policy in maintaining capital commensurate with its current and projected business volumes. Accordingly, with the improved profitability and the prudent dividend policy helped the Bank to grow its equity capital by 4.93% (2020: 18.01%) to Rs. 164.894 Bn. as at December 31, 2021 from Rs. 157.146 Bn. as at December 31, 2020. With an on balance sheet multiplier (gearing ratio) of 11.82 times (2020: 11.05 times), compared to the industry average of 11.71 times, equity funded 8.46% (2020: 9.05%) of the total assets as at the current year end. The Bank ploughed back Rs. 11.120 Bn. out of profit for the year in 2020 after the payment of cash dividends and is expected to plough back Rs. 18.232 Bn. after the payment of cash dividends for the year 2021. Profits ploughed back include scrip dividends as well.
However, the risk weighted assets of the Bank grew by 8.95% (2020: 4.77%) to Rs.1.110 Tn. as at December 31, 2021. Consequently, both the Tier 1 and the total capital ratios stood at 11.923% (2020: 13.217%) (minimum requirement – 9.000% for 2021) and 15.650% (2020: 16.819%) (minimum requirement - 13.000% for 2021) respectively, as at December 31, 2021, which are in excess of the higher capital adequacy requirement imposed on the Bank under the Basel III requirements as a Domestic Systemically Important Bank (D-SIB). The equity multiplier in terms of risk weighted assets to regulatory total capital increased to 6.39 times from 5.95 times a year ago. As per the CBSL Basel III regulations, the Bank is one of the highest graded D-SIB, showcasing the Bank’s importance to the Sri Lankan economy.
Since the proposed surcharge tax, which had not been enacted in Parliament at the time of reporting, potential impact has not been accounted for and the Bank anticipates it to impact the Bank's capital in the coming year, subject to the enactment of the aforementioned tax.
Graph – 13: Shareholders’ funds
Liquidity
The growth in deposits outpaced the growth in loans and advances, causing the Bank to invest the excess liquidity in Government securities. Nevertheless, at a time of unprecedented volatility such as what we currently experience, excess liquidity provides a high level of comfort to the Bank and also, enables the Bank to benefit from the upturn envisaged in credit demand in the years ahead. Given its importance, review of liquidity is a permanent item of the agenda in the fortnightly ALCO meetings of the Bank.
Liquid assets ratios of the Domestic Banking Unit (DBU) and the Off-shore Banking Centre (OBC) were 38.73% (2020: 44.99%) and 36.39% (2020: 32.70%) respectively, as at end of 2021, compared to the statutory minimum requirement of 20%. Gross loans to deposits ratio was 74.75% (2020: 74.87%). Available stable funding based on definitions prescribed by the CBSL stood at Rs. 1.447 Tn. as at December 31, 2021 (2020: Rs. 1.289 Tn., leading to a Net Stable Funding Ratio (NSFR) of 157.47% (2020: 157.49%), comfortably above the statutory minimum of 100% (2020: 90%). Demonstrating the availability of unencumbered high-quality liquid assets at the disposal of the Bank, the Liquidity Coverage Ratio (all currency) stood at 242.52% (2020: 422.86%) as at December 31, 2021 as against the statutory minimum of 100% (2020: 90%).
Note: All the industry related figures mentioned above have been extracted/computed/annualised based on the information published by the CBSL as at September 30, 2021.
Segmental performance
The contribution from the Personal Banking Division to the profit before tax of the Group significantly increased to 35.95% (2020: 25.11%), mainly due to the increase in net interest income, while the contribution to the profit before tax of the Group from the Corporate Banking Division significantly reduced to 1.76% (2020: 11.95%), mainly due to higher impairment charges and other losses. In the meantime, the Bank’s Treasury division continued to make a significant contribution to the Group’s profit before tax of 41.82% (2020: 40.78%) during 2021 as well, mainly due to a significant increase in the net interest income. Contribution from the International Operations to the profit before tax of the Group reduced to 18.63% (2020: 20.46%), while its contribution to the total assets of the Group accounted for 12.38% (2020: 11.79%).
The quarterly financial performance and the financial position of the Group and the Bank for 2020 and 2021 are given in the section on Summary of Interim Financial Statements while the Bank's performance in terms of key indicators is given in the section on "Decade at a Glance".
Table – 21: Financial soundness indicators
| Financial soundness indicator (%) | 2021 | 2020 | 2019 | 2018 | 2017 |
| Capital Adequcacy (under Basel III) | |||||
| Common Equity Tier 1 ratio (Current minimum requirement – 7.5%) | 11.92 | 13.22 | 12.30 | 11.34 | 12.11 |
| Tier 1 capital ratio (Current minimum requirement – 9%) | 11.92 | 13.22 | 12.30 | 11.34 | 12.11 |
| Total capital ratio (Current minimum requirement – 13%) | 15.65 | 16.82 | 16.15 | 15.60 | 15.75 |
| Non-performing loans (net of interest in suspense and specific provisions) to equity | 9.26 | 12.96 | 20.48 | 12.71 | 6.39 |
| Asset quality: | |||||
| Gross NPL ratio (Based on existing regulatory provisions) | 4.62 | 5.11 | 4.95 | 3.24 | 1.88 |
| Net NPL ratio (Based on existing regulatory provisions) | 1.44 | 2.18 | 3.00 | 1.71 | 0.92 |
| Impaired loans (Stage 3) ratio (Based on proposed regulatory provisions) | 3.85 | 6.78 | N/A | N/A | N/A |
| Impairment (Stage 3) to Stage 3 Loans ratio (Based on proposed regulatory provisions) | 42.76 | 30.87 | N/A | N/A | N/A |
| Total regulatory provisions ratio on gross loans and receivables (Based on existing regulatory provisions) | 3.52 | 3.32 | 2.37 | 1.97 | 1.40 |
| Specific provision coverage ratio (Based on existing regulatory provisions) | 68.93 | 57.42 | 39.39 | 47.21 | 51.05 |
| Provision coverage ratio (Based on SLFRS provisions) | 5.94 | 5.38 | 3.89 | 3.27 | 2.29 |
| Cost of risk of loans and advances | 1.35 | 1.88 | 1.09 | 0.91 | 0.25 |
| Open credit exposure ratio | 8.79 | 11.88 | 17.37 | 10.21 | 5.59 |
| Earnings and profitability: | |||||
| Net interest income to total operating income | 70.69 | 66.15 | 71.51 | 70.56 | 80.00 |
| Net fee and commission income to total operating income | 12.86 | 12.35 | 15.59 | 15.95 | 17.64 |
| Other income to total operating income | 16.45 | 21.50 | 12.91 | 13.50 | 2.37 |
| Operating expenses to gross income | 17.96 | 16.99 | 17.10 | 17.00 | 17.33 |
| Financial soundness indicator (%) | 2021 | 2020 | 2019 | 2018 | 2017 |
| Impairment charge to total operating income | 27.02 | 28.67 | 16.76 | 13.46 | 1.39 |
| Cost to income ratio (including taxes on financial services) | 37.97 | 39.96 | 49.41 | 46.35 | 51.08 |
| Cost to income ratio (excluding taxes on financial services) | 31.61 | 33.95 | 38.51 | 36.85 | 41.08 |
| Financial intermediation margin (Gross income to average assets) | 8.73 | 9.59 | 11.05 | 11.28 | 10.61 |
| Interest margin (Net interest income to average assets) | 3.51 | 3.17 | 3.51 | 3.67 | 3.62 |
| Return on assets (ROA) – before income tax | 1.74 | 1.51 | 1.66 | 2.09 | 2.15 |
| Return on assets (ROA) – after income tax | 1.28 | 1.05 | 1.27 | 1.43 | 1.54 |
| Return on equity (ROE) | 14.66 | 11.28 | 13.54 | 15.56 | 17.88 |
| Liquidity: | |||||
| Statutory liquid assets ratio (Domestic Banking Unit) – (Current minimum requirement – 20%) | 38.73 | 44.99 | 30.42 | 24.47 | 27.28 |
| Statutory liquid assets ratio (Offshore Banking Unit) – (Current minimum requirement – 20%) | 36.39 | 32.70 | 25.25 | 30.20 | 30.95 |
| Liquidity Coverage Ratio (LCR) – Rupee – (Current minimum requirement – 100%) | 425.97 | 599.38 | 158.79 | 236.20 | 272.15 |
| Liquidity Coverage Ratio (LCR) – All currency – (Current minimum requirement – 100%) | 242.52 | 422.86 | 224.74 | 238.69 | 209.17 |
| Net Stable Funding Ratio (NSFR) – (Current minimum requirement – 100%) | 157.47 | 157.49 | 137.05 | 139.18 | 127.87 |
| CASA ratio (Current and Saving deposits as a % of total deposits) | 47.83 | 42.72 | 37.10 | 37.55 | 39.23 |
| Gross Loans and receivables to deposits ratio | 74.75 | 74.87 | 87.39 | 90.56 | 88.78 |
| Assets and funding structure: | |||||
| Deposits to gross loans and receivables | 133.78 | 133.56 | 114.43 | 110.43 | 112.64 |
| Deposits to total assets | 74.03 | 72.92 | 75.92 | 75.42 | 74.35 |
| Borrowings to total assets | 3.64 | 5.35 | 4.41 | 4.86 | 4.28 |
| Equity to total assets | 8.46 | 9.05 | 9.60 | 9.08 | 9.37 |
Performance of the overseas operations, subsidiaries, and the associate
Performance of the Bank’s Bangladesh Operations
Performance of the Bangladesh Operations will have to be reviewed in the context of the Operating Context and Outlook of this Report.
Commercial Bank of Ceylon PLC (CBC) commenced its operations in Bangladesh (CBC Bangladesh) by acquiring the banking business of Credit Agricole Indosuez, a French multi-national Bank, in November 2003.
During the past 18 years of operations, CBC Bangladesh has established its position well above the other Regional Banks operating in the country with 11 Branches, 6 SME Centers and 2 Offshore Banking Units. At present, CBC Bangladesh has its presence in five main districts in the country i.e. Dhaka, Chittagong, Sylhet, Narayanganj and Gazipur. Despite the severe competition among the international and large local banks, CBC Bangladesh has recorded a consistent growth in business, specially by catering to multinationals and large local corporates by offering better services and commitments. With the expansion of the branch network, CBC Bangladesh operations has managed to attract more SME and Retail clientele to the Bank, enabling it to improve its low cost deposit base resulting in lower cost of funds and improved profitability.
Twenty ATM machines have been installed in Bangladesh (including three in off-site locations). In addition, an Automated Banking Centre (ABC) comprising a real time Cash Deposit Machine, Cheque Deposit Machine, KIOSK machine and a digital signage in its Motijheel Branch.
During the year 2021, the Bank’s Bangladesh Operations has been awarded many accolades including the following:
- Most Recommended Foreign Bank in Bangladesh – 2021 by the World Business Outlook, a Singapore-based magazine.
- Best Foreign Bank in Bangladesh –2021 by Global Economics Limited, a UK-based magazine.
- Best Foreign Bank in Bangladesh –2021 by Global Business Outlook, a UK-based magazine.
- Most Sustainable Bank in Bangladesh – 2021 by the International Business Magazine, UAE.

In addition, a special commendation letter was awarded by the Central Bank of Bangladesh for disbursing the full allocation of the stimulus package to the SME sector.
A comparison of the performance of the Regional Banks operating in the country reveals that the performance of our Bangladesh Operations to be ahead in many aspects including deposits, advances, asset quality and profitability, a reflection of our excellent service and commitment.
Credit Rating Information and Services Ltd. (CRISL) rated CBC Bangladesh operations AAA for the 11th consecutive year based on the financial performance for 2020.
The progress of the Bank’s Bangladesh operations in core banking areas over the past five years is summarised below.
Table – 22: Key performances indicators – Bangladesh Operations
| Indicator | 2021 BDT Mn. | 2020 BDT Mn. | 2019 BDT Mn. | 2018 BDT Mn. | 2017 BDT Mn. | 5-Year CAGR (%) |
| Total Deposit | 64,959.50 | 50,997.50 | 45,362.98 | 35,221.65 | 28,808.18 | 22.95 |
| Gross Advances | 58,110.88 | 55,039.33 | 47,449.60 | 38,448.10 | 32,113.53 | 18.90 |
| Profit Before Tax | 3,035.35 | 2,898.24 | 2,744.68 | 2,440.56 | 1,758.56 | 14.63 |
| Profit After Tax | 1,744.11 | 1,709.47 | 1,697.40 | 1,407.23 | 988.4 | 17.31 |
Table – 23: Key Financial Ratios – Bangladesh Operations (based on Management Accounts)
| Indicator | 2021 | 2020 | 2019 | 2018 | 2017 |
| Cost/Income ratio (%) | 23.68 | 24.76 | 24.74 | 25.27 | 28.62 |
| Net Interest Margin (%) | 3.21 | 4.01 | 4.27 | 4.53 | 4.46 |
| Profit Per Employee (BDT Mn.) | 10.25 | 9.96 | 8.65 | 8.16 | 6.26 |
| ROA (%) | 3.20 | 3.46 | 3.53 | 4.31 | 3.81 |
| ROE (%) | 12.24 | 13.32 | 14.82 | 13.97 | 11.18 |
CBC Bangladesh has planned major IT projects for 2022 including the introduction of digital onboarding of customers through Flash, upgrading of the Internet Banking System, automation of the Treasury Department, automation of the Regulatory & MIS Reporting, introduction of the Loan Origination System/Document Management System/Card Personalization System/Call Centre Solution/e-Leave and e-Attendance Systems/ WhatsApp & Viber Banking and revamping of Corporate website.
Subsidiaries and associate of the Group
Given below is a brief overview of the operations of the subsidiaries and the associate of the Bank.
Local subsidiaries
Commercial Development Company PLC (CDC)
Established in 1980 as the Bank’s first subsidiary, CDC owns the Head Office building of Commercial Bank, “Commercial House”, and has two other properties in Negombo and Tangalle. The Bank holds a stake of 90% in CDC.
CDC is the only listed Subsidiary of the Group, with a market capitalisation of Rs. 1.632 Bn. as of end 2021. The principal business activities of CDC include renting of premises, hiring of vehicles, outsourcing, non-core staff and provision of other utility services to the Bank.
CDC recorded a post-tax profit of Rs. 401.506 Mn. for the year 2021, with a significant increase of 227.54% compared to Rs. 122.582 Mn. reported in 2020. The increase in profit in 2021 was primarily attributable to improvements in income from core business activities of the Company. Further, the fair value gain recognised on revaluation of investment property in 2021 as against a fair value loss on revaluation of investment property in 2020 too contributed to the increase in profit.
CBC Tech Solutions Limited
CBC Tech Solutions Limited is a fully owned subsidiary of the Bank and provides Information Technology services and solutions to the Bank, its subsidiaries and to a few selected corporates.
The main lines of business of CBC Tech Solutions are providing Information Technology support, supply of hardware, licensed software, hardware maintenance, Point of Sale (POS) maintenance, software development, and outsourcing of professional and skilled manpower to the Bank. At present, the company operates from five regional support centers in Colombo, Galle, Kandy, Jaffna and Badulla to ensure prompt services.
In 2021, the company undertook an island wide personal computer maintenance and POS machine troubleshooting project for the Bank. The company also established a regional support center in Badulla to further strengthen its support services. In addition, the company also embarked on new initiatives such as Data Analytics, Cloud services, and customer-centric product development. The company further upskilled its employees and outsourced them to the subsidiaries of the Bank.
One of the key challenges faced by the company in 2021, was to provide island-wide technical support due to the Covid-19 pandemic. This situation was arrested by deploying more resources in regional support centers and by providing first level support to facilitate work-from-home arrangements.
The company posted a post-tax profit of Rs. 181.134 Mn. for the year 2021, recording a growth of 91.38% from Rs. 94.648 Mn. reported in 2020. The substantial growth in profit was mainly due to expanded operations of the company and the tax savings accrued from the exemptions granted for companies providing IT related services. The company has prepared a five-year strategic plan clearly articulating its future direction. The strategy includes new business initiatives, revenue lines and partnerships that would ensure a sustainable growth.
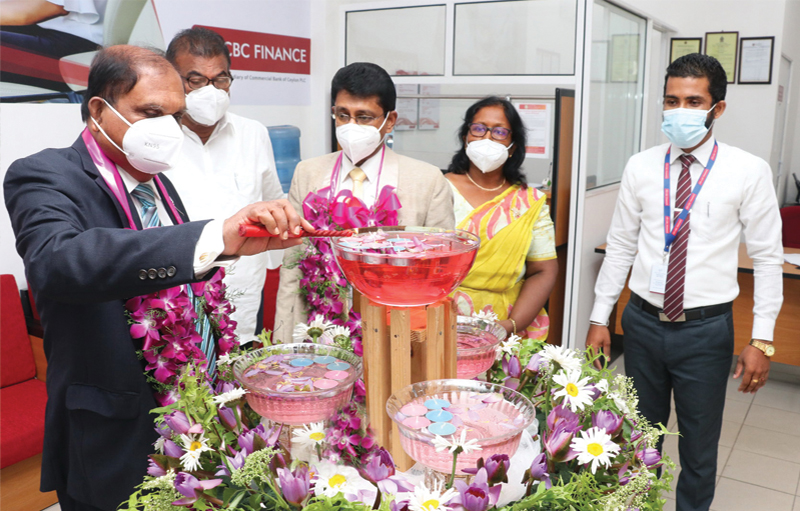
CBC Finance Limited (CBCF)
CBCF (Previously Serendib Finance Limited) is a fully owned subsidiary of the Bank and is a Licensed Finance Company (LFC) under the Finance Business Act No. 42 of 2011.
Since the acquisition of the company in 2014 by the Bank, the business plans and strategies of the company were aligned with the Bank’s strategies, governance and risk management policies and practices.
Since December 2020, the name of the company was changed from Serendib Finance Limited to CBC Finance Limited to strengthen the synergies with the parent Company, Commercial Bank of Ceylon PLC.
The year 2021 was another challenging year for the entire NBFI industry due to Covid-19 related business disruptions and the adverse impact on their customer base. Despite the challenges, the company increased its gross income by 20.39% to Rs. 1,264.114 Mn. Identifying the timely need to be proactive in providing for doubtful customers, the company's impairment provision for the year rose by 84.03% to Rs. 386.483 Mn. Despite the increased impairment charges, the company recorded a profit before tax of Rs. 140.908 Mn. compared to Rs. 110.037 Mn. recorded in the previous year. However, the company’s post-tax profit recorded a negative growth of 11.74% to Rs. 51.612 Mn. as against Rs. 58.477 Mn. recorded in the previous year. This was mainly due to the increased tax expenses as a result of the reversal of deferred tax assets due to the reduction of the income tax rate.
Since the commencement of accepting public deposits from the latter part of 2019, the company increased its deposits portfolio to Rs. 5.069 Bn. by end of 2021, reflecting a 50.98% growth over the last year despite market uncertainties. This enabled the company to further reduce its funding cost during the year under review.
For the first time in history, company surpassed the Rs. 10 Bn. mark in total assets during the year with a 21.56% increase to Rs. 10.312 Bn. (2020: Rs 8.483 Bn.), a remarkable achievement during the financial year. In addition, the company’s net loans have grown by approximately 16.19% despite the growth in its core product - finance leasing being curtailed due to the regulatory restrictions on the Loan to Value ratio. However, the timely shift towards other products such as mortgage and business loans, paved the way to overcome a possible unfavourable impact. Furthermore, the Gross NPA ratio of the company significantly improved to 13.14% as at December 31, 2021 (2020: 16.52%).
Fitch Ratings Lanka Limited rated the company at A(Ika), which is one of the highest ratings given to a finance company in the country backed by the strength of its parent company. During the year, CBCF relocated Embilipitiya, Matara and Anuradhapura branches to provide a better customer experience. The company is planning to embark on a journey of expanding the delivery channels by adding twenty new branches in strategically important business areas and the Central Bank of Sri Lanka has already given the necessary approval to open ten new branches in 2022.
Commercial Insurance Brokers (Pvt) Ltd (CIBL)
The Bank acquired the 20% stake in CIBL held by the Bank’s subsidiary, CDC, during the year 2020, which together with the stake of 40% already held by the Bank, increased the Bank’s total stake in CIBL to 60%. The principal business activity of CIBL is insurance brokering for all types of insurance through reputed life and general insurance companies in Sri Lanka.
CIBL recorded a post-tax profit of Rs. 30.286 Mn. for the year ended December 31, 2021, a negative growth of 5.59% from Rs. 32.078 Mn. recorded in 2020. The CIBL’s total assets stood at Rs. 705.396 Mn. as at December 31, 2021.
Local associate
Equity Investments Lanka Ltd. (EQUILL)
The Bank owns a 22.92% stake in EQUILL, a venture capital company established 31 years ago. EQUILL invests in equity and equity-featured debt instruments.
The company recorded a post-tax profit of Rs. 8.272 Mn. in 2021 compared to the post-tax profit of Rs. 17.006 Mn. reported in the previous financial year.
Foreign subsidiaries
Commercial Bank of Maldives Private Limited (CBM)
In partnership with Tree Top Investments (TTI), CBM was founded in the Republic of Maldives as the second foreign subsidiary of the Bank. TTI contributes vital local market knowledge to the company and has a stake of 45%, while the Bank holds a 55% stake in the company. Established during the latter part of 2016, CBM set up its Head Office and first branch in the capital, Malé. By end 2021, CBM had two branches.
While offering an extensive range of financial services, CBM’s goal is to be the most technologically advanced, innovative, customer friendly, and the most sought-after financial service organisation in the Republic of Maldives.
In its third year of operations, CBM was awarded for “Excellence in Finance” in the Banking and Finance category at the 2019 Maldives Business Awards. In 2021, CBM was ranked amongst the top leading 100 companies in the Maldives at the “Gold 100 Gala” event organized by the Corporate Maldives and has emerged as winners in the category “Fastest Growing Commercial Bank - Maldives 2021”, awarded by the Global Business Outlook, UK.

During the year 2021, CBM recorded a considerable growth in its deposits and advances by 32.95% and 14.30% respectively. Total assets of CBM also recorded a remarkable growth of 29.37% and stood at MVR 2.316 Bn. as at December 31, 2021. In 2021, CBM recorded a post-tax profit of MVR 32.840 Mn., compared to the post-tax profit of MVR 22.723 Mn. reported in 2020. Profit recorded in the current year is the highest profit achieved by the Bank in the operation of its 5-year history.
CBC Myanmar Microfinance Company (CBC Myanmar)
CBC Myanmar was established in July 2018 with the opening of its Head Office and a branch in Lewe Township in Nay Pyi Taw as a fully owned subsidiary of the Bank with the focus of capitalizing on opportunities in the Microfinance sector.
The company obtained a temporary license initially and secured a permanent business license on January 17, 2020. The company started its branch network in Lewe Township and expanded to Aye Lar, Zabuthiri, and Pyinmana townships.
CBC Myanmar faced twin blows of the pandemic and the political coup during the financial year ended December 31, 2021. The political unrest created a highly volatile environment as the general public walked out to the streets to voice out against the military regime. The unrest affected all layers of the economy, and the microfinance sector was affected severely as the repayments were hampered due to loss of income. The COVID-19 third wave hit hard on the microfinance sector at the beginning of the second half of the year, and the company was closed for more than one month due to stay-home orders. However, the outlook of the microfinance sector shifted positively during the latter part of the second half of the year and the recoveries improved steadily.
The company disbursed MMK 1.317 Bn. in new loans during 2021 despite the challenges in the operating environment and posted a loss of MMK 247.048 Mn. during the financial year ended December 31, 2021 compared to a profit of MMK 91.360 Mn. during the previous financial year. Identifying the need for digital platforms to facilitate recoveries, the company has initiated to partner with leading digital wallet share providers.
Commex Sri Lanka S.R.L. (Commex)
Commex, a fully-owned subsidiary of the Bank, commenced business under the Authorised Payments Institute (API) license issued by the Bank of Italy in 2016. As a result, Commercial Bank became the first Sri Lankan bank to be licensed by the Bank of Italy to operate as a money transfer company. The license allows Commex to expand across the European Union using passporting rights.
During 2021, Commex recorded a loss of EUR 0.481 Mn.
The details of the Group companies together with a summary of key financial information for each company is given in the section on "Group Structure".
Summary of Interim Financial Statements – Group and Bank – 2020 and 2021
| 1st Quarter ended March 31 | 2nd Quarter ended June 30 | 3rd Quarter ended September 30 | 4th Quarter ended December 31 | Total | |||||||
| 2021 | 2020 | 2021 | 2021 | 2021 | 2020 | 2021 | 2020 | 2021 | 2020 | ||
| Rs. ’000 | Rs. ’000 | Rs. ’000 | Rs. ’000 | Rs. ’000 | Rs. ’000 | Rs. ’000 | Rs. ’000 | Rs. ’000 | Rs. ’000 | ||
|
Group |
Group |
||||||||||
| Net interest income | 15,476,721 | 12,782,660 | 15,681,311 | 9,984,100 | 16,375,248 | 14,029,002 | 18,883,052 | 14,073,040 | 66,416,332 | 50,868,802 | Net interest income |
| Net fee and commission income | 3,023,322 | 2,447,061 | 2,688,925 | 1,640,638 | 2,884,472 | 2,672,054 | 3,645,475 | 3,061,922 | 12,242,194 | 9,821,675 | Net fee and commission income |
| Other operating income (net) | 5,660,582 | 4,618,052 | 3,813,475 | 3,964,571 | 3,347,432 | 3,679,491 | 2,118,308 | 3,776,897 | 14,939,797 | 16,039,011 | Other operating income (net) |
| Less: Impairment charges and other losses | 7,156,050 | 6,653,253 | 6,498,391 | 2,607,571 | 4,342,977 | 7,471,776 | 7,142,508 | 4,686,932 | 25,139,926 | 21,419,532 | Less: Impairment charges and other losses |
| Net operating income | 17,004,575 | 13,194,520 | 15,685,320 | 12,981,738 | 18,264,175 | 12,908,771 | 17,504,327 | 16,224,927 | 68,458,397 | 55,309,956 | Net operating income |
| Less: Expenses | 8,600,269 | 7,755,912 | 8,336,383 | 7,303,047 | 8,950,689 | 7,634,075 | 9,615,628 | 8,100,960 | 35,502,969 | 30,793,994 | Less: Expenses |
|
Operating profit |
8,404,306 | 5,438,608 | 7,348,937 | 5,678,691 | 9,313,486 | 5,274,696 | 7,888,699 | 8,123,967 | 32,955,428 | 24,515,962 |
Operating profit |
| Add: Share of profits/(losses) of associate companies | (133) | (914) | 546 | 177 | (330) | 2,665 | 1,813 | 1,970 | 1,896 | 3,898 | Add: Share of profits/(losses) of associate companies |
| Profit before income tax | 8,404,173 | 5,437,694 | 7,349,483 | 5,678,868 | 9,313,156 | 5,277,361 | 7,890,512 | 8,125,937 | 32,957,324 | 24,519,860 | Profit before income tax |
| Less: Income tax expense | 1,606,916 | 1,623,311 | 1,793,203 | 2,045,674 | 2,649,350 | 1,549,657 | 2,617,567 | 2,214,421 | 8,667,036 | 7,433,063 | Less: Income tax expense |
|
Profit for the period |
6,797,257 | 3,814,383 | 5,556,280 | 3,633,194 | 6,663,806 | 3,727,704 | 5,272,945 | 5,911,516 | 24,290,288 | 17,086,797 |
Profit for the period |
| Quarterly profit as a percentage of the profit after tax | 27.3 | 22.3 | 22.3 | 21.3 | 26.7 | 21.8 | 21.7 | 34.6 | 100.0 | 100.0 | Quarterly profit as a percentage of the profit after tax |
| Cumulative quarterly profit as a percentage of the profit after tax | 27.3 | 22.3 | 49.6 | 43.6 | 76.3 | 65.4 | 100.0 | 100.0 | – | – | Cumulative quarterly profit as a percentage of the profit after tax |
|
Bank |
Bank |
||||||||||
| Net interest income | 15,051,903 | 12,425,953 | 15,226,162 | 9,701,778 | 15,934,934 | 13,762,118 | 18,397,613 | 13,681,492 | 64,610,612 | 49,571,341 | Net interest income |
| Net fee and commission income | 2,886,892 | 2,293,173 | 2,570,984 | 1,527,747 | 2,803,989 | 2,540,162 | 3,489,598 | 2,895,323 | 11,751,463 | 9,256,405 | Net fee and commission income |
| Other operating income (net) | 5,692,641 | 4,600,441 | 3,806,422 | 4,039,888 | 3,345,805 | 3,686,508 | 2,187,582 | 3,785,715 | 15,032,450 | 16,112,552 | Other operating income (net) |
| Less: Impairment charges and other losses | 7,052,038 | 6,544,696 | 6,306,004 | 2,895,956 | 4,261,500 | 7,441,088 | 7,072,801 | 4,601,958 | 24,692,343 | 21,483,698 | Less: Impairment charges and other losses |
|
Net operating income |
16,579,398 | 12,774,871 | 15,297,564 | 12,373,457 | 17,823,228 | 12,547,700 | 17,001,992 | 15,760,572 | 66,702,182 | 53,456,600 |
Net operating income |
| Less: Expenses | 8,396,219 | 7,546,314 | 8,061,141 | 7,155,931 | 8,818,226 | 7,427,613 | 9,425,393 | 7,815,430 | 34,700,979 | 29,945,288 | Less: Expenses |
|
Profit before income tax |
8,183,179 | 5,228,557 | 7,236,423 | 5,217,526 | 9,005,002 | 5,120,087 | 7,576,599 | 7,945,142 | 32,001,203 | 23,511,312 |
Profit before income tax |
| Less: Income tax expense | 1,525,107 | 1,521,991 | 1,760,639 | 1,962,981 | 2,533,250 | 1,486,601 | 2,576,156 | 2,166,250 | 8,395,152 | 7,137,823 | Less: Income tax expense |
|
Profit for the period |
6,658,072 | 3,706,566 | 5,475,784 | 3,254,545 | 6,471,752 | 3,633,486 | 5,000,443 | 5,778,892 | 23,606,051 | 16,373,489 |
Profit for the period |
| Quarterly profit as a percentage of the profit after tax | 27.3 | 22.6 | 22.5 | 19.9 | 26.5 | 22.2 | 21.2 | 35.3 | 100.0 | 100.0 | Quarterly profit as a percentage of the profit after tax |
| Cumulative quarterly profit as a percentage of the profit after tax | 27.3 | 22.6 | 49.8 | 42.5 | 76.3 | 64.7 | 100.0 | 100.0 | – | – | Cumulative quarterly profit as a percentage of the profit after tax |
Statement of Financial Position – Group – 2020 and 2021
| 1st Quarter ended | 2nd Quarter ended | 3rd Quarter ended | 4th Quarter ended | |||||||
| As at | March 31, 2021 Rs. ’000 | March 31, 2020 Rs. ’000 | June 30, 2021 Rs. ’000 | June 30, 2020 Rs. ’000 | September 30, 2021 Rs. ’000 | September 30, 2020 Rs. ’000 | December 31, 2021 (Audited) Rs. ’000 | December 31, 2020 (Audited) Rs. ’000 | As at | |
|
Assets |
Assets |
|||||||||
| Cash and cash equivalents | 51,995,270 | 69,291,420 | 67,888,744 | 52,425,162 | 93,000,346 | 44,382,431 | 69,335,379 | 51,255,030 | Cash and cash equivalents | |
| Balances with Central Banks | 79,603,760 | 38,459,820 | 84,715,615 | 57,547,194 | 49,431,255 | 83,313,147 | 56,777,465 | 115,358,732 | Balances with Central Banks | |
| Placements with banks | 13,834,678 | 28,862,006 | 7,625,796 | 26,860,049 | 20,218,425 | 17,645,097 | 12,498,709 | 16,421,867 | Placements with banks | |
| Securities purchased under re-sale agreements | – | 10,448,494 | – | 7,209,397 | 2,697,359 | 445,577 | 3,000,490 | – | Securities purchased under resale agreements | |
| Derivative financial assets | 3,633,738 | 2,140,505 | 3,105,697 | 1,898,100 | 3,271,766 | 2,011,946 | 3,245,120 | 2,636,717 | Derivative financial assets | |
| Financial assets recognised through profit or loss – measured at fair value | 25,982,011 | 25,660,517 | 34,171,453 | 32,898,907 | 31,522,053 | 43,470,925 | 23,436,123 | 35,189,471 | Financial assets recognised through profit or loss – measured at fair value | |
| Financial assets at amortised cost – Loans and advances to banks | 829,740 | 792,189 | 837,037 | 776,550 | 833,952 | 773,422 | – | 779,705 | Financial assets at amortised cost – Loans and advances to banks | |
| Financial assets at amortised cost – Loans and advances to other customers | 929,618,154 | 917,442,418 | 971,894,929 | 897,297,570 | 999,913,656 | 899,988,223 | 1,029,584,075 | 909,829,172 | Financial assets at amortised cost – Loans and advances to other customers | |
| Financial assets at amortised cost – Debt and other financial instruments | 350,832,246 | 116,242,352 | 375,044,696 | 195,822,341 | 356,179,525 | 269,243,315 | 385,390,598 | 302,059,529 | Financial assets at amortised cost – Debt and other financial instruments | |
| Financial assets measured at fair value through other comprehensive income | 315,079,615 | 212,994,354 | 335,866,978 | 245,777,765 | 345,560,552 | 252,685,502 | 335,953,802 | 278,716,794 | Financial assets measured at fair value through other comprehensive income | |
| Investments in subsidiaries | – | – | – | – | – | – | – | – | Investments in subsidiaries | |
| Investment in associate | 63,111 | 55,907 | 63,749 | 53,190 | 63,096 | 62,361 | 60,428 | 64,155 | Investment in associate | |
| Property, plant and equipment and right-of-use assets | 25,674,949 | 22,051,532 | 25,232,279 | 21,993,257 | 25,001,485 | 21,705,618 | 24,744,634 | 25,386,630 | Property, plant and equipment and right-of-use assets | |
| Investment properties | 67,116 | 46,350 | 67,900 | 46,350 | 67,900 | 46,350 | 72,400 | 67,116 | Investment properties | |
| Intangible assets | 1,914,792 | 1,641,425 | 1,868,300 | 1,698,360 | 2,047,091 | 1,827,427 | 2,272,639 | 1,800,516 | Intangible assets | |
| Leasehold property | – | 101,251 | – | 100,889 | – | 100,525 | – | – | Leasehold property | |
| Deferred tax assets | 4,187,627 | 1,291,100 | 5,173,206 | 159,921 | 8,052,166 | 2,503,276 | 10,036,105 | 2,735,566 | Deferred tax assets | |
| Other assets | 20,983,814 | 25,749,941 | 21,168,312 | 24,090,018 | 24,600,114 | 22,879,328 | 27,083,177 | 20,195,153 | Other assets | |
|
Total assets |
1,824,300,621 | 1,473,271,581 | 1,934,724,691 | 1,566,655,020 | 1,962,460,741 | 1,663,084,470 | 1,983,491,144 | 1,762,496,153 |
Total assets |
|
|
Liabilities |
Liabilities |
|||||||||
| Due to banks | 80,049,153 | 76,515,510 | 103,006,874 | 73,955,005 | 80,540,568 | 82,499,159 | 73,801,195 | 88,248,056 | Due to banks | |
| Derivative financial liabilities | 4,388,511 | 2,987,717 | 2,609,946 | 1,915,067 | 3,017,891 | 1,533,809 | 2,092,198 | 1,501,262 | Derivative financial liabilities | |
| Securities sold under repurchase agreements | 96,228,787 | 42,014,953 | 113,577,165 | 64,224,587 | 132,578,610 | 81,100,405 | 151,424,854 | 91,411,522 | Securities sold under repurchase agreements | |
| Financial liabilities at amortised cost – Due to depositors | 1,346,539,936 | 1,120,368,799 | 1,405,045,018 | 1,155,219,967 | 1,447,888,478 | 1,221,756,923 | 1,472,640,456 | 1,286,616,399 | Financial liabilities at amortised cost – Due to depositors | |
| Financial liabilities at amortised cost – Other borrowings | 52,098,343 | 23,473,191 | 50,377,494 | 31,578,599 | 46,167,470 | 48,116,673 | 32,587,051 | 54,555,933 | Financial liabilities at amortised cost – Other borrowings | |
| Current tax liabilities | 7,588,842 | 5,324,474 | 8,775,280 | 5,221,850 | 8,737,272 | 6,444,772 | 9,486,772 | 6,991,005 | Current tax liabilities | |
| Deferred tax liabilities | 344,928 | 417,779 | 344,335 | 825,722 | 343,822 | 421,972 | 349,106 | 403,846 | Deferred tax liabilities | |
| Other liabilities | 39,132,442 | 26,541,214 | 46,354,848 | 50,978,826 | 31,862,811 | 37,249,718 | 33,253,518 | 33,572,283 | Other liabilities | |
| Due to subsidiaries | – | – | – | – | – | – | – | – | Due to subsidiaries | |
| Subordinated liabilities | 34,239,946 | 38,562,279 | 34,704,218 | 38,199,628 | 43,363,999 | 38,136,630 | 38,303,466 | 38,247,138 | Subordinated liabilities | |
|
Total liabilities |
1,660,610,888 | 1,336,205,916 | 1,764,795,178 | 1,422,119,251 | 1,794,500,921 | 1,517,260,061 | 1,813,938,616 | 1,601,547,444 |
Total Liabilities |
|
|
Equity |
Equity |
|||||||||
| Stated capital | 54,564,038 | 40,916,958 | 54,565,350 | 42,971,971 | 54,565,494 | 42,971,971 | 54,566,957 | 52,187,747 | Stated capital | |
| Statutory reserves | 9,287,728 | 8,387,701 | 9,287,728 | 8,391,150 | 9,287,728 | 8,391,150 | 10,590,338 | 9,285,233 | Statutory reserves | |
| Retained earnings | 7,254,535 | 5,864,374 | 12,848,919 | 7,414,964 | 19,680,594 | 11,213,907 | 9,890,762 | 8,124,261 | Retained earnings | |
| Other reserves | 90,696,736 | 80,208,291 | 91,273,009 | 84,077,287 | 82,402,906 | 81,537,813 | 92,426,660 | 89,595,571 | Other reserves | |
| Total equity attributable to equity holders of the Group/Bank | 161,803,037 | 135,377,324 | 167,975,006 | 142,855,372 | 165,936,722 | 144,114,841 | 167,474,717 | 159,192,812 | Total equity attributable to equity holders of the Group/Bank | |
| Non-controlling interest | 1,886,696 | 1,688,341 | 1,954,507 | 1,680,397 | 2,023,098 | 1,709,568 | 2,077,811 | 1,755,897 | Non-controlling interest | |
|
Total equity |
163,689,733 | 137,065,665 | 169,929,513 | 144,535,769 | 167,959,820 | 145,824,409 | 169,552,528 | 160,948,709 |
Total equity |
|
|
Total liabilities and equity |
1,824,300,621 | 1,473,271,581 | 1,934,724,691 | 1,566,655,020 | 1,962,460,741 | 1,663,084,470 | 1,983,491,144 | 1,762,496,153 |
Total liabilities and equity |
|
| Contingent liabilities and commitments | 800,865,904 | 622,815,977 | 744,326,170 | 602,842,021 | 674,796,325 | 680,543,307 | 685,379,028 | 730,561,685 | Contingent liabilities and commitments | |
| Net assets value per ordinary share (Rs.) | 135.49 | 131.75 | 140.66 | 135.83 | 138.95 | 137.03 | 140.24 | 136.42 | Net assets value per ordinary share (Rs.) | |
|
Quarterly growth (%) |
Quarterly growth (%) |
|||||||||
| Financial assets at amortised cost – Loans and advances to banks & loans and advances to other customers | 2.18% | 2.63% | 4.55% | –2.20% | 2.88% | 0.30% | 2.97% | 1.09% | Financial assets at amortised cost – Loans and advances to banks & loans and advances to other customers | |
| Financial liabilities at amortised cost – Due to depositors | 4.66% | 4.81% | 4.34% | 3.11% | 3.05% | 5.76% | 1.71% | 5.31% | Financial liabilities at amortised cost – Due to depositors | |
| Total assets | 3.51% | 4.57% | 6.05% | 6.34% | 1.43% | 6.16% | 1.07% | 5.98% | Total assets | |
Statement of Financial Position – Bank – 2020 and 2021
| 1st Quarter ended | 2nd Quarter ended | 3rd Quarter ended | 4th Quarter ended | |||||||
| As at | March 31, 2021 Rs. ’000 | March 31, 2020 Rs. ’000 | June 30, 2021 (Audited) Rs. ’000 | June 30, 2020 (Audited) Rs. ’000 | September 30, 2021 Rs. ’000 | September 30, 2020 Rs. ’000 | December 31, 2021 (Audited) Rs. ’000 | December 31, 2020 (Audited) Rs. ’000 | As at | |
|
Assets |
Assets |
|||||||||
| Cash and cash equivalents | 50,223,404 | 67,909,585 | 66,211,229 | 50,830,153 | 91,478,737 | 43,339,446 | 68,078,076 | 50,250,627 | Cash and cash equivalents | |
| Balances with Central Banks | 76,341,432 | 32,656,696 | 80,197,728 | 53,453,467 | 45,873,467 | 79,611,753 | 52,897,908 | 110,971,105 | Balances with Central Banks | |
| Placements with banks | 13,313,090 | 28,287,644 | 7,082,629 | 26,427,430 | 19,265,858 | 17,235,679 | 11,584,952 | 15,938,982 | Placements with banks | |
| Securities purchased under re-sale agreements | – | 10,448,494 | – | 7,209,397 | 2,697,359 | 445,577 | 3,000,490 | – | Securities purchased under re-sale agreements | |
| Derivative financial assets | 3,633,738 | 2,140,505 | 3,105,697 | 1,898,100 | 3,271,766 | 2,011,946 | 3,245,120 | 2,636,717 | Derivative financial assets | |
| Financial assets recognised through profit or loss – measured at fair value | 25,982,011 | 25,660,517 | 34,171,453 | 32,898,907 | 31,522,053 | 43,470,925 | 23,436,123 | 35,189,471 | Financial assets recognised through profit or loss – measured at fair value | |
| Financial assets at amortised cost – Loans and advances to banks | 829,740 | 792,189 | 837,037 | 776,550 | 833,952 | 773,422 | - | 779,705 | Financial assets at amortised cost – Loans and advances to banks | |
| Financial assets at amortised cost – Loans and advances to other customers | 916,062,889 | 907,415,058 | 957,384,317 | 887,251,878 | 984,845,846 | 888,862,548 | 1,014,618,580 | 896,845,453 | Financial assets at amortised cost – Loans and advances to other customers | |
| Financial assets at amortised cost – Debt and other financial instruments | 337,216,097 | 110,201,662 | 361,301,611 | 187,528,301 | 342,169,712 | 260,169,367 | 369,417,889 | 292,727,566 | Financial assets at amortised cost – Debt and other financial instruments | |
| Financial assets measured at fair value through other comprehensive income | 314,567,633 | 212,748,101 | 335,862,629 | 245,533,383 | 345,250,606 | 252,327,507 | 335,463,338 | 278,461,369 | Financial assets measured at fair value through other comprehensive income | |
| Investments in subsidiaries | 5,808,429 | 5,011,284 | 5,808,429 | 4,683,429 | 5,808,429 | 4,683,429 | 5,808,429 | 5,808,429 | Investments in subsidiaries | |
| Investment in associate | 44,331 | 44,331 | 44,331 | 44,331 | 44,331 | 44,331 | 44,331 | 44,331 | Investment in associate | |
| Property, plant and equipment and right-of-use assets | 23,997,196 | 20,053,178 | 23,544,270 | 19,964,308 | 23,246,255 | 19,672,332 | 23,075,467 | 23,212,394 | Property, plant and equipment and right-of-use assets | |
| Investment properties | – | – | – | – | – | – | – | – | Investment properties | |
| Intangible assets | 1,330,727 | 1,076,363 | 1,311,076 | 1,137,090 | 1,494,505 | 1,260,024 | 1,724,864 | 1,232,863 | Intangible assets | |
| Leasehold property | – | 70,477 | – | 70,242 | – | 70,006 | – | – | Leasehold property | |
| Deferred tax assets | 3,971,770 | 1,100,255 | 4,917,109 | – | 7,772,486 | 2,321,548 | 9,793,129 | 2,499,860 | Deferred tax assets | |
| Other assets | 20,879,920 | 25,647,724 | 21,108,274 | 23,893,406 | 24,542,510 | 22,751,766 | 27,024,475 | 19,619,149 | Other assets | |
|
Total assets |
1,794,202,407 | 1,451,264,063 | 1,902,887,819 | 1,543,600,372 | 1,930,117,872 | 1,639,051,606 | 1,949,213,171 | 1,736,218,021 |
Total assets |
|
|
Liabilities |
Liabilities |
|||||||||
| Due to banks | 79,383,054 | 74,075,132 | 102,474,262 | 72,163,605 | 80,362,973 | 81,003,276 | 73,777,420 | 87,451,306 | Due to banks | |
| Derivative financial liabilities | 4,388,511 | 2,987,717 | 2,609,946 | 1,915,067 | 3,017,891 | 1,533,809 | 2,092,198 | 1,501,262 | Derivative financial liabilities | |
| Securities sold under repurchase agreements | 96,267,906 | 42,159,141 | 114,066,400 | 64,448,218 | 133,030,525 | 81,145,001 | 151,911,842 | 91,437,612 | Securities sold under repurchase agreements | |
| Financial liabilities at amortised cost – Due to depositors | 1,321,759,956 | 1,104,634,005 | 1,378,167,491 | 1,138,170,145 | 1,420,186,722 | 1,203,658,867 | 1,443,093,453 | 1,265,965,918 | Financial liabilities at amortised cost – Due to depositors | |
| Financial liabilities at amortised cost – Other borrowings | 52,098,343 | 23,473,191 | 50,377,494 | 31,578,599 | 46,167,470 | 48,116,673 | 32,587,051 | 54,555,933 | Financial liabilities at amortised cost – Other borrowings | |
| Current tax liabilities | 7,381,495 | 5,053,931 | 8,532,714 | 4,938,966 | 8,508,147 | 6,328,897 | 9,294,180 | 6,777,992 | Current tax liabilities | |
| Deferred tax liabilities | – | – | – | 410,559 | – | – | – | – | Deferred tax liabilities | |
| Other liabilities | 39,067,270 | 26,300,217 | 46,172,569 | 50,610,310 | 31,794,069 | 36,733,042 | 33,210,883 | 33,037,669 | Other liabilities | |
| Due to subsidiaries | 96,676 | 80,711 | 98,567 | 65,786 | 80,785 | 121,071 | 48,699 | 97,015 | Due to subsidiaries | |
| Subordinated liabilities | 34,239,946 | 38,562,279 | 34,704,218 | 38,199,628 | 43,363,999 | 38,136,630 | 38,303,466 | 38,247,138 | Subordinated liabilities | |
|
Total liabilities |
1,634,683,157 | 1,317,326,324 | 1,737,203,661 | 1,402,500,883 | 1,766,512,581 | 1,496,777,266 | 1,784,319,192 | 1,579,071,845 |
Total liabilities |
|
|
Equity |
Equity |
|||||||||
| Stated capital | 54,564,038 | 40,916,958 | 54,565,350 | 42,971,971 | 54,565,494 | 42,971,971 | 54,566,957 | 52,187,747 | Stated capital | |
| Statutory reserves | 9,024,065 | 8,205,391 | 9,024,065 | 8,205,391 | 9,024,065 | 8,205,391 | 10,204,368 | 9,024,065 | Statutory reserves | |
| Retained earnings | 6,637,622 | 5,768,479 | 12,200,306 | 6,968,011 | 18,916,233 | 10,707,378 | 9,028,265 | 7,596,260 | Retained earnings | |
| Other reserves | 89,293,525 | 79,046,911 | 89,894,437 | 82,954,116 | 81,099,499 | 80,389,600 | 91,094,389 | 88,338,104 | Other reserves | |
| Total equity attributable to equity holders of the Group/Bank | 159,519,250 | 133,937,739 | 165,684,158 | 141,099,489 | 163,605,291 | 142,274,340 | 164,893,979 | 157,146,176 | Total equity attributable to equity holders of the Group/Bank | |
| Non-controlling Interest | – | – | – | – | – | – | – | – | Non-controlling Interest | |
|
Total equity |
159,519,250 | 133,937,739 | 165,684,158 | 141,099,489 | 163,605,291 | 142,274,340 | 164,893,979 | 157,146,176 |
Total equity |
|
|
Total liabilities and equity |
1,794,202,407 | 1,451,264,063 | 1,902,887,819 | 1,543,600,372 | 1,930,117,872 | 1,639,051,606 | 1,949,213,171 | 1,736,218,021 |
Total liabilities and equity |
|
| Contingent liabilities and commitments | 798,522,243 | 620,610,185 | 740,650,015 | 600,818,662 | 672,716,776 | 678,379,768 | 682,399,783 | 728,711,698 | Contingent liabilities and commitments | |
| Net assets value per ordinary share (Rs.) | 133.58 | 130.35 | 138.74 | 134.16 | 137.00 | 135.28 | 138.08 | 134.67 | Net assets value per ordinary share (Rs.) | |
|
Quarterly growth (%) |
Quarterly growth (%) |
|||||||||
| Financial assets at amortised cost – Loans and advances to banks & loans and advances to other customers | 2.14% | 2.57% | 4.51% | -2.22% | 2.87% | 0.18% | 3.02% | 0.90% | Financial assets at amortised cost – Loans and advances to banks & Loans and advances to other customers | |
| Financial liabilities at amortised cost – Due to depositors | 4.41% | 4.87% | 4.27% | 3.04% | 3.05% | 5.75% | 1.61% | 5.18% | Financial Liabilities at amortised cost – Due to depositors | |
| Total assets | 3.34% | 4.61% | 6.06% | 6.36% | 1.43% | 6.18% | 0.99% | 5.93% | Total assets | |
Decade at a Glance
|
SLFRSs
|
LKASs
|
||||||||||||
| As at December 31, Rs. Mn. | CAGR % | 2021 | 2020 | 2019 | 2018 | 2017 | 2016 | 2015 | 2014 | 2013 | 2012 | ||
| Assets | |||||||||||||
| Cash and cash equivalents | 68,078 | 50,251 | 52,535 | 39,534 | 33,225 | 30,194 | 20,044 | 20,592 | 14,262 | 19,733 | |||
| Balances with Central Banks | 52,898 | 110,971 | 39,461 | 54,385 | 44,801 | 43,873 | 28,221 | 19,634 | 18,432 | 18,168 | |||
| Placements with banks | 11,585 | 15,939 | 24,527 | 19,899 | 17,633 | 11,718 | 17,194 | 14,508 | 4,132 | 16,163 | |||
| Securities purchased under resale agreements | 3,000 | – | 13,148 | 9,514 | – | – | 8,002 | 41,198 | 8,946 | 3,697 | |||
| Derivative financial assets | 3,245 | 2,637 | 1,831 | 7,910 | 2,335 | 1,053 | 4,118 | 460 | 838 | 1,351 | |||
| Other financial instruments – Held for trading | – | – | – | – | 4,411 | 4,988 | 7,656 | 6,327 | 6,379 | 6,041 | |||
| Financial assets recognised through profit or loss – Measured at fair value | 23,436 | 35,189 | 21,468 | 5,520 | – | – | – | – | – | – | |||
| Loans and receivables to banks | 13.46 |
_edit-web-resources/image/677.png)
|
– | – | – | – | 641 | 624 | 601 | 551 | 546 | 629 | |
| Financial assets at amortised cost – Loans and advances to banks | – | 780 | 758 | 763 | – | – | – | – | – | – | |||
| Loans and receivables to other customers | – | – | – | – | 737,447 | 616,018 | 508,115 | 405,431 | 353,062 | 337,247 | |||
| Financial assets at amortised cost – Loans and advances to other customers | 1,014,619 | 896,845 | 884,646 | 861,100 | – | – | – | – | – | – | |||
| Financial investments – Held to maturity | – | – | – | – | 63,563 | 60,981 | – | – | – | – | |||
| Financial investments – Loans and receivables | – | – | – | – | 48,712 | 51,824 | 57,724 | 50,436 | 48,943 | 31,971 | |||
| Financial assets at amortised cost – Debt and other financial instruments | 369,418 | 292,728 | 101,145 | 83,855 | – | – | – | – | – | – | |||
| Financial investments – Available for sale | – | – | – | – | 154,714 | 160,023 | 204,244 | 214,208 | 131,757 | 57,963 | |||
| Financial assets measured at fair value through other comprehensive income | 335,463 | 278,461 | 197,568 | 176,507 | – | – | – | – | – | – | |||
| Total financial assets | 1,881,742 | 1,683,801 | 1,337,087 | 1,258,987 | 1,107,482 | 981,296 | 855,919 | 773,345 | 587,297 | 492,963 | |||
| Investments in subsidiaries | 5,808 | 5,808 | 5,011 | 4,264 | 3,066 | 2,435 | 1,237 | 1,211 | 289 | 303 | |||
| Investment in associate | 44 | 44 | 44 | 44 | 44 | 44 | 44 | 44 | 44 | 44 | |||
| Property, plant & equipment and right-of-use assets | 23,075 | 23,212 | 20,507 | 15,301 | 14,635 | 10,308 | 9,969 | 9,953 | 8,387 | 8,221 | |||
| Intangible assets | 1,725 | 1,233 | 1,080 | 906 | 777 | 641 | 466 | 439 | 468 | 497 | |||
| Leasehold property | – | – | – | 72 | 73 | 74 | 74 | 75 | 76 | 77 | |||
| Deferred tax assets | 9,793 | 2,500 | 294 | – | – | 964 | – | – | – | 449 | |||
| Other assets | 27,024 | 19,620 | 23,323 | 23,911 | 17,297 | 16,439 | 12,096 | 10,543 | 9,426 | 9,189 | |||
| Total assets | 16.01 | 1,949,213 | 1,736,218 | 1,387,346 | 1,303,485 | 1,143,374 | 1,012,201 | 879,805 | 795,610 | 605,987 | 511,743 | ||
| Liabilities | |||||||||||||
| Due to banks | 73,777 | 87,451 | 51,506 | 50,101 | 57,121 | 67,609 | 30,319 | 25,261 | 14,194 | 4,894 | |||
| Derivative financial liabilities | 2,092 | 1,501 | 1,495 | 8,022 | 3,678 | 1,515 | 1,891 | 1,193 | 1,412 | 84 | |||
| Securities sold under repurchase agreements | 151,912 | 91,438 | 51,220 | 49,104 | 49,677 | 69,867 | 112,385 | 124,564 | 45,519 | 31,760 | |||
| Due to other customers/deposits from customers | 16.12 |
_edit-web-resources/image/678.png)
|
– | – | – | – | 850,128 | 739,563 | 624,102 | 529,361 | 451,153 | 390,612 | |
| Financial liabilities at amortised cost – Due to depositors | 1,443,093 | 1,265,966 | 1,053,308 | 983,037 | – | – | – | – | – | – | |||
| Other borrowings | – | – | – | – | 23,786 | 9,270 | 9,986 | 11,637 | 8,654 | 15,823 | |||
| Financial liabilities at amortised cost – Other borrowings | 32,587 | 54,556 | 23,249 | 25,362 | – | – | – | – | – | – | |||
| Current tax liabilities | 9,294 | 6,778 | 4,968 | 6,566 | 4,144 | 3,441 | 3,002 | 1,998 | 1,759 | 2,802 | |||
| Deferred tax liabilities | – | – | – | 646 | 3,275 | – | 231 | 2,574 | 1,563 | 1,698 | |||
| Other provisions | – | – | – | – | – | 2 | 2 | 2 | 2 | 2 | |||
| Other liabilities | 33,211 | 33,038 | 30,497 | 24,208 | 19,225 | 17,710 | 15,547 | 17,444 | 9,827 | 10,363 | |||
| Due to subsidiaries | 49 | 97 | 54 | 41 | 75 | 20 | 26 | 19 | 16 | 22 | |||
| Subordinated liabilities | 38,303 | 38,247 | 37,887 | 37,992 | 25,166 | 24,850 | 11,973 | 11,045 | 10,944 | 1,106 | |||
| Total liabilities | 1,784,319 | 1,579,072 | 1,254,184 | 1,185,079 | 1,036,275 | 933,847 | 809,464 | 725,098 | 545,043 | 459,166 | |||
| Equity | |||||||||||||
| Stated capital | 54,567 | 52,188 | 40,917 | 39,148 | 37,144 | 24,978 | 23,255 | 21,458 | 19,587 | 18,009 | |||
| Statutory reserves | 10,204 | 9,024 | 8,205 | 7,354 | 6,477 | 5,648 | 4,922 | 4,327 | 4,035 | 3,433 | |||
| Retained earnings | 9,028 | 7,596 | 5,144 | 5,063 | 4,987 | 4,464 | 4,389 | 4,258 | 4,233 | 4,178 | |||
| Other reserves | 91,094 | 88,338 | 78,896 | 66,841 | 58,491 | 43,264 | 37,775 | 40,469 | 33,089 | 26,957 | |||
| Total liabilities and equity | 16.01 | 1,949,213 | 1,736,218 | 1,387,346 | 1,303,485 | 1,143,374 | 1,012,201 | 879,805 | 795,610 | 605,987 | 511,743 | ||
| Contingent liabilities and commitments | 682,400 | 728,712 | 579,999 | 658,722 | 564,795 | 498,305 | 521,232 | 352,453 | 295,452 | 279,593 | |||
|
SLFRSs
|
LKASs
|
||||||||||||
| For the year ended December 31, Rs. Mn. | CAGR % | 2021 | 2020 | 2019 | 2018 | 2017 | 2016 | 2015 | 2014 | 2013 | 2012 | ||
| Operating results | |||||||||||||
| Gross income | 13.37 | 160,886 | 149,711 | 148,706 | 138,049 | 114,357 | 93,143 | 77,868 | 72,753 | 73,736 | 63,395 | ||
| Interest income | 130,443 | 122,330 | 127,780 | 117,466 | 103,034 | 80,738 | 66,030 | 61,832 | 62,764 | 52,685 | |||
| Interest expense | (65,832) | (72,759) | (80,571) | (72,524) | (64,011) | (47,915) | (35,685) | (34,610) | (36,879) | (29,830) | |||
| Foreign exchange profit | 10,589 | 8,338 | 6,726 | 7,900 | 588 | 2,326 | 2,877 | 1,481 | 1,996 | 4,687 | |||
| Commission and other income | 16,195 | 17,031 | 12,082 | 12,683 | 10,735 | 10,079 | 8,961 | 9,440 | 8,976 | 6,023 | |||
| Operating expenses and impairment | (59,394) | (51,429) | (43,678) | (39,934) | (28,400) | (25,177) | (25,040) | (22,407) | (22,347) | (19,270) | |||
| Profit before tax | 11.37 | 32,001 | 23,511 | 22,339 | 25,591 | 23,183 | 20,051 | 17,143 | 15,736 | 14,510 | 14,295 | ||
| Income tax expense | (8,395) | (7,138) | (5,314) | (8,047) | (6,602) | (5,539) | (5,240) | (4,556) | (4,065) | (4,197) | |||
| Profit for the year | 11.59 | 23,606 | 16,373 | 17,025 | 17,544 | 16,581 | 14,512 | 11,903 | 11,180 | 10,445 | 10,098 | ||
| Ratios | |||||||||||||
| Return on average-shareholders’ funds (%) | 14.66 | 11.28 | 13.54 | 15.56 | 17.88 | 19.52 | 16.90 | 17.01 | 18.40 | 20.96 | |||
| Income growth (%) | 7.46 | 0.68 | 7.72 | 20.72 | 24.10 | 19.62 | 7.03 | 0.96 | 16.31 | 38.24 | |||
| Return on average assets (%) | 1.28 | 1.05 | 1.27 | 1.43 | 1.54 | 1.53 | 1.42 | 1.60 | 1.87 | 2.12 | |||
| Ordinary share dividend cover (times) | 2.64 | 2.34 | 2.55 | 2.67 | 2.62 | 2.25 | 2.09 | 1.99 | 1.89 | 1.86 | |||
| Advances to deposits and refinance (%) | 73.54 | 72.96 | 86.74 | 86.96 | 86.07 | 82.69 | 80.84 | 75.89 | 77.48 | 82.01 | |||
| Property, plant and equipment to shareholders’ funds (%) | 15.04 | 15.56 | 16.21 | 13.75 | 14.46 | 14.07 | 14.94 | 14.85 | 14.65 | 16.73 | |||
| Total assets to shareholders’ funds (times) | 11.82 | 11.05 | 10.42 | 11.01 | 10.68 | 12.92 | 12.51 | 11.28 | 9.94 | 9.73 | |||
| Capital funds to liabilities including contingent liabilities (%) | 6.68 | 6.81 | 7.26 | 6.42 | 6.69 | 5.47 | 5.29 | 6.54 | 7.25 | 7.12 | |||
| Cost/income ratio (%) | 37.97 | 39.96 | 49.41 | 46.35 | 51.08 | 51.06 | 48.92 | 49.26 | 45.59 | 47.02 | |||
| Liquid assets ratio – Domestic Banking Unit (DBU) (%) | 38.73 | 44.99 | 30.42 | 24.47 | 27.28 | 27.19 | 26.24 | 33.15 | 33.66 | 25.40 | |||
| Liquid assets ratio – Offshore Banking Centre (OBC) (%) | 36.39 | 32.70 | 25.25 | 30.20 | 30.95 | 30.19 | 49.13 | 31.43 | 29.38 | 34.16 | |||
| (As specified in the Banking Act No. 30 of 1988) | |||||||||||||
| Group capital adequacy (%) (under Basel II) Tier I | N/A | N/A | N/A | N/A | N/A | 11.59 | 11.55 | 13.07 | 13.30 | 12.63 | |||
| Tier I & II | N/A | N/A | N/A | N/A | N/A | 16.01 | 14.28 | 16.22 | 16.93 | 13.84 | |||
| Group capital adequacy (%) (under Basel III) | |||||||||||||
| Common equity Tier I capital ratio | 12.05 | 13.36 | 12.40 | 11.43 | 12.12 | – | – | – | – | – | |||
| Tier I capital ratio | 12.05 | 13.36 | 12.40 | 11.43 | 12.12 | – | – | – | – | – | |||
| Total capital ratio | 15.70 | 16.88 | 16.18 | 15.62 | 15.70 | – | – | – | – | – | |||
| Share information | |||||||||||||
| Market value of a voting ordinary share (Rs.) | 79.30 | 80.90 | 95.00 | 115.00 | 135.80 | 145.00 | 140.20 | 171.00 | 120.40 | 103.00 | |||
| Earnings per share (Rs.) | 20 | 15 | 17 | 17 | 17 | 16 | 13 | 13 | 12 | 12 | |||
| Dividend per share (Rs.) | 7.50 | 6.50 | 6.50 | 6.50 | 6.50 | 6.50 | 6.50 | 6.50 | 6.50 | 6.50 | |||
| Price earnings ratio (times) | 4 | 5 | 5 | 7 | 8 | 9 | 10 | 13 | 10 | 9 | |||
| Net assets value per share (Rs.) | 138 | 135 | 130 | 117 | 108 | 88 | 80 | 81 | 72 | 63 | |||
| Earnings yield (%) | 19 | 19 | 17 | 15 | 13 | 11 | 10 | 8 | 10 | 12 | |||
| Gross dividends (Rs. Bn.) to ordinary shareholders | 8.96 | 7.59 | 6.68 | 6.57 | 6.48 | 5.77 | 5.70 | 5.70 | 5.52 | 5.42 | |||
| Dividend payout ratio (%) – Cash | 22 | 32 | 27 | 26 | 26 | 28 | 33 | 35 | 37 | 37 | |||
| Total dividend payout ratio (%) | 38 | 46 | 39 | 37 | 38 | 40 | 48 | 50 | 53 | 54 | |||
| Other information | |||||||||||||
| Number of employees | 5,072 | 5,057 | 5,062 | 5,027 | 4,982 | 4,987 | 4,951 | 4,852 | 4,730 | 4,602 | |||
| Number of delivery points – Sri Lanka | 2.24 |
|
268 | 268 | 268 | 266 | 261 | 255 | 246 | 239 | 235 | 227 | |
| Number of delivery points – Bangladesh | 19 | 19 | 19 | 19 | 19 | 19 | 18 | 18 | 18 | 17 | |||
| Number of automated teller machines | 6.01 | 921 | 906 | 885 | 850 | 775 | 677 | 640 | 625 | 604 | 572 | ||
CAGR – Compound Annual Growth Rate
Group Structure
| Local Subsidiaries | Local Associate | Foreign Subsidiaries | ||||||||||||||||
|
Commercial Development Company PLC
|
CBC Tech Solutions Ltd.
|
CBC Finance Limited
|
Commercial Insurance Brokers (Pvt) Ltd.
|
Equity Investments Lanka Limited
|
Commex Sri Lanka S.R.L. – Italy
|
Commercial Bank of Maldives Private Limited
|
CBC Myanmar Microfinance Company Limited
|
|||||||||||

|

|

|

|

|

|

|

|
|||||||||||
| Incorporated on | March 14, 1980 in Sri Lanka | February 17, 2003 in Sri Lanka | February 18, 1987 in Sri Lanka | August 17, 1987 in Sri Lanka | August 8, 1990 in Sri Lanka | December 2, 2008 in Italy | March 24, 2015 in Maldives | April 4, 2017 in Myanmar | Incorporated on | |||||||||
| Bank’s Holding |
 90.00%
|
 100%
100%
|
 100%
100%
|
 60.00%
|
 22.92%
|
 100%
100%
|
 55%
55%
|
 100%
100%
|
Bank’s Holding | |||||||||
| Principal Business Activities | Property development and provision of other utility services | Providing Information & Communication Technology (ICT) related products, services and solutions to corporate sector | Granting of leasing & hire purchase facilities, mortgage loans and other loan facilities. Accepting public deposits. | Insurance Brokering | Venture Capital Financing | Money Transfer and Money Exchange | Banking | Microfinancing | Principal Business Activities | |||||||||
| Business Address | 4th Floor, No. 8-4/2, York Arcade Building, Leyden Bastian Road, Colombo 01. | “Commercial House”, No. 21, Sir Razik Fareed Mawatha, Colombo 01. | No. 187, Katugastota Road, Kandy. | No. 347, Dr Colvin R De Silva Mawatha, Colombo 02. | No. 108 A, 2/1, Maya Avenue, Colombo 06. | No. 34, Via Giacomo Leopardi, Rome, Italy. | H Filigasdhoshuge, Ameer Ahmed Magu, K. Male 20066, Maldives. | No. 15, Office Street, Ward 4, Lewe Township, Nay Pyi Taw, Myanmar. | Business Address | |||||||||
| Contact Numbers | +94 11 244 7300 | +94 11 257 4417 +94 11 257 4407 | +94 81 221 3498 +94 81 220 0272 | +94 11 760 0600 | +94 11 2507605 +94 11 5373745 +94 11 5373746 | +96 03332668 | +95 6730566 | Contact Numbers | ||||||||||
| Board of Directors | Board of Directors | |||||||||||||||||
| Chairman | B R L Fernando | Prof A K W Jayawardane | K G D D Dheerasinghe | M P Jayawardena | M J C Amarasuriya | K D N Buddhipala | Ahmed Nazeer | K G D D Dheerasinghe | Chairman | |||||||||
| Managing Director/Chief Executive Officer | S Renganathan | D M U N Dissanayaka ** | T D Thomas | Ronnie Daniel * | Dilan Rajapakse ** | R C P Kalugamage | Managing Director/ Chief Executive Officer | |||||||||||
| Chief Executive Officer | R N De Silva * | Keerthi Mediwake * | A H M Riyaz * | Chief Executive Officer | ||||||||||||||
| Director | A L Gooneratne | K D N Buddhipala | Dr (Ms) J P Kuruppu | D M D K Thilakaratne | Deshamanya S E Captain | J Premanath | S Renganathan | Mrs S A Walgama | Director | |||||||||
| Director | A T P Edirisinghe | K S A Gamage | R Senanayake | U I S Thilakawardena | J D Peiris | U K P Banduwansa | S C U Manatunge | K A P Perera | Director | |||||||||
| Director | L D A Jayasinghe | S Prabagar | S M S C Jayasuriya | D J D P Hettiarachchi | J B Abu Baker | Giancarlo Dolente | U I S Thilakawardena | D J D P Hettiarachchi | Director | |||||||||
| Director | U I S Thilakawardena | D S Bandara | W M N S K Weerapana | W I Arambage | Dr (Ms) Antonia Coppola | Dr Ibrahim Vishan | Director | |||||||||||
| Director | L H Munasinghe | L W P Indrajith | K C Vignarajah | Ms Fareeha Shareef | Director | |||||||||||||
| Director | M H Wijewaradene | Ms Aishath Zahira | Director | |||||||||||||||
| Director | J A D J Christie Nanayakkara | Director | ||||||||||||||||
| Company Secretary | L W P Indrajith | M P Dharmasiri | Ms H D U O Gurnasekara | Ms Y A Kularathna | Mrs R R Dunuwille | Mrs N Gamage | Ms Aminath Nashadil | R C P Kalugamage | Company Secretary | |||||||||
* Not a Board Member ** Managing Director and Chief Executive Officer
Summary of Financial Information
| 2021 | 2020 | 2021 | 2020 | 2021 | 2020 | 2021 | 2020 | 2021 | 2020 | 2021 | 2020 | 2021 | 2020 | 2021 | 2020 | |||||||||||
| Rs. Mn. | Rs. Mn. | Rs. Mn. | Rs. Mn. | Rs. Mn. | Rs. Mn. | Rs. Mn. | Rs. Mn. | Rs. Mn. | Rs. Mn. | Rs. Mn. | Rs. Mn. | Rs. Mn. | Rs. Mn. | Rs. Mn. | Rs. Mn. | |||||||||||
| Total assets | 3,785.349 | 3,449.510 | 461.022 | 354.779 | 10,311.545 | 8,482.598 | 705.396 | 711.027 | 374.086 | 496.708 | 87.501 | 588.994 | 30,042.751 | 21,712.188 | 394.538 | 524.172 | Total assets | |||||||||
| Total liabilities | 457.986 | 454.405 | 58.643 | 107.764 | 7,058.035 | 5,284.046 | 142.943 | 177.405 | 125.262 | 226.199 | 112.257 | 503.450 | 26,258.969 | 18,572.641 | 33.976 | 38.429 | Total liabilities | |||||||||
| Net assets | 3,327.363 | 2,995.105 | 402.379 | 247.015 | 3,253.510 | 3,198.552 | 562.453 | 533.622 | 248.824 | 270.509 | (24.756) | 85.544 | 3,783.782 | 3,139.547 | 360.562 | 485.743 | Net assets | |||||||||
| Total revenue | 632.287 | 454.906 | 354.303 | 348.301 | 1,264.114 | 1,049.982 | 204.239 | 255.268 | 41.059 | 49.129 | 13.461 | 35.342 | 1,529.550 | 1,167.493 | 52.965 | 102.180 | Total revenue | |||||||||
| Profit before tax | 427.265 | 171.273 | 156.761 | 131.533 | 140.908 | 110.037 | 35.784 | 42.167 | 8.272 | 17.006 | (113.941) | (75.019) | 568.352 | 382.717 | (37.807) | 17.181 | Profit before tax | |||||||||
| Profit after tax | 401.506 | 122.582 | 181.134 | 94.648 | 51.612 | 58.477 | 30.286 | 32.078 | 8.272 | 17.006 | (113.941) | (104.460) | 426.986 | 274.214 | (30.370) | 12.428 | Profit after tax | |||||||||
| Dividend per share (Rs.) | 6.50 | 5.50 | 50.00 | 50.00 | – | – | 33.33 | 35.00 | 1.00 | – | – | – | – | Dividend per share (Rs.) |