The business model of a bank primarily centres around the two activities of financial intermediation and maturity transformation. With substantially lower Return on Assets (ROA), these activities encourage and enable banks to operate at higher levels of gearing in order to generate returns to the investors attractive in terms of Return on Equity (ROE). However, they expose banks to a multitude of industry specific risks over and above those that other organisations have to face, making it imperative that banks have solid frameworks to manage associated risks. It is an effective risk management system that enables banks to optimise the trade-off between risk and return.
In addition, certain emerging global developments are now threatening to disrupt the conventional business models of banks. These include digitalisation, unorthodox competition from FinTechs and TechFins, exponential technologies such as artificial intelligence, robotics and Blockchain, demographic changes, tightening regulations on supervision, anti-money laundering and privacy laws, cyber threats, increasing concerns on sustainability etc. ( refer for a list of such emerging developments). In particular, these developments have elevated the magnitude of strategic risks for banks. In such context, the Bank set up a Board Strategy Development Committee during the year (terms of reference, authority, activities undertaken, etc. of the Committee is given in the section on Board Committee Reports in the chapter on Governance. A study published in Harvard Business Review (July-August 2015) in fact found strategic risks to be the most damaging type of risk for companies now. Since they offer both potential for opportunities and significant risks, they call for a more focused strategy to evolve the business model to ensure sustainability of banks. Risk management needs to take these developments too into consideration when devising measures for managing risk.
Certain macroeconomic shocks and regulatory developments made things even more complicated and dynamic for the Sri Lankan financial services industry. Year 2018 was characterised by lackluster economic growth, unprecedented level of rupee depreciation, import restrictions, rising interest rates, one-time impact of SLFRS 9 adoption, phased in implementation of Basel III Framework, political instability and lack of policy consistency. Banking Sector felt the impact of these developments in the form of deteriorating asset quality, rising impairment costs, lower interest margins, escalating costs – all leading to lower levels of profitability.
Commercial Bank has a sound Risk Management Framework (RMF) with necessary oversight of the Board of Directors, for identifying, assessing, measuring, mitigating, monitoring and reporting risks, enabling such risks to be prudently managed. The Bank is cognisant of the fact that it needs to strengthen this framework on an ongoing basis in the wake of increasing intensity of regulatory supervision and various emerging developments.
Objectives of risk management
The primary objectives of the risk management function of the Bank are:
to assist in decisions relating to accepting, transferring, mitigating and minimising risks and recommending ways of doing so;
to evaluate the risk profile against the approved risk appetite on an ongoing basis;
to estimate potential losses that could arise from risk exposures assumed;
to periodically conduct stress testing to ensure that the Bank holds sufficient buffers of capital and liquidity to meet unexpected losses and honour contractual obligations;
to integrate risk management with strategy development and execution; and
to institutionalise a strong risk culture within the Bank.
Key development in 2018
SLFRS 9 implementation
Bank implemented SLFRS 9 which became effective from January 1, 2018, during the year. This Accounting Standard requires impairment provisioning to be based on forward looking expected credit loss model using statistical computation of Exposure at Default (EAD), Probability of Default (PD) and Loss Given Default (LGD). Further, the off-balance sheet exposures are also subjected to impairment under the new Accounting Standard. The permitted changes on account of the “Day 1” impact of the migration of SLFRS 9 was adjusted against the bank’s retained earnings brought forward to 2018, resulting in a net assets reduction by Rs. 5.3 Bn. The Bank has been preparing for this development over the past several years by focusing on capital planning strategies to withstand the impact associated with such changes.
Other developments
Other key initiatives, developments and outcomes relating to risk management during the year included:
Intensified focus on maintaining asset quality and cybersecurity;
Expanded coverage of the credit risk review to 41.3% of the total portfolio (against the CBSL minimum requirement of 30% – 40%) and provided feedback on credit evaluation for continuous improvement;
Conducted SEMS evaluation on all facilities which may have social and environmental implications;
Obtained CBSL approval to move into Alternative Standardised Approach for operational risk computation which has resulted in a capital saving;
Further enhanced the scope of Risk Control Self-Assessment by onboarding several more business functions/processes;
Initiated a process for Root Cause Analysis of cash management related risk events in order to determine the adequacy of controls associated with the incidents;
Information Security Management System of the Bank was re-validated by external auditors and recommended for renewal of the ISO/IEC 27001:2013 certification; and
Mobile banking application of the Bank was externally validated for adherence to minimum compliance standards for payment related mobile applications, issued by the CBSL during 2018.
Overall risk profile of the Bank underwent changes with regard to credit quality, interest rate and FX rate related risks during 2018. Despite the formidable challenges in the operating environment, as a result of the strategic responses to these developments and the rigorous risk management framework in place, the Bank was able to successfully strengthen its stability and resilience, and enhance profitability during the year as evident from the operating results posted for the year.
Risk appetite and risk profile of the Bank
The Bank has a clearly defined Risk Appetite Statement incorporating the strategic focus, the types of risk and the maximum amount of aggregate risk exposure the Bank is prepared to assume at any given point in time. Taking into account the regulatory requirements, the ability to withstand losses and stress with the available capital, funding and liquidity positions and the quality of the risk management framework, risk appetite has been expressed in terms of desired asset quality, maximum operational losses, maximum loss on forex operations, minimum liquid assets ratio and maximum repricing gaps on interest rate risk, among other exhaustive list of risk parameters in use to ascertain overall risk profile of the Bank.
Aided by the solid risk management framework, the Bank monitors its risk profile which is the actual risk exposures across all the risk categories on an ongoing basis and takes swift remedial action for any deviations to ensure that it is kept within the risk appetite. With a stable capital adequacy and a strong liquidity position which define the capacity to assume risk, the Bank’s risk profile is characterised by a portfolio of high quality assets and stable sources of funding fairly diversified in terms of geographies, sectors, products, currencies, size and tenors.
Risk profile as at December 31, 2018 and December 31, 2017 compared to risk appetite as defined by the policy parameters is given below:
Table – 15
Risk category and parameter
Key risk indicator
Policy parameter
Actual position
31.12.2018
31.12.2017
Credit risk:
Quality of lending portfolio
Gross NPA ratio
4% – 5%
3.24%
1.88%
Net NPA ratio
2.5% – 3.5%
1.71%
0.92%
Impairment percentage over total NPA
85% – 60%
61.45%
74.23%
Weighted average rating score of the overall lending portfolios
35% – 40%
56.62%
57.63%
Concentration
Loans and advances by product – Highest exposure to be maintained as a percentage of the total loan portfolio
30% – 40%
20.43%
21.46%
Advances by economic sub sector (using HHI-Herfindahl-Hirschman-index)
0.015 – 0.025
0.0151
0.016
Exposures exceeding 5% of the eligible capital (using HHI)
0.05 – 0.10
0.0056
0.0071
Exposures exceeding 15% of the eligible capital (using HHI)
0.10 – 0.20
0.0067
0.0095
Exposure to any sub sector to be maintained at
4% – 5%
4.75%
4.04%
Aggregate of exposures exceeding 15% of the eligible capital
20% – 30%
20.32%
24.71%
Cross border exposure
Rating of the highest exposure of the portfolio on S&P Investment Grade – AAA to BBB-
AA
AAA
AAA
Market risk:
Interest rate risk
Interest rate shock:
(Impact to NII as a result of 100bps parallel rate shock for LKR and 25bps for FCY)
Maximum of
Rs. 2,250 Mn.
1,538.85 Mn.
Rs. 1,243.61 Mn.
Repricing gaps (RSA/RSL in each maturity bucket – up to one year period)
<1.5 Times
(other than for the
1 month bucket
which is <2.5 Times)
0.98 Times(2.99 times for 1 month bucket)
0.89 Times
(2.34 times for
1 month bucket)
Operational risk
Operational loss tolerance limit (as a percentage of last three years average gross income)
The Bank is rated AA(lka)/Stable by Fitch Ratings Lanka Limited while its Bangladesh operations is rated AAA by Credit Rating Information and Services Limited (CRISL). The rating of AA(lka) is the strongest rating given to a Sri Lankan non-state sector bank while AAA is the highest credit rating given to any financial institution in Bangladesh by CRISL. These credit ratings depict the creditworthiness of the Bank and its ability to borrow which in turn takes into account the underlying risk profile.
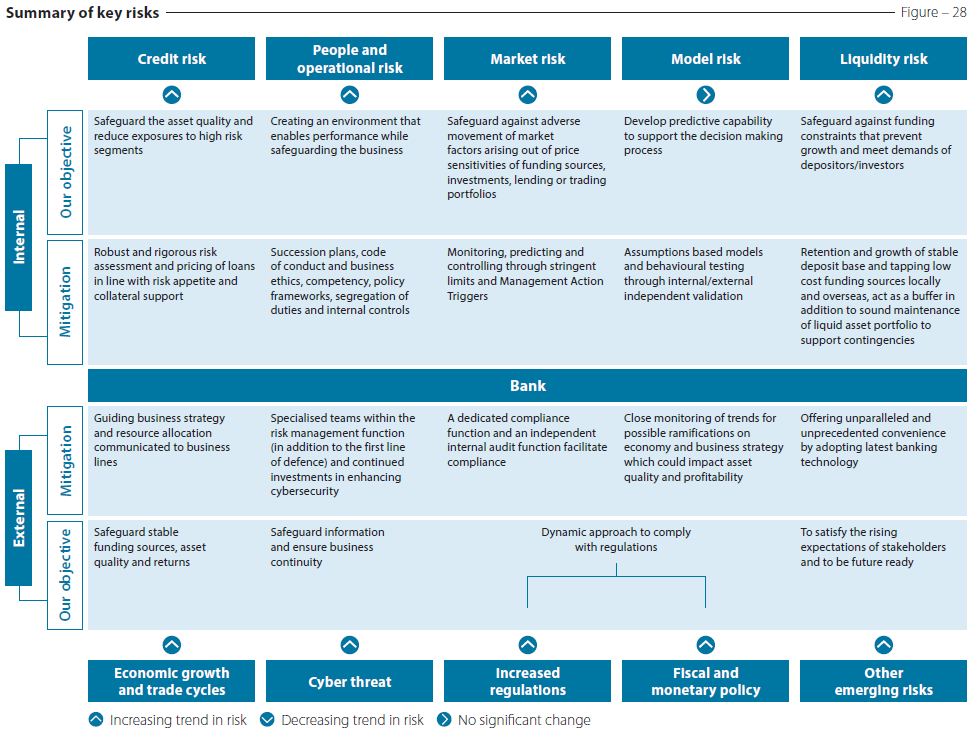
Types of risks
Conventionally, the Bank is exposed to credit, market, liquidity, operational, reputational, IT, legal and strategic risks which taken together determine the risk profile of the Bank. The Bank manages these risks through its robust risk management framework. Changes in various external and internal factors affect the risk profile on an ongoing basis. External factors include movements in macroeconomic variables, political instability, changes in Government fiscal and monetary policies, regulatory developments and growing stakeholder pressures. Such developments could impact disposable income of people, demand for banking products and services, funding mix, interest margins and tax liabilities of the Bank. Internal factors may include lapses in implementing the risk management framework, assumptions about macroeconomic variables turning out to be different, execution gaps in internal processes etc. Unlike internal factors which are inherently undesirable, external factors may at times have upside potential for banks to leverage. These factors, if not properly managed, may affect the risk profile of the Bank, hampering the objective of creating value for all its stakeholders through financial sustainability, overall stability and superior performance.
In addition, the Bank has identified certain potentially disruptive emerging risks and uncertainties. These have made the operating environment even more volatile and unpredictable for financial services institutions, leading to some of the long-standing assumptions about markets, competition and even business fundamentals to be less valid today. These call for the Bank to better understand the customer and deliver on their expectations while achieving execution excellence in internal processes. Believing that these offer opportunities to differentiate its value proposition for future growth, the Bank deals with these developments through appropriate strategic responses.
All these developments have made the operating environment very complex, dynamic and competitive and risk management very challenging. Nevertheless, the effective management of these risks and uncertainties is a sine qua non to the execution of the Bank’s strategy, creating value in the short, medium and long term for all its stakeholders. Hence, deliberations on risk management were on top of the agenda in all Board, Board Committee, and Executive Committee meetings of the Bank.
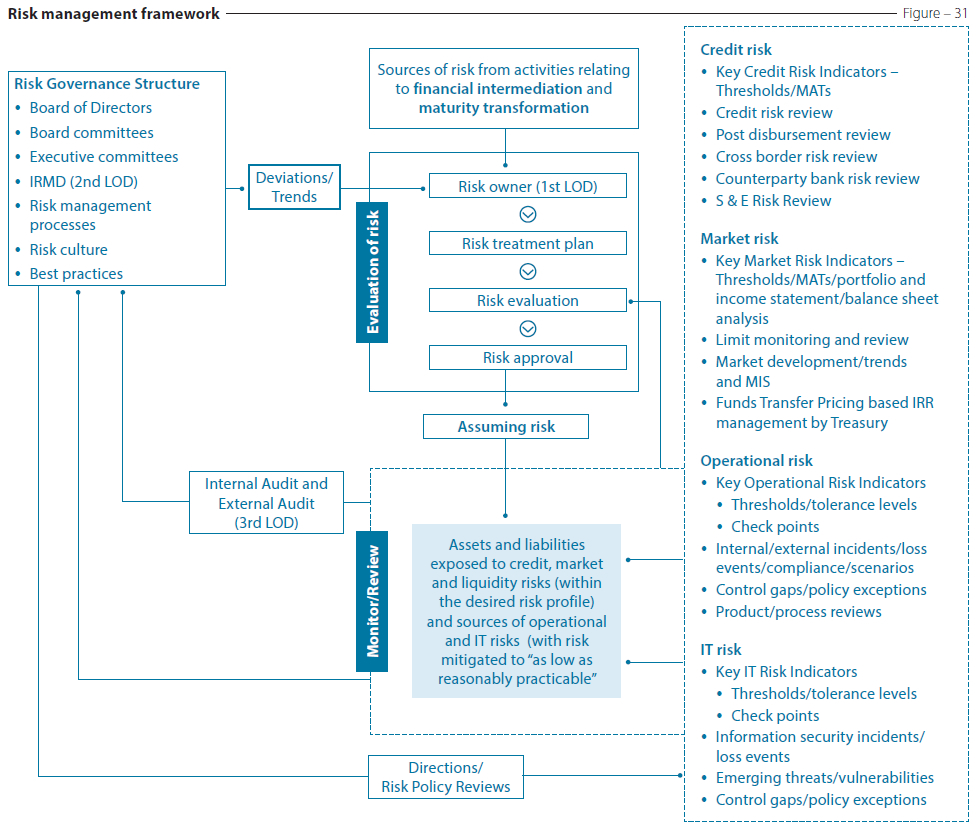
Risk management framework
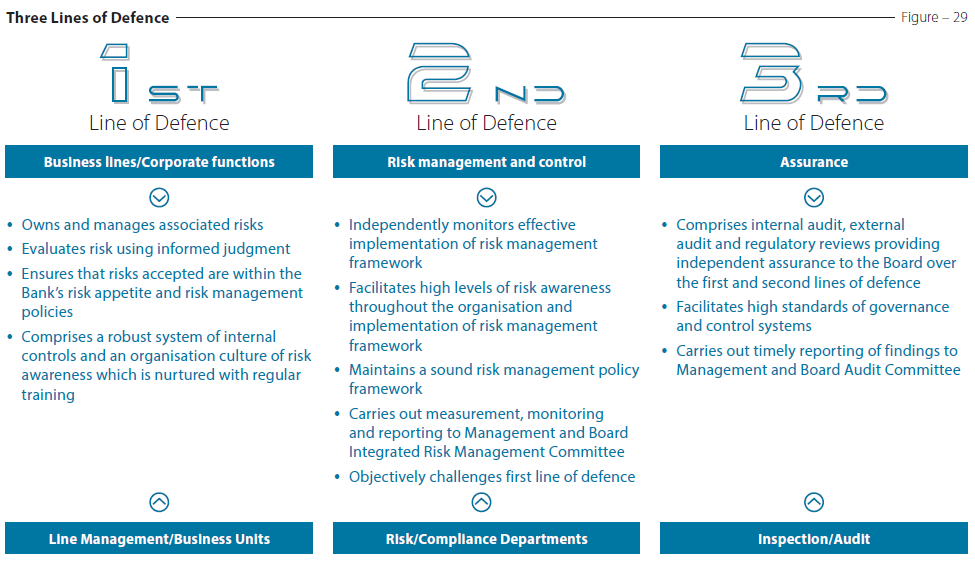
In order to ensure a structured approach to managing all its risk exposures, the Bank has developed an overarching risk management framework based on the Three Lines of Defence model. Underpinned by rigorous organisational structures, systems, processes, procedures, and industry best practices, Risk Management Framework (RMF) takes into account all plausible risks and uncertainties the Bank is exposed to. The Three Lines of Defence model, which is the international standard, enables the Bank to have unique perspectives and specific skills for managing risk and guides its day-to-day operations with the optimum balance of responsibilities.
The components of the Bank’s RMF include risk governance comprising Board oversight, Management and respective committees, well-defined risk capacity, appetite and tolerance levels, Risk Control Self-Assessment, system of internal control, independent compliance and audit functions, infrastructure, risk culture and contingency planning for business continuity, disaster recovery and contingency funding.
RMF is subject to an annual review or more frequently if the circumstances so warrant, taking into account changes in the regulatory and operating environments.
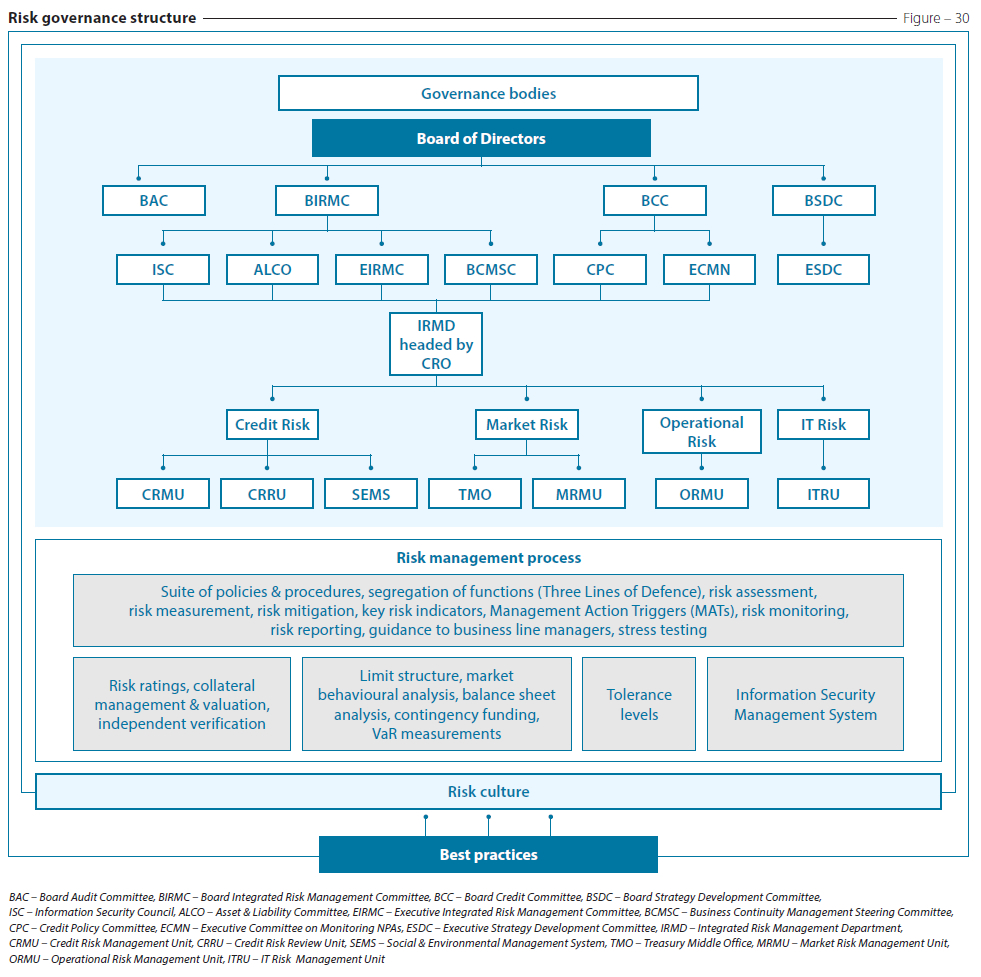
Risk governance
As an essential element of the risk management framework, risk governance is basically the application of the best practice in corporate governance to risk management, comprising Board oversight, Board committees, executive functions and executive committees through which authority is exercised and decisions are taken and implemented. It facilitates accountability for risk at all levels of the Bank and across all risk types the Bank is faced with, enabling a disciplined approach to managing risk. The organisation of the Bank’s risk governance is given in Figure 30. Given the highly specialised nature and also in the interest of an integrated and consistent approach, decision-making on risk management is centralised to a greater extent in several risk management committees.
Board of Directors
As the body responsible for strategy and policy formulation, objective setting and for overseeing executive function, the Board of Directors has the overall responsibility for understanding the risks assumed by the Bank and the Group and for ensuring that they are appropriately managed. The Board discharges this responsibility directly by determining the risk appetite of the Bank which is strongly correlated to achieving its strategic goals and indirectly by delegating oversight responsibility to four Board committees which work closely with the executive functions and executive level committees to review and assess the effectiveness of the risk management function and report to the Board on a regular basis. These reports provide a comprehensive perspective of the Bank’s risk management efforts and outcomes, enabling the Board to identify the risk exposures, any potential gaps and mitigating actions necessary, on a timely basis. The tone at the top and the corporate culture reinforced by the ethical leadership of the Board play a key role in managing risk at the Bank.
Besides the tone at the top and the Three Lines of Defence, the ethical conduct of the business too plays a significant role in managing risk in the Bank. The Bank’s Code of Ethics sets out the Bank’s unwavering commitment and expectations of all the employees to undertaking business in a responsible, transparent and disciplined manner and demands the highest level of honesty, integrity and accountability from all employees.
Apart from the Bank, the Board of Directors carefully monitors the risk profile of all the subsidiaries in the Group; Commercial Development Company PLC, ONEzero Company Limited. Serendib Finance Limited, Commex Sri Lanka S.R.L. Italy, Commercial Bank of Maldives Private Limited and CBC Myanmar Microfinance Company Limited.
Board committees
The Board has setup four Board committees to assist it in discharging its oversight responsibilities for risk management. The four Board committees are:
Board Strategy Development Committee (BSDC)-set up in August 2018
Among other things, these committees periodically review and make recommendations to the Board on risk appetite, risk profile, strategic decisions, risk management and internal controls framework, risk policies, limits and delegated authority.
Details relating to composition, terms of reference, authority, meetings held and attendance, activities undertaken during the year etc., of each of these Board committees are given on pages 89 to 101.
Executive committees
Responsibility for the execution of the strategies and plans in accordance with the mandate of the Board of Directors while maintaining the risk profile within the approved risk appetite, rests with the Executive Management. Spearheaded by the Executive Integrated Risk Management Committee (EIRMC), a number of committees (listed below) on specific aspects of risk have been set up to facilitate risk management across the First and the Second Lines of Defence. Comprising members from units responsible for credit risk, market risk, liquidity risk, operational risk and IT risk, EIRMC coordinates communication with the BIRMC to ensure that risk is managed within the risk appetite. Details relating to composition of each of the executive committees are given in the section on “How We Govern”.
Asset and Liability Committee (ALCO)
Credit Policy Committee (CPC)
Executive Committee on Monitoring Non-Performing Advances (ECMN)
Information Security Council (ISC)
Business Continuity Management Steering Committee (BCMSC)
Integrated Risk Management Department (IRMD) is headed by the Chief Risk Officer who participates in the above executive committees and also participates in the four Board committees overseeing risk management. The IRMD independently monitors compliance of the First Line of Defence to the laid down policies, procedures and limits and escalates deviations to the relevant executive committees. It also provides the perspective on all types of risk for the above committees to carry out independent risk evaluations and share their findings with the Line Managers and Senior Management to ensure effective communication of material issues and to initiate deliberations and necessary action.
Risk management infrastructure
Risk management infrastructure of the Bank includes both human and physical resources that enhance the preparedness to identify and manage risk including the mandate, policies and procedures, limits, tools, databases, competencies, communication etc. Significant investments have been made in resources to build capacity in risk management infrastructure and to maintain it up to date by embracing international best practices. This is as part of the overall risk management system in line with the Board-approved roadmap in the direction of achieving a fully-fledged risk management system in the near future.
Given that managing risk is a responsibility of each and every employee of the Bank for which each and every employee needs to understand the risks the Bank is exposed to, IRMD provides appropriate training/awareness to the employees, risk owners in particular, disseminating knowledge and enhancing skills on all aspects related to risk, inculcating the desired risk culture.
Risk management policy, procedures and limits
The Bank has a comprehensive risk management policy that addresses all the risks managed by the Bank, encompassing compliance with the regulatory requirements including the Banking Act Direction No. 07 of 2011 – Integrated Risk Management Framework for Licensed Commercial Banks based on the Basel Framework and subsequent directives issued by the CBSL. Apart from institutionalising the risk knowledge base, this helps minimise bias and subjectivity in risk decisions. This key document clearly defines the objectives, outlines priorities and processes and roles of the Board and the Management in managing risk, shaping the risk culture of the Bank. The Risk Assessment Statement (RAS) sets out the limits for risks and forms an integral part of the risk management framework. The RAS and all risk policies are reviewed by the BIRMC and Board of Directors at least annually or more frequently depending on the regulatory and business needs.
The overall risk exposure of the Bank including its overseas operations is compliant with the regulatory framework of the CBSL. Additionally, in order to ensure compliance, the risk management framework takes into account the regulatory requirements of the respective countries where the Bank conducts its operations.
The Bank has issued detailed operational guidelines to facilitate implementation of the risk management policy and the limits specified in the RAS. These guidelines relate to specification of types of facilities, processes and terms and conditions under which the Bank conducts business, providing clarity to the employees in their day-to-day work.
Risk management tools
The Bank employed a combination of qualitative and quantitative tools for identifying, measuring, managing and reporting risks. The choice of a tool(s) for managing a particular risk depended on the likelihood of occurrence and the impact of the risk as well as the availability of data. These tools varied from threat analysis, risk policies, risk registers, risk maps, risk dashboards, diversification, Social and Environmental Management System, workflow-based operational risk management system, insurance and benchmarking to limits, gap analysis, NPV analysis, swaps, caps and floors, hedging, risk rating, risk scoring, risk modelling, duration, scenario analysis, marking to market, stress testing and VaR analysis.
A description of the different types of risks managed by the risk management function of the Bank and risk mitigation measures adopted are as follows:
Credit risk is the risk of potential loss resulting from the failure of a customer/borrower or counterparty to honour its financial or contractual obligations to the Bank. It may arise from direct lending activities as well as from commitments and contingencies. Total credit risk of the Bank constitutes counterparty risk, concentration risk and settlement risk.
Maximum credit risk exposure
Table – 16
As at December 31, 2018
Rs. Mn.
%
Net carrying amount of credit exposure
Cash and cash equivalents
39,534
2.1
Placements with banks
19,899
1.1
Financial assets at amortised cost – Loans and advances to banks
763
0.0
Financial assets at amortised cost – Loans and advances to other customers
861,100
46.8
Financial assets at amortised cost – Debt and other financial instruments/Financial Investments (Held to maturity) and loans and receivables
83,855
4.6
Financial assets measured at fair value through other comprehensive income/Financial Investments – Available for sale
176,507
9.6
1,181,658
Off-balance sheet maximum exposure
Lending commitments
161,062
8.8
Contingencies
496,475
27.0
657,537
Maximum credit exposure
1,839,195
100.0
Stage 3 (credit impaired) loans and advances to other customers
52,978
Impaired loans as a % of gross loans and advances to other customers
5.9
Allowance for impairment – loans and advances to other customers
29,129
Net carrying amount of loans and advances to other customers
861,100
Allowance for impairment as a % of gross loans and advances to other customers
3.3
Impairment charge – loans and advances to other customers
8,123
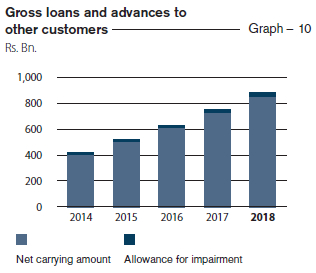
The Bank’s maximum credit exposure increased by 17% in 2018 compared to the previous year (maximum credit exposure in 2017 was Rs. 1.572 Tn.). Both retail banking and corporate banking portfolios contributed to this growth.
According to the SLFRS 9 classification, the credit impaired (Stage 3) loans to customers stood at Rs. 52.9 Bn. which is 5.9% of the gross loans and advances to other customers portfolio of the Bank.
The shift from incurred loss method to expected loss method with the adoption of SLFRS 9 has broadened the basis of allowance for impairment in 2018 which resulted in a cumulative impairment allowance of Rs. 29.1 Bn. and an impairment charge of Rs. 8.1 Bn.
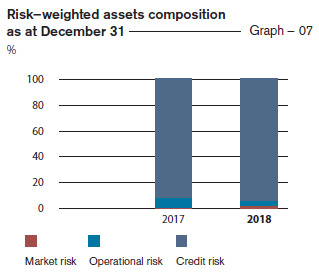
Managing credit risk
Given that credit risk accounts for over 90% of the risk-weighted assets, management of credit risk is critical to the Bank. We endeavour to manage credit risk management going beyond mere regulatory compliance in order to enhance value. It is managed through the credit risk management framework approved by the Board which comprises a robust risk governance structure and a comprehensive suite of risk management processes which include policies and procedures, risk ratings, collateral management and valuation, segregation of credit risk management functions, social and environmental risk management, independent verification of risk assessments, credit risk monitoring, providing direction to business line managers and internal audit.
Review of credit risk
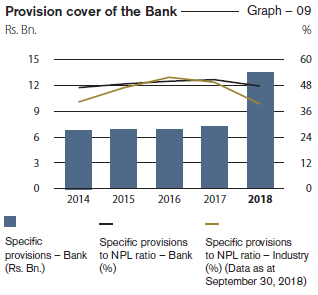
Elevated levels of attention given to loan approvals and disbursements coupled with concerted efforts in monitoring the loans and advances portfolios paved the way to keep the NPL ratios well below the established policy parameters amidst the challenging market conditions prevailed in 2018.
The effective credit risk management framework referred to above that guides the Bank throughout the process of on-boarding new exposure and monitoring existing exposure contributes immensely to preserve the quality of the loan book. In addition, the Bank is cautious and exercises restraint in the choice of customers, products, segments and geographies it caters to. Continuous monitoring of age analysis and the underlying movement across arrears buckets of past due loans enabled the Bank to swiftly take action, thereby moderating default risk during the year.
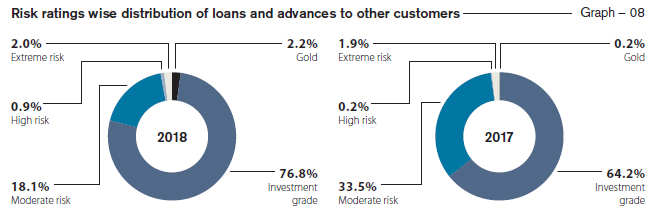
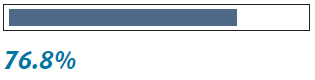
Distribution of borrower ratings
Borrowers with Investment Grade Ratings where default risk is considered to be very low, comprised 76.8% of the total loans and advances to other customers.
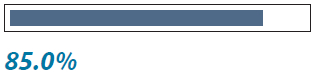
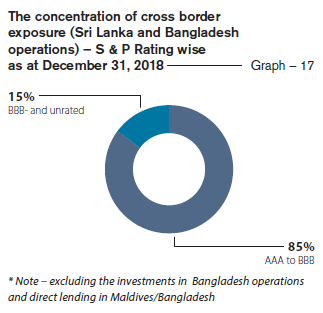
Distribution of country rating
Exposure to countries which are rated AAA to BBB- (S&P or equivalent) accounted for 85% of the total cross-border exposure of the Bank.
Concentration risk
Management of concentration risk is primarily through diversification of business across industry sectors, products, counterparties and geographies. The Bank’s RAS defines the limits for these segments and the Board, BIRMC, EIRMC and the CPC monitor these exposures to ensure compliance. Based on the trends and events shaping the business environment, they also make recommendations on modifications to specified limits.
The stage 3 credit impaired loans and advances to other customers distribution to identified industry sectors as at year end is given in Table 17.
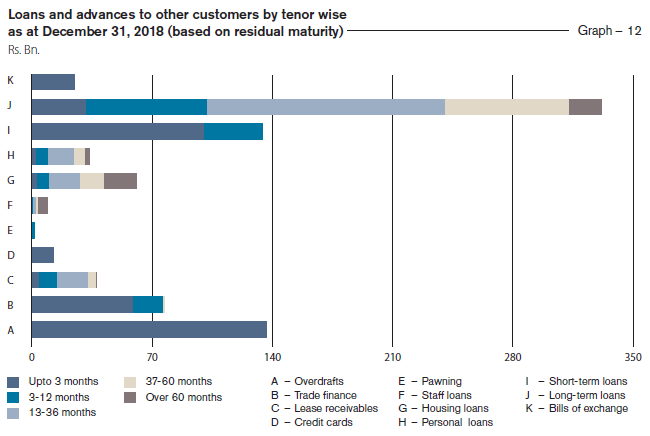
Graph 12 depicts that the tenor-wise breakdown of the portfolio of total loans and advances to other customers is within the risk appetite of the Bank.
Distribution of stage 3 credit impaired loans and
advances to other customers as at December 31, 2018 Table – 17
Industry category
Stage 3 loans and advances
Allowance for individual impairment
Allowance for collective impairment
ECL Allowance
Amount written off
Rs. ’000
Rs. ’000
Rs. ’000
Rs. ’000
Agriculture, forestry and fishing
5,103,767
100,143
1,586,912
1,687,055
42,052
Manufacturing
8,505,534
564,587
2,432,630
2,997,218
29,927
Tourism
3,516,885
1,630,282
329,124
1,959,406
517
Transportation and storage
1,026,569
93,135
202,526
295,660
8,898
Construction
8,132,041
3,250,480
1,270,274
4,520,753
6,512
Infrastructure development
234,892
128,518
27,585
156,104
1,324
Wholesale and retail trade
14,197,826
1,061,412
3,151,869
4,213,281
229,935
Information technology and communication services
1,631,252
299,627
209,224
508,851
829
Financial services
202,962
–
119,253
119,253
10
Professional, scientific and technical activities
357,056
–
139,640
139,640
5,480
Arts, entertainment and recreation
51,124
–
18,392
18,392
1,639
Education
90,957
–
61,547
61,547
630
Healthcare, social services and support services
313,640
463
115,634
116,097
943
Consumption
8,546,352
15,350
3,429,433
3,444,783
195,227
Lending to overseas entities
1,066,702
172,864
185,738
358,602
–
Total
52,977,559
7,316,861
13,279,781
20,596,642
523,923
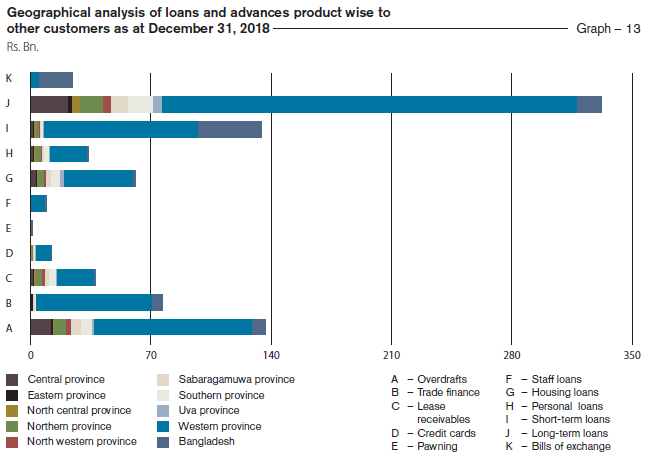
A geographical analysis (Graph13) reflects a high concentration of loans and advances in the Western Province which is due to concentration of economic activities in that province and the head quarters of most borrowing entities being located there.
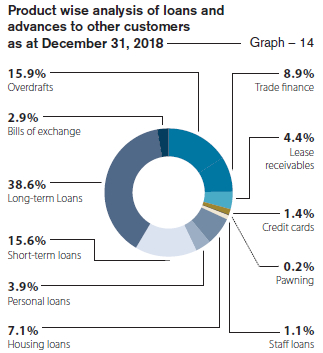
Product-wise analysis of loans and advances (Graph 14) also reflects the effectiveness of the Bank’s credit policies with risk being diversified across the Bank’s range of credit products.
The relatively high exposure of 38.6% to long-term loans is rigorously monitored and mitigated with collateral.
Counterparty risk
Counterparty risk is managed through the laid down policies/procedures and limit structures including single borrower limits and Group exposure limits with sub-limits for products etc. The limits set by the Bank are far more stringent than those stipulated by the regulator. This provides the Bank with a greater leeway in managing its concentration levels with regard to the counterparty exposures.
Loans and receivables to banks, both local and foreign, constitutes a key component of counterparty risk. It is being monitored through a specific set of policies, procedures and a limit structure. At frequent intervals, the counterparty bank exposures are monitored against the established prudent limits whilst market information on the financial/economic performance of these counterparties are subject to a rigorous scrutiny throughout the year and the limits are revised to reflect the latest information where deemed necessary.
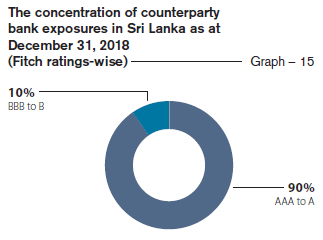
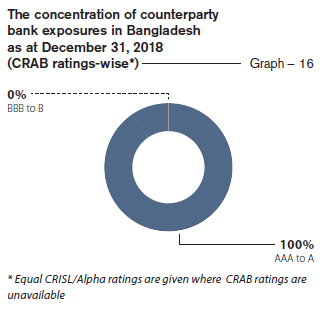
The analysis uses Fitch Ratings for local banks in Sri Lanka and Credit Ratings Agency in Bangladesh (CRAB) for local banks in Bangladesh (Equivalent CRISL/Alpha ratings have been used where CRAB ratings are not available). Exposures for local banks in Sri Lanka rated AAA to A category stood at 90% (Graph 15) whilst 100% of exposure of local banks in Bangladesh consisted of AAA to A rated counterparty banks (Graph 16).
Cross-border risk
The risk that the Bank will be unable to obtain payment from its customers or third parties on their contractual obligations as a result of certain actions taken by foreign governments, mainly relating to convertibility and transferability of foreign currency is referred to as the cross-border risk. Cross-border assets comprise loans and advances, interest-bearing deposits with other banks, trade and other bills and acceptances and predominantly relate to short-term money market activities.
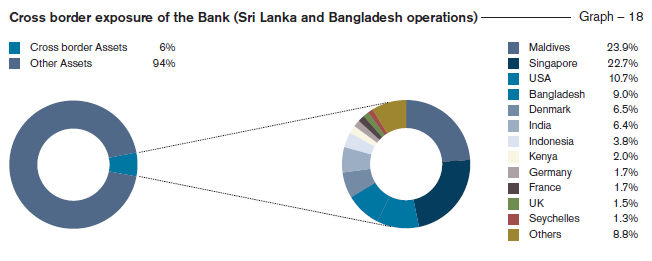
In addition to the limit structures in place to minimise risk arising from over concentration, the Bank continuously monitors macroeconomic and market developments of the countries with exposure to counterparties besides stringent evaluations of counterparties and maintaining frequent dialogue with them. Timely action is taken to suspend limits to countries with adverse economic/political developments.
Total cross-border exposure is only 6% of total assets of the Bank (Graph 18). The Bank has exposures to cross-border through a spread of countries which primarily include the Maldives, Singapore, USA, Bangladesh, Denmark, etc.
Market risk is the risk of loss arising from movements in market driven variables such as interest rates, exchange rates, commodity prices, equity and debt prices and their correlations. The Bank’s operations are exposed to these variables and correlations in varying magnitudes.
Market risk categories
Table – 18
Major market risk category
Risk components
Description
Tools to monitor
Severity
Impact
Exposure
Interest rate
Risk of loss arising from movements or volatility in interest rates
Re-pricing
Differences in amounts of interest earning assets and interest-bearing liabilities getting re-priced at the same time or due to timing differences in the fixed rate maturities and appropriately re-pricing of floating rate assets, liabilities and off-balance sheet instruments
Re-pricing gap limits and interest rate sensitivity limits
High
High
High
Yield curve
Unanticipated changes in shape and gradient of the yield curve
Rate shocks and reports
High
High
High
Basis
Differences in the relative movements of rate indices which are used for pricing instruments with similar characteristics
Rate shocks and reports
High
Medium
Medium
Foreign exchange
Possible impact on earnings or capital arising from movements in exchange rates arising out of maturity mismatches in foreign currency positions other than those denominated in base currency, Sri Lankan Rupee (LKR)
Risk tolerance limits for individual currency exposures as well as aggregate exposures within regulatory limits for NOP
High
Medium
Medium
Equity
Possible loss arising from changes in prices and volatilities of individual equities
Mark-to-market calculations are carried out daily for Fair Value Through Profit and Loss (FVTPL) and Fair Value Through Other Comprehensive Income (FVOCI) portfolios
Low
Low
Negligible
Commodity
Exposures to changes in prices and volatilities of individual commodities
Mark to market calculations
Low
Low
Negligible
Managing market risk
The market risk is managed through the market risk management framework approved by the Board, which comprises a robust risk governance structure and a comprehensive suite of risk management processes which include policies, market risk limits, Management Action Triggers (MATs), risk monitoring and risk assessment.
Review of market risk
Market risk arises mainly from the Non-Trading Portfolio (Banking Book) which accounts for 92.03% of the total assets and 93.53% of the total liabilities which are subject to market risk. Exposure to market risk arises mainly from IRR and FX risk as the Bank has negligible exposure to commodity related price risk and equity and debt price risk which was less than 13% of the total risk weighted exposure for market risk.
The Bank’s exposure to market risk analysed by Trading Book and Non-Trading Portfolios (or Banking Book) are set out in the Table 19.
Bank’s exposure to market risk as at December 31, 2018
Table – 19
The gap report is prepared by stratifying Rate Sensitive Assets (RSA) and Rate Sensitive Liabilities (RSL) into various time bands according to maturity (if they are fixed rates) or time remaining to their next repricing (if they are floating rates). Savings deposits balances are distributed in line with the findings of a behavioural analysis conducted by the Bank. Vulnerability of the Bank to interest rate volatility is indicated by the gap between RSA and RSL.
Interest rate sensitivity gap analysis of assets and liabilities of the banking book as at December 31, 2018 – Bank Table – 20
Description
Up to 3 MonthsRs. ’000
3-12 monthsRs. ’000
1-3 yearsRs. ’000
3-5 yearsRs. ’000
More than 5 yearsRs. ’000
Non-sensitiveRs. ’000
Total as at December 31, 2018Rs. ’000
Financial assets
Total financial assets
663,813,887
211,889,702
156,942,471
85,338,912
44,428,076
83,143,599
1,245,556,647
Financial liabilities
Total financial liabilities
424,198,862
379,023,098
92,962,198
57,569,454
118,320,870
73,522,744
1,145,597,226
Period gap
239,615,025
(167,133,396)
63,980,273
27,769,458
(73,892,794)
Cumulative gap
239,615,025
72,481,629
136,461,902
164,231,360
90,338,566
RSA/RSL
1.56
0.56
1.69
1.48
0.38
Interest rate risk (IRR)
Extreme movements in interest rates expose the Bank to fluctuations in Net Interest Income (NII) and have the potential to impact the underlying value of interest earning assets and interest bearing liabilities and off-balance sheet items. The main types of IRR to which the Bank is exposed to are repricing risk, yield curve risk and basis risk.
Sensitivity of projected NII
Regular stress tests are carried out on Interest Rate Risk in Banking Book (IRRBB) encompassing changing positions and new economic variables together with systemic and specific stress scenarios. Change in value of the Fixed Income Securities (FIS) portfolio in FVTPL and FVOCI categories due to abnormal market movements is measured using both Economic Value of Equity (EVE) and Earnings At Risk (EAR) perspectives. Results of stress tests on IRR are analysed to identify the impact of such scenarios on the Bank’s profitability and capital.
Impact on NII due to rate shocks on LKR and FCY is continuously monitored to ascertain the Bank’s vulnerability to sudden interest rate movements [Refer Note 69.3.2 (b)].
Sensitivity of NII to rate shocks
Table – 21
2018
2017
Parallel increaseRs. ’000
Parallel decreaseRs. ’000
Parallel
increase
Rs. ’000
Parallel
decrease
Rs. ’000
As at December 31,
1,560,756
(1,557,263)
1,243,611
(1,241,623)
Average for the year
1,493,675
(1,490,832)
920,414
(918,225)
Maximum for the year
1,646,558
(1,639,199)
1,243,611
(1,241,623)
Minimum for the year
1,269,334
(1,267,132)
706,442
(704,325)
Foreign exchange risk
Stringent risk tolerance limits for individual currency exposures as well as aggregate exposures within the regulatory limits ensure that potential losses arising out of fluctuations in FX rates are minimised and maintained within the Bank’s risk appetite.
USD/LKR exchange rate recorded an unprecedented depreciation of 19.14% (Source Bloomberg) during the year under review, the highest in the decade. The Bank has strategically managed the negative impacts associated therewith having converted them into opportunities.
Bank’s exposure to FX risk Table – 22
Currency
Net open position
(NOP)
Overall exposure
in respective
foreign currency
Overall
exposure in
’000
’000
Rs. ’000
United States Dollar
10,854
5,809
1,063,097
Great Britain Pound
(7)
(15)
(3,466)
Euro
(8)
(11)
(2,308)
Japanese Yen
(968)
787
1,304
Australian Dollar
(0)
6
747
Canadian Dollars
(7)
1
177
Other currencies (in USD)
73
138
25,243
Total exposure (in USD)
10,896
5,928
1,084,795
Total capital funds as at December 31, 2018
147,398,355
Total exposure as a % of capital funds as atDecember 31, 2018
0.74
Stress testing is conducted on NOP by applying rate shocks ranging from 6% to 15% in order to estimate the impact on profitability and capital adequacy of the Bank (Refer Note 69.3.3). The impact of a 1% change in exchange rate on the NOP indicates a loss of Rs. 229.74 Mn. on the positions as at December 31, 2018.
Equity price risk
Although the Bank’s exposure to equity price risk is negligible, mark-to-market calculations are conducted daily on FVTPL and FVOCI portfolios. The Bank has also calculated VaR on equity portfolio. Table 23 summarises the impact of a shock of 10% on equity price on profit, other comprehensive income (OCI) and equity.
Impact of 10% shocks on equity portfolio Table – 23
2018
2017
Financial assets recognised through profit or loss Rs. ’000
Financial assets fair value through other comprehensive income Rs. ’000
TotalRs. ’000
Held for trading
Rs. ’000
Available for sale
Rs. ’000
Total
Rs. ’000
Market value of Equity Securities as at December 31,
768,807
195,149
963,956
314,745
500,278
815,023
Stress Level
Impact on IncomeStatement Rs. ’000
Impact on OCI Rs. ’000
Impact on EquityRs. ’000
Impact on Income
Statement
Rs. ’000
Impact on OCI
Rs. ’000
Impact on Equity
Rs. ’000
Shock of 10% on equity price (upward)
76,881
19,515
96,396
31,475
50,028
81,503
Shock of 10% on equity price (downward)
(76,881)
(19,515)
(96,396)
(31,474)
(50,028)
(81,502)
Commodity price risk
The Bank has a negligible exposure to commodity price risk which is limited to the extent of the fluctuations in gold price on the pawning portfolio. The portfolio is less than 0.13% of total market risk exposure.
Liquidity risk is the Bank’s inability to meet “on” or “off” balance sheet contractual and contingent financial obligations as they fall due, without incurring unacceptable losses.
Banks are vulnerable to liquidity and solvency problems arising from mismatches in maturities of assets and liabilities. Consequently, the primary objective of liquidity risk management is to assess and ensure availability of funds required to meet obligations at appropriate times, both under normal and stressed conditions.
The Bank has maintained the following liquid asset ratios as at December 31, 2018:
Liquid asset ratios Table – 24
Domestic Banking Unit (DBU)%
Off-Shore Banking Unit (OBC)%
Statutory Liquid Assets Ratio (SLAR)
24.47
30.20
Local currency%
All currency%
Liquidity Coverage Ratio (LCR)
236.20
238.69
Managing liquidity risk
The Bank manages liquidity risk through the liquidity risk management framework which comprises a robust risk governance structure and a comprehensive suite of risk management processes which include policies and procedures, measurement approaches, mitigation measures, stress testing methodologies, contingency funding arrangements and VaR measurements.
238.69% Liquidity Coverage Ratio (LCR)
Liquidity Coverage Ratio of the Bank stood at 238.69% as at December 31, 2018, well above the minimum statutory requirement of 90%.
139.18% – Net Stable Funding Ratio (NSFR)
Net Stable Funding Ratio of the Bank stood at 139.18% as at December 31, 2018, well above the minimum statutory requirement of 90%.
Liquidity risk review
The net loans to deposits ratio is regularly monitored by the ALCO to ensure that the asset and liability portfolios of the Bank are geared to maintain a healthy liquidity position. NSFR indicating stability of funding sources compared to loans and advances granted was maintained well above the policy threshold of 100%, which is considered healthy to support the Bank’s business model and growth.
The key ratios used for measuring liquidity under the stock approach are given in Table 25 below:
Maturity gap analysis of assets and liabilities as at December 31, 2018 – Bank
Maturity analysis of financial assets and liabilities of the Bank (Tables 26 and 27) indicates sufficient funding for foreseeable adverse situations based on prescribed behavioural patterns observed.
(i) Remaining contractual period of maturity of the assets employed by the Bank as at December 31, is detailed below:
Table – 26
Descriptions
Up to 3
months
3 to 12
months
1 to 3
years
3 to 5
years
More than
5 years
Total as atDecember 31, 2018
Total as at
December 31,
2017
Rs. ’000
Rs. ’000
Rs. ’000
Rs. ’000
Rs. ’000
Rs. ’000
Rs. ’000
Interest earning assets:
Financial assets
Cash and cash equivalents
8,959,135
–
–
–
–
8,959,135
3,457,539
Balances with Central Banks
5,908,142
2,000,899
–
68,550
–
7,977,591
1,155,988
Placements with banks
19,898,515
–
–
–
–
19,898,515
17,633,269
Securities purchased under resale agreements
9,513,512
–
–
–
–
9,513,512
–
Derivative financial assets
–
–
–
–
–
–
–
Financial assets recognised through profit or loss/Held for trading – measured at fair value
4,751,363
–
–
–
–
4,751,363
4,096,168
Financial assets at amortised cost – Loans and advances to banks
–
–
–
–
–
–
–
Financial assets at amortised cost – Loans and advances to other customers
320,738,308
201,409,774
193,654,783
99,943,495
45,353,955
861,100,315
737,446,567
Financial assets at amortised cost – Debt and other financial instruments/ Financial Investments – Held to maturity and Loans and receivables
8,599,196
11,063,223
30,343,068
30,561,901
3,288,048
83,855,436
112,275,229
Financial assets measured at fair value through other comprehensive income/ Financial Investments – Available for sale
14,825,940
50,792,907
55,334,538
54,075,630
1,233,344
176,262,359
154,167,170
Total interest earning assets as at December 31, 2018
393,194,111
265,266,803
279,332,389
184,649,576
49,875,347
1,172,318,226
–
Total interest earning assets as at December 31, 2017
277,041,769
281,538,977
258,419,287
162,241,361
50,990,536
1,030,231,930
Non-interest earning assets:
Financial assets
Cash and cash equivalents
30,575,341
–
–
–
–
30,575,341
29,767,080
Balances with Central Banks
27,250,735
16,305,044
1,237,212
809,047
804,961
46,406,999
43,645,458
Placements with banks
–
–
–
–
–
–
–
Securities purchased under resale agreements
–
–
–
–
–
–
–
Derivative financial assets
3,304,750
3,982,426
589,427
–
33,359
7,909,962
2,334,536
Financial assets recognised through profit or loss/Held for trading – measured at fair value
768,804
–
–
–
–
768,804
314,745
Financial assets at amortised cost – Loans and advances to banks
–
–
763,074
–
–
763,074
640,512
Financial assets at amortised cost – Loans and advances to other customers
–
–
–
–
–
–
–
Financial assets at amortised cost – Debt and other financial instruments/ Financial Investments – Held to maturity and Loans and receivables
–
–
–
–
–
–
–
Financial assets measured at fair value through other comprehensive income/ Financial Investments – Available for sale
–
–
–
20,652
223,718
244,370
546,962
Non-financial assets
Investments in subsidiaries
–
–
–
–
4,263,631
4,263,631
3,065,935
Investments in associates
–
–
–
–
44,331
44,331
44,331
Property, plant and equipment
–
–
–
–
15,301,246
15,301,246
14,634,710
Intangible assets
–
–
–
–
906,112
906,112
776,810
Leasehold property
–
–
–
–
71,652
71,652
72,594
Deferred tax assets
–
–
–
–
–
–
–
Other assets
17,802,945
225,991
1,890,106
530,631
3,461,449
23,911,122
17,298,162
Total non-interest earning assets as at December 31, 2018
79,702,575
20,513,461
4,479,819
1,360,330
25,110,459
131,166,644
Total non-interest earning assets as at December 31, 2017
70,311,817
15,953,121
2,669,183
1,253,731
22,953,983
113,141,835
Total assets – as at December 31, 2018
472,896,686
285,780,264
283,812,208
186,009,906
74,985,806
1,303,484,870
Total assets – as at December 31, 2017
347,353,586
297,492,098
261,088,470
163,495,092
73,944,519
1,143,373,765
Percentage–as at December 31, 2018 (*)
36.29
21.92
21.77
14.27
5.75
100.00
Percentage – as at December 31, 2017 (*)
30.38
26.02
22.83
14.30
6.47
100.00
(*) Total assets of each maturity bucket as a percentage of total assets employed by the Bank.
(ii) Remaining contractual period to maturity of the liabilities and share holders' funds employed by the Bank as at the date of Statement of Financial Position is detailed below:
Table – 27
Descriptions
Up to 3
months
3 to 12
months
1 to 3
years
3 to 5
years
More than
5 years
Total as atDecember 31, 2018
Total as at
December 31,
2017
Rs. ’000
Rs. ’000
Rs. ’000
Rs. ’000
Rs. ’000
Rs. ’000
Rs. ’000
Interest – bearing liabilities:
Financial liabilities
Due to banks
11,625,888
16,648,582
–
–
–
28,274,470
48,954,474
Derivative financial liabilities
–
–
–
–
Securities sold under repurchase agreements
38,858,224
6,974,167
3,272,071
–
–
49,104,462
49,676,767
Financial liabilities recognised through profit or loss – measured at fair value
–
–
–
–
–
–
–
Financial liabilities at amortised cost – due to depositors
504,105,648
352,184,128
24,892,407
14,112,967
16,088,136
911,383,286
789,533,286
Financial liabilities at amortised cost – other borrowings
266,300
1,499,941
8,463,641
8,507,200
6,624,830
25,361,912
23,786,094
Subordinated liabilities
739,373
387,827
9,477,720
22,104,087
5,283,450
37,992,457
25,165,924
Total interest bearing liabilities as at December 31, 2018
555,595,433
377,694,645
46,105,839
44,724,254
27,996,416
1,052,116,587
Total interest bearing liabilities as at December 31, 2017
524,871,276
306,214,684
38,492,219
30,031,857
37,506,509
937,116,545
Non-interest bearing liabilities :
Financial liabilities
Due to banks
21,826,611
–
–
–
–
21,826,611
8,166,517
Derivative financial liabilities
3,404,297
4,432,899
184,587
–
–
8,021,783
3,678,494
Securities sold under repurchase agreements
–
–
–
–
–
–
–
Financial liabilities recognised through profit or loss – measured at fair value
–
–
–
–
–
–
–
Financial liabilities at amortised cost – due to depositors
71,654,028
–
–
–
–
71,654,028
60,594,225
Financial liabilities at amortised cost – other borrowings
–
–
–
–
–
–
–
Subordinated liabilities
–
–
–
–
–
–
–
Non-financial liabilities
Debt securities issued
–
–
–
–
–
–
–
Current tax liabilities
1,274,349
5,292,009
–
–
–
6,566,358
4,143,911
Deferred tax liabilities
(554,786)
(328,268)
(515,164)
151,947
1,892,519
646,248
3,274,826
Other provisions
–
–
–
–
–
–
–
Other liabilities
4,178,679
11,518,944
3,623,579
1,474,469
3,410,680
24,206,351
19,225,364
Due to subsidiaries
40,955
–
–
–
–
40,955
74,523
Equity
Stated capital
–
–
–
–
39,147,882
39,147,882
37,143,541
Statutory reserves
–
–
–
–
7,354,143
7,354,143
6,476,952
Retained earnings
–
–
–
–
5,063,076
5,063,076
4,987,446
Other reserves
–
–
–
–
66,840,848
66,840,848
58,491,421
Total non-interest bearing liabilities as at December 31, 2018
101,824,133
20,915,584
3,293,002
1,626,416
123,709,148
251,368,283
Total non-interest bearing liabilities as at December 31, 2017
75,376,089
14,424,025
3,532,019
1,636,826
111,288,261
206,257,220
Total liabilities and equities – as at December 31, 2018
657,419,566
398,610,229
49,398,841
46,350,670
151,705,564
1,303,484,870
Total liabilities and equities – as at December 31, 2017
600,247,365
320,638,709
42,024,238
31,668,683
148,794,770
1,143,373,765
Percentage – as at December 31, 2018 (*)
50.43
30.58
3.79
3.56
11.64
100.01
Percentage – as at December 31, 2017 (*)
52.50
28.04
3.68
2.77
13.01
100.00
(*) Total liabilities and shareholders' funds of each maturity bucket as a percentage of total liabilities and shareholders' funds employed by the Bank.
Maturity analysis of financial assets and financial liabilities of the Bank (Tables 26 and 27) does not indicate any adverse situation when due cognisance is given to the fact that cash outflows include savings deposits which can be considered as a quasi stable source of funds based on historical behavioural patterns of such depositors as explained below.
Behavioural analysis on savings accounts
In the absence of a contractual agreement about maturity, savings deposits are treated as a non-maturing demand deposit. There is no exact repricing frequency for the product and the Bank resets rate offered on these deposits based on repricing gap, liquidity and profitability etc. Since, there is no exact repricing frequency and that it is not sensitive to market interest rates, segregation of savings products among the predefined maturity buckets in the maturity gap report is done based on the regular simulations carried out by the Bank in line with a behavioural study.
The liquidity position is measured in all major currencies at both individual and aggregate levels to ensure that potential risks are within specified threshold limits. Additionally, potential liquidity commitments resulting from loan disbursements and undrawn overdrafts are also monitored to ensure sufficient funding sources.
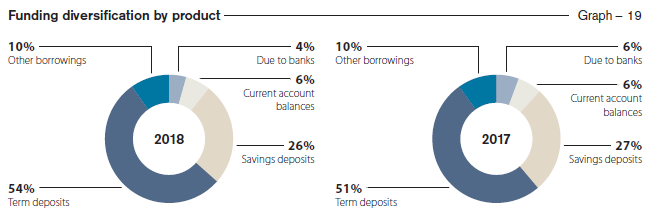
Funding diversification by product
The Bank’s primary sources of funding are deposits from customers and other borrowings. The Graph 19 provides a product-wise analysis of the Bank’s funding diversification as at end of 2017 and 2018.
Operational risk is the risk of losses stemming from inadequate or failed internal processes, people and systems, or from external events such as natural disasters, social or political events. It is inherent in all banking products and processes and our objective is to control it in a cost-effective manner. Operational risk includes legal risk but excludes strategic and reputational risk.
Managing operational risk
The Bank manages operational risk through the operational risk management framework which comprises a robust risk governance structure and a comprehensive suite of risk management processes which include policies, risk assessment, risk mitigation through insurance coverage, policies and procedures relating to outsourcing of business activities, managing technology risk, a comprehensive Business Continuity Plan (BCP) and Disaster Recovery Plan (DRP), creating a culture of risk awareness across the Bank, stress testing and monitoring and reporting.
Review of operational risk
The Bank has a low appetite for operational risks and has established tolerance levels for all material operational risk loss types based on historical loss data, budgets and forecasts, performance of the Bank, existing systems and controls governing Bank operations etc. Following thresholds have been established based on audited financial statements for monitoring purposes:
Alert level – 3% of the average gross income for the past three years
Maximum level – 5% of the average gross income for the past three years
Operational losses for the financial year 2018 were below the internal alert level at 1.70% (of average audited gross income for past three years). The Bank has been consistently maintaining operational losses below the alert level for the past nine years, reflecting the “tone at the top”, effectiveness of the governance structures and the rigour of processes and procedures in place to manage operational risk.
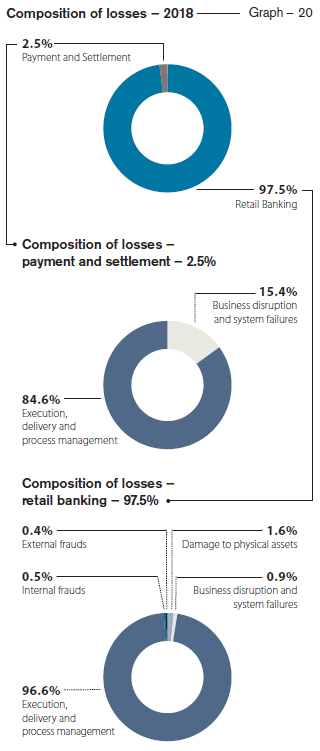
The Graph 20 analyses the operational risk losses incurred by the Bank under each business line/category during the year 2018.
When analysing the losses incurred during 2018 under the Basel II defined business lines, it is evident that the majority (97.5%) of losses with financial impact falls under the business line of “Retail Banking”, followed by the losses reported under the ‘‘Payment and Settlement” business line. Losses relating to other business lines remain negligible.
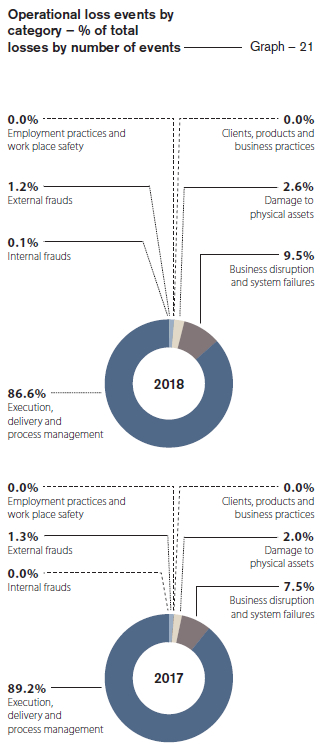
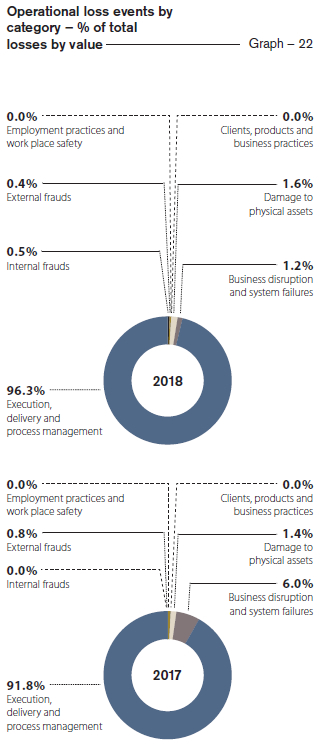
The Graphs 21 and 22 depict the comparison of operational losses reported during 2018 and 2017 under each Basel II loss event type, both in terms of number of occurrences and value.
As typical with operational risk losses, majority of the losses encountered by the Bank during 2018 consisted of high frequency/low financial impact events mainly falling under the loss category “Execution, Delivery and Process Management”. These low value events are mainly related to cash and ATM operations of the Bank’s service delivery network consisting of over 1,000 points across Sri Lanka and Bangladesh. Individual events with monetary values less than Rs.100,000 account for more than 95% of the total loss events for the year. Also, the number of loss events for the year when compared to the number of transactions performed during the year stands at a mere 0.0072%.
When considering the values of the losses incurred by the Bank during the year, they can mainly be categorised under Execution, Delivery and Process Management related and Damage to Physical Assets. The losses for the year were primarily driven by a limited number of events in Execution, Delivery, and Process Management category, majority of which the Bank managed to resolve through subsequent recovery/rectification with minimum financial impact to the Bank. Further, necessary process improvements have been introduced to prevent recurrence. After the recovered amounts are discounted, the net loss amounts to a mere 0.76% of capital allocation pertaining to operational risk for 2018, under Alternative Standardised Approach of capital computation as per Basel II. This trend of exceptionally low levels of operational risk losses of the Bank bears testimony to the effectiveness of the Bank’s Operational Risk Management Framework and the internal control environment.
IT risk is the business risk associated with use, ownership, operation, involvement, influence and adoption of IT within an organisation. It is a major component of operational risk comprising IT-related events such as system interruptions, errors, frauds through system manipulations, cyber attacks, obsolescence in applications, falling behind competitors concerning the technology, etc., that could potentially affect the whole business. Given the uncertainty with regard to frequency and magnitude, managing IT risk poses challenges. Hence, the Bank has accorded top priority to addressing IT risk, giving more focus to cybersecurity strategies and continually investing on improving the cybersecurity capabilities. The Bank’s cybersecurity strategy is focused on securely enabling new technology and business initiatives while maintaining a persistent focus on protecting the Bank and its customers from cyber threats.
The IT Risk Unit of the IRMD is responsible for implementing the IT risk management framework for the Bank, ensuring that the appropriate governance framework, policies, processes and technical capabilities are in place to manage all significant IT risks. The IT Risk Management Policy, aligned with the Operational Risk Management Policy complements the Information Security Policy, the related processes, objectives and procedures relevant for managing risk and improving information security of the Bank.
RCSA is used as one of the core mechanisms for IT risk identification and assessment, while the IT Risk Unit carries out independent IT risk reviews in line with the established structure of the operational risk management process. Results of these independent IT risk assessments together with audit findings, analysis of information security incidents, internal and external loss data are also employed for IT risk identification and assessment purposes.
IT risk mitigation involves prioritising, evaluating and implementing the appropriate risk-reducing controls or risk treatment techniques recommended from the risk identification and assessment process. The Bank has a multilayered approach of building controls in to each layer of technology, including data, applications, devices, network, etc. This ensures robust end-to-end protection, while enhancing the cyber threat detection, prevention, response and recovery opportunities. Being the first local bank to be certified under the ISO/IEC 27001 information security standard in 2010, the Bank has maintained the certification throughout, by successfully under-going the annual audits.
The Bank has continued to invest in information security, embarking upon a roadmap to improve its resilience towards the cyber threats. Some of the initiatives in this regard during the year included:
The Network Operations Centre established with the objective to improve the cyber incident response capabilities expanded its security incident and event monitoring functions with a view to establishing a fully-fledged Security Operations Centre in line with the guidelines of the CBSL;
Since selected key business units have been certified under ISO 27001 Standard, controls applicable to centralised IT systems and processes are already in place across business units. The Bank has initiated a project to implement the few remaining controls that need to be applied at business unit level to ensure adherence to the CBSL Baseline Security Standard across all branches and departments as well.
The subsidiaries of the Bank have also implemented Information Security Management Systems/ Frameworks aligned to the Commercial Bank Group Information Security Policy Framework introduced during 2017 with the aim of maintaining an appropriate level of information security protection Group-wide.
The Bank has devised a Cybersecurity Roadmap in line with the CBSL Road Map on Technology Risk Resilience and is in the process of implementing same.
Given that risk management relies heavily on an effective monitoring mechanism, the IT Risk Unit carries out continuous, independent monitoring of the Bank’s IT risk profile using a range of tools and techniques including Key IT Risk Indicators (KIRIs).
Defined as the exposure to the adverse consequences resulting from inaccurately drafted contracts, their execution, the absence of written agreements or inadequate agreements, legal risk is an integral part of operational risk. It includes, but is not limited to, exposure to fines, penalties, or punitive damages resulting from supervisory actions, as well as cost of private settlements.
Legal risk is managed by ensuring that applicable regulations are fully taken into consideration in all relations and contracts with individuals and institutions who maintain business relationships with the Bank, and that they are supported by required documentation whereas risk of breaching the rules and regulations is managed by establishing and operating a sufficient mechanism for verification of conformity of operations with applicable regulations.
Compliance and regulatory risk refers to the potential risk to the Bank arising from failure to comply with applicable laws, rules and regulations and codes of conduct and may lead to regulatory sanctions, financial losses, disruptions to business activities and reputational damage. A compliance function reporting directly to the Board of Directors is in place to assess the Bank’s compliance with external and internal regulations. A comprehensive compliance policy specifies how this key risk is identified, monitored and managed by the Bank in a structured manner. The Bank’s culture and the code of ethics too play a key role in managing this risk.
Strategic risks are the risks that are associated with the strategic decisions and may manifest in the Bank not being able to keep up with the changing market dynamics, leading to loss of market share and failure to achieve strategic goals. Corporate planning and budgeting process and critical evaluation of their alignment with the Bank’s vision, mission and the risk appetite facilitate management of strategic risk. The detailed scorecard-based qualitative model aligned to ICAAP is used to measure and monitor strategic risk of the Bank. This scorecard-based approach takes into consideration a range of factors, including the size and sophistication of the organisation, the nature and complexity of its activities in measuring strategic risk and highlights the areas that need emphasis to mitigate potential strategic risks.
Reputational risk is the risk of adverse impact on earnings, assets and liabilities or brand value arising from negative stakeholder perception of the Bank’s business practices, activities and financial condition. The Bank recognises that reputational risk is driven by a wide range of other business risks that must all be actively managed. In addition, the exponential growth in channels of communication such as social media has widened the stakeholder base and expanded the sources of reputational risk. Accordingly, reputational risk is broadly managed through the systems and controls adopted for all other risk types such as credit, market, operational risk etc., which are underpinned by the code of conduct, communication policy and business ethics. Further, reputational risk is measured through the detailed scorecard-based model developed by the Bank to measure and monitor reputational risk under ICAAP. Timely actions are initiated to mitigate potential reputational risks by critically evaluating the criteria given in the said scorecard.
Capital Adequacy and ICAAP Framework
In line with the Basel requirements and as prescribed in the ICAAP framework, the Bank used internal models to assess and quantify the risk profile, to stress test risk drivers and to assess capital requirements to support them. Internal limits which are more stringent than the regulatory requirement provide early warnings with regard to capital adequacy.
ICAAP supports the regulatory review process providing valuable inputs for evaluating the required capital in line with future business plans. It integrates strategic plans and risk management plans with the capital plan in a meaningful manner with inputs from Senior Management, Management Committees, Board Committees and the Board. It also supports profit optimisation through proactive decisions on exposures both current and potential through measurement of vulnerabilities by carrying out stress testing and scenario-based analysis. The ICAAP process also identifies gaps in managing qualitative and quantitative aspects of reputational risk and strategic risk which are not covered under Pillar 1 of Basel II.
The Bank is compliant with both regulatory and its own prudential requirements of capital adequacy. With a loyal base of shareholders and profitable operations, the Bank is also well positioned to meet capital requirements in the longer term to cover its material risks and to support business expansion.
Target and actual capital levels Table – 28
Capital ratios
Goal
(internal requirement)
2018(%)
2017
(%)
CET 1 (regulatory minimum 7.375%)
> 10%
11.338
12.111
Total capital (regulatory minimum 12.875%)
> 15%
15.603
15.746
(refer Annex 3 for the detailed capital adequacy computation)
Basel III minimum capital requirements and buffers
The Banking Act Direction No. 01 of 2016 introduced capital requirements under Basel III for licensed commercial banks commencing from July 1, 2017 with specified timelines to gradually increase minimum capital ratios to be fully implemented by January 1, 2019.
A comparison of the position as at December 31, 2018 and the minimum capital requirement prescribed by the CBSL effective from January 1, 2019 as given below demonstrates the capital strength of the Bank and bears testimony to the ability to meet stringent requirements imposed by the regulator.
Basel III readiness Table – 29
Ratios (%)
Bank’s position as at December 31, 2018
Minimum capital
ratio prescribed
by the CBSL from
January 1, 2019
Common Equity Tier 1 (CET 1) including Capital Conservation Buffer (CCB) and Capital Surcharge on Domestic Systemically Important Banks (D-SIBs)
11.338
8.50
Total Tier 1 including CCB and Capital Surcharge on D-SIBs
11.338
10.00
Total Capital including CCB and Capital Surcharge on D-SIBs
15.603
14.00
The Bank foresees challenges in meeting the increasing capital requirements in the years to come, primarily due to the significant impact on the internal capital generation capabilities of the Bank from SLFRS 9 adoption which increased impairment allowance for 2017 (for Day 1 Impact) and 2018 by Rs. 13.4 Bn and the Debt Repayment Levy which increased the tax burden by Rs. 650 Mn. The Bank issued Rs. 10 Bn Basel III compliant debentures in July 2018, to raise the capital.
“Basel Workgroup” of the Bank consists of representation from members from a cross section of business units and supporting units to ascertain levels of capital adequacy in line with strategic direction of the Bank. While ICAAP acts as a foundation for such assessment, the Basel Workgroup is constantly on the lookout for improvements amidst changing landscape in different frontiers, to recommend to the ALCO on the desired way forward including indications on current and future capital needs, anticipated capital expenditure based assessments and desirable capital levels, etc.
The Bank is aware of the importance of capital as a scarce and valuable resource. The Bank has access to contributions from shareholders as well as built up capital over a period of time by adopting prudent dividend policies, ploughing back a portion of the profits, etc. In addition, the Bank is continuously finding ways to improve judicious allocation of capital to requirements associated with the day-to-day activities so that an optimised level of capital allocation can be achieved. The challenges associated with mobilising capital from external sources are also given due cognisance, but not excluded as a sustainable option to boost the capital in the long run. The Bank is reasonably comfortable with the current availability of capital buffer to withstand an ambitious growth/ stressed market conditions, but not complacent with current comfort levels and believe in providing stakeholder confidence that the Bank is known for, through sound capital buffer levels.
Stress testing
As an integral part of ICAAP under Pillar II, the Bank conducted stress testing for severe but plausible shocks on its major risk exposures on a periodic basis to evaluate the sensitivity of the current and forward risk profile relative to risk appetite and their impact on and resilience of capital, funding, liquidity and earnings.
It also supports a number of business processes, including strategic planning, the ICAAP including capital management, liquidity management, setting of risk appetite triggers and risk tolerance limits, mitigating risks through actions such as reviewing and changing limits, limiting or reducing exposures and hedging thereof, facilitating the development of risk mitigation or contingency plans across a range of stressed conditions supporting communication with internal and external stakeholders.
The Bank’s stress testing governance framework sets out the responsibilities for and approaches to stress testing activities which are conducted at Bank, business line and risk type level. The Bank’s stress testing programme uses one or a combination of stress testing techniques, including scenario analysis, sensitivity analysis and reverse stress testing to perform stress testing for different purposes.
The framework covers all the material risks such as credit risk, credit concentration risk, operational risk, liquidity risk, FX risk, IRRBB using EVE and EAR perspectives. The Bank looks at different degrees of stress levels which are defined as Minor, Moderate and Severe in the Stress Testing Policy. The resultant impact on the capital through these stress tests is carefully analysed. If the stress tests bring about a deterioration of the capital which has no impact on the policy level on capital maintenance, same is defined as minor risk, while a deterioration of up to 1% is considered moderate risk. If the impact results in the capital falling below the statutory requirement such a level will be considered severe risk, warranting immediate attention of the Management to rectify the situation.
As it provides a broader view of all risks borne by the Bank in relation to its risk tolerance and strategy in a hypothetical stress situation, stress testing has become an effective communication tool to Senior Management, risk owners and risk managers as well as supervisors and regulators. The results of the stress testing are reported to the EIRMC and BIRMC on a quarterly basis for appropriate, proactive decision making. Extracts from the stress testing results are set out in Table 30.
Impact on CAR at minor, moderate and severe stress levels:
Table – 30
Particulars
Description
2018
2017
Minor%
Moderate%
Severe%
Minor
%
Moderate
%
Severe
%
Credit risk – asset quality downgrade
Increasing the direct non-performing facilities over the direct performing facilities for the entire portfolio
-0.14
-0.36
-0.68
-0.15
-0.37
-0.73
Operational risk
Impact of;
1. Top five operational losses during last five years
2. Average of yearly operational risk losses during last three years
Whichever is higher
-0.06
-0.14
-0.27
-0.07
-0.17
-0.34
Foreign exchange risk
Percentage shock in the exchange rates for the Bank and Maldives operations (gross positions in each book without netting)
-0.05
-0.09
-0.14
-0.05
-0.09
-0.13
Liquidity risk (LKR) – Sri Lanka
1. Withdrawal of percentage of the clients, banks and other banking institution deposits from the Bank within a period of three months
-0.02
-0.10
-0.28
-0.09
-0.25
-0.50
2. Rollover of loans to a period greater than three months
Interest rate risk – EAR and EVE (LKR) – Sri Lanka
To assess the long-term impact of changes in interest rates on Bank’s EVE through changes in the economic value of its assets and liabilities and to assess the immediate impact of changes in interest rates on Bank’s earnings through changes in its net interest income
-0.30
-0.58
-0.86
-0.05
-0.09
-0.14
Business continuity management
Business Continuity Management (BCM) framework of the Bank encompasses business continuity, disaster recovery, crisis management, incident management, emergency management and contingency planning activities. These activities will ensure that the Bank is committed to serve its customers, employees, shareholders and suppliers with minimum business interruptions in the event of an unforeseen disruption to its business activities arising from man-made, natural or technical disasters.
The scope of the BCM includes programme initiation and management, risk evaluation and business impact analysis, developing business continuity strategies, emergency preparedness and response, developing and implementing business continuity plans, awareness building and training, business continuity plan exercise, audit and maintenance, crisis communications and coordination with external agencies.
During the year, the Business Continuity Plan (BCP) of the Bank was revamped in line with industry best practices in consultation with an external BCP expert. IT Disaster Recovery Plan, which is a key component of BCP was also reviewed and approved by the Board of Directors. IT system recovery capabilities of core banking and other critical systems of the Bank were further strengthened by way of introducing a secondary high-availability set-up leading to improved redundancy.
A BCP exercise (working day) was carried out in September 2018, which was conducted over a period of one week, beyond the current CBSL requirement of one working day. During the week of the BCP drill, the core banking and other critical systems were running from the DR systems. The exercise was a great success with very minimum disruptions, which bears testimony to the maturity attained by the Bank by conducting such exercises over the years. The BCM Unit of the Bank continued with other regular tasks that included on-going alternate site-testing, workshops/awareness sessions on BCP conducted for business units, etc.
Monitoring and reporting
It is the responsibility of the risk management function of the Bank to identify, measure, monitor and report risk. In order to enhance the effectiveness of its role, staff attached to it was given regular training, enabling them to develop and refine their skills. They were well aided by IT systems which enabled extraction of data, analysis and modeling. Regular and ad hoc reports were generated on Key Risk Indicators and risk matrices of the Bank as well as the subsidiaries, for review by the Senior Management, Executive and Board Committees, and the Board which rely on such reports for evaluating risk and providing strategic direction. The reports provided information on aggregate measures of risks across products, portfolios, tenures, and geographies compared against agreed policy parameters, providing a clear representation of the risk profile and sensitivities of the risks assumed by the Bank and the Group.
Plans for 2019 and beyond
The Bank envisages the importance of the risk management function to increase in the wake of the widening and deepening banking regulation, pervasive technological advances and macroeconomic shocks. Hence, the Bank will continue to strengthen the risk management framework further through the necessary changes to the mandate, structure, resourcing, competencies, technologies, MIS, data analytics etc., thereby aligning business strategies with sound risk management practices and making risk management function more forward looking and proactive. Specific initiatives in this regard will include:
Getting the credit rating model externally validated;
Automating the Credit Risk Review function;
Looking for an early warning system to ascertain any behavioural patterns related deterioration in asset quality;
Ensuring full compliance with Baseline Security Standards (BSS) of the CBSL;
Establishing a Security Operations Centre as per the guidelines of the CBSL;
Active participation of risk management function in strategy setting and planning process;
Issue of 75 Mn. listed, unsecured, rated redeemable, subordinated Basel III compliant debentures of Rs. 100 each with a non viability conversion feature, with an option to issue further 75 Mn. debentures in the event of an oversubscription for a minimum tenure of five years and a maximum tenure of 10 years, during the year 2019, to further strengthen Tier-II capital.
Adopting a more forward-looking approach to risk management.
Basel III – Market Discipline
Please refer Annex 3 for the minimum disclosure requirements under Pillar 3 as per the Banking Act Direction No. 01 of 2016.