


Financial Review
Sustaining performance of the Bank into the foreseeable future as a going concern is one of the two dimensions of sustainability as applicable to the Bank, the second dimension being how the Bank conducts its enterprise giving due consideration to the wider community and the environment so that benefits accrue to all the stakeholders. They are two mutually inclusive aspects. It is the sustained performance of the Bank that enables it to give due consideration to the society and the environment while the Bank cannot sustain its performance in the long run unless it gives due consideration to the social and environmental aspects. A profitable operation is a precondition for being sustainable.
By delivering value to and deriving value from stakeholders through various activities connected to financial intermediation and maturity transformation as elaborated in the section on Our Value Creation Model and the Management Discussion and Analysis, the Bank has been able to build both financial as well as other capitals such as manufactured, intellectual, human, social and network and natural. This financial review provides an analysis of how the Bank grew its financial capital (which plays multiple roles) during the year while the activities undertaken to deliver value to various stakeholders and how such activities have contributed to build other capitals of the Bank by deriving value from them during the year is given in the section on Our Value Creation Model in the chapter on Strategic Report in terms of various indicators.
An overview
The Bank ended 2018 with a solid performance in all key sectors weathering many challenges posed by the operating environment, the increase in impairment allowances, volatile and escalating interest rates, depreciating domestic currency and increased tax burden in particular. With compounded annual growth rates of 19.52%, 16.86% and 16.55% respectively, loans to customers, deposits and total assets again doubled over the past five years. Our growth rates have been in excess of the industry averages, enabling us to continue to enhance our market share in total assets from 10.2% in 2013 to 11.1% by end 2018.

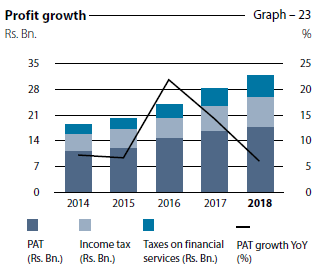
Profit after tax of the Bank increased to Rs. 17.544 Bn., a growth of 5.81% compared to 2017. Although lower by our historical performance standards, this is significant when viewed against the challenges posed by the operating environment. Despite a 30.56% growth in total operating income, a substantial increase in impairment charge for the year primarily due to the change in methodology of calculation of impairment allowance and deterioration in asset quality, to Rs. 8.575 Bn. from Rs. 0.678 Bn. in 2017 reduced the growth in net operating income to 14.57%. Increase in operating expenses were proportionate to the growth in business volumes and the total operating income. A significant increase in tax burden limited the growth in profit after tax to 5.81%.
The Bank once again recorded a growth of over Rs. 100 Bn. each in both loans to customers (for the fourth consecutive year) and deposits (for the third consecutive year) during the year.
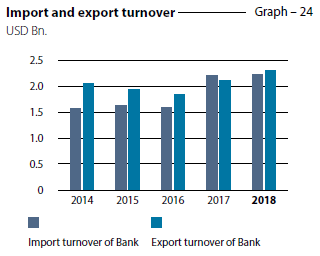
The Bank recorded a considerable growth in export turnover and a marginal growth in import turnover.
In tandem with the drop experienced in the share market as witnessed by ASPI and S&P SL20 dropping by 5% and 15% during the year respectively, share prices of the Bank also decreased. However, our market capitalisation remained the highest among peers in the Banking, Finance and Insurance sector, on the Colombo Stock Exchange and also ranked third among all listed companies.
Having due regard to dividend policy and the increasing capital requirements which is of paramount importance to support growth plans, the Board of Directors has recommended a final dividend of Rs. 2.00 per share in the form of shares despite the growth in profit after tax being lower in 2018. This final dividend together with the two interim dividends paid, amounted to a total dividend of Rs. 6.50 per share for the year which is consistent with dividends paid for the past six years.
Given that the Bank accounted for 98.76% of the assets and 98.21% of the profit of the Group, the analysis below provides a detailed account of the Bank’s financial performance, followed by a brief commentary on Group performance as given in this section.
Income Statement
Fund based operations
Interest income which accounted for 85.09% (90.10% in 2017) of the gross income of Rs. 138.049 Bn. grew to Rs. 117.466 Bn. during the year from Rs. 103.034 Bn. in 2017 recording a growth of 14.01%. The main contributory factors were the growth in average interest earning assets by Rs. 133.288 Bn. (13.37%) and the average interest rate thereon improving by 17 bps to 10.38%.
Interest expenses, which accounted for 61.74% of the interest income (62.13% in 2017), grew by a lower 13.30% as a result of timely repricing of liabilities amidst a shift from low cost funds to high cost time deposits, to Rs. 72.524 Bn. during the year,
up from Rs. 64.011 Bn. in 2017. The main contributory factors were the growth in average interest bearing liabilities by Rs. 121.248 Bn. (13.28%) and continuing decline of the CASA ratio to 37.55% from 39.23% in 2017.
Consequently, net interest income grew by 15.17% (compared to 18.89% in 2017) to Rs. 44.942 Bn. from Rs. 39.023 Bn. in 2017, accounting for 70.57% of the total operating income (80.00% in 2017). This compares well against the growth of 16.30% in net interest income (NII) of the banking sector for the year. Net interest spread improved to 3.37% from 3.20% in 2017. Net interest income as a percentage of average assets of 3.67% too compares well with the 3.60% for the banking sector.
Fee-based operations
Fee and commission income too recorded an impressive growth of 17.89% to Rs. 11.988 Bn. for the year. The sources that recorded significant growth included services related to credit and debit cards, trade finance and remittance and guarantees related services. The Bank managed to record a significant increase in the number of credit and debit cards in issue as well as their utilisation. The Bank’s market share in both the trade finance and remittance business also increased during the year.
Fee and commission expenses which relate mostly to credit and debit cards related services increased by 17.30%. Consequently, net fee and commission income increased by 17.99% to Rs. 10.150 Bn. accounting for 15.94% of the total operating income (17.64% in 2017).
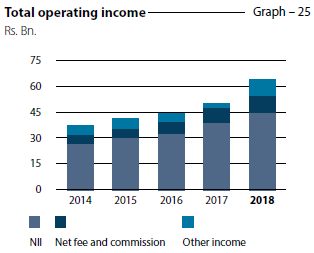
Total operating income
Total operating income grew by 30.56% to Rs. 63.687 Bn. compared to 13.41% in 2017. Main contributory factors included improvements in NII and net fee and commission income as explained above, a substantial increase in gains from revaluation of foreign exchange, and capital gains on Government Securities. This was partly offset by the exchange losses on swabs that matured during the year which in turn was due to adverse impact of the steep depreciation of the Rupee against the US dollar.
Impairment charges
Consequent to the implementation of SLFRS 9 with effect from January 1, 2018 and the drop in asset quality during the year, the entire financial services industry witnessed a substantial increase in the impairment allowance. Primarily due to differences in impairment methodology under SLFRS 9 that requires impairment allowances to be based on forward looking expected credit loss model compared to LKAS 39 where the impairment allowance was made on incurred loss method, foreign currency denominated Government Securities being subjected to impairment primarily due to sovereign risk associated and unutilised limits too being subjected to impairment coupled with deteriorating asset quality, impairment charge for the year increased to Rs. 8.575 Bn. compared to Rs. 678 Mn. in 2017.
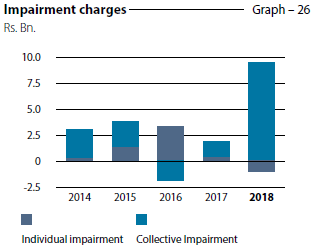
In addition, the cumulative impact of impairment allowance as at January 1, 2018 arising from the change in methodology from LKAS 39 to SLFRS 9 (day 1 impact), the deferred tax impact thereon and the impact of reclassification of asset categories amounted to Rs. 4.822 Bn. was charged against the retained earnings as at January 1, 2018. Consequently, cumulative impairment allowance increased to Rs. 30.733 Bn. as at December 31, 2018 (under SLFRS 9) compared to Rs. 17.261 Bn. as at end 2017 (under LKAS 39).
Operating expenses
Total operating expenses increased by 17.12% to Rs. 23.469 Bn. for the year from Rs. 20.038 Bn. in 2017. The increase corresponds to the impact on staff remuneration consequent to the new collective agreement applicable to non-executive staff, salary revisions to executive staff, and general increase in other overhead expenses in commensurate with the rate of inflation.
Growth in net operating income by 14.57% partly offset by growth in operating expenses by 17.12% saw operating profit before taxes on financial services increased only up to 12.75%. A substantial increase in taxes on financial services (which include Value Added Tax (VAT), Nations Building Tax (NBT) and Debt Repayment Levy (DRL), primarily due to imposition of DRL effective October 01, 2018 (which cost the Bank Rs. 650 Mn. for the 3 months ended December 31, 2018) reduced the growth in operating profit after taxes on financial services to 10.39%.
The Bank’s Cost to income ratio (including taxes on financial services) improved to 46.35% from 51.08% in 2017 while cost to income ratio excluding taxes on financial services too improved to 36.85% from 41.08% in 2017.
Profit before tax and profit after tax
Profit before tax increased to Rs. 25.591 Bn. for the year, up by 10.39% from Rs. 23.183 Bn. reported in 2017. Income tax for the year increased more than proportionately by 21.90% to Rs. 8.047 Bn compared to Rs. 6.602 Bn in 2017, thereby limiting the profit after tax to Rs. 17.544 Bn., a growth of 5.81% compared to growth in profit after tax of 14.25% reported for 2017. The higher increase in income tax was mainly due to removal of tax concessions on income earned on certain Government securities for tax purposes, profit from listed corporate debt instruments, and income earned in foreign currency outside the country being made liable to income tax etc. following the enactment of the Inland Revenue Act No. 24 of 2017 which became effective from April 1, 2018. Consequently, the effective tax rates of the Bank increased as follows:
| 2018 % |
2017 % |
Increase (bps) |
|
| Effective tax rate (excluding taxes on financial services) | 31.45 | 28.48 | 297 |
| Effective tax rate (including taxes on financial services) | 50.57 | 45.87 | 470 |

Segmental performance
All four main business segments recorded robust growth in both business volumes. Personal Banking Division made the highest contribution to the profit before tax, of the Group accounting for 57.70% followed by 10.00% from the Corporate Banking division, 24.26% from International Operations, and 5.13% from Treasury.
Profitability
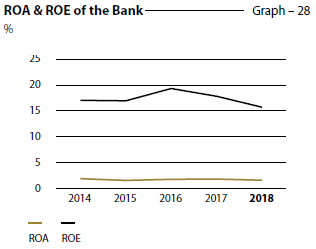
Return on Assets (ROA) and Return on Equity (ROE) reduced to 1.43% and 15.56% as against 1.54% and 17.88% respectively reported in 2017 mainly due to the provisions for additional taxes during the year. Despite the Bank’s ROA and ROE recording decreases during the year, these ratios are well above the industry averages of 1.1% and 13.2%.
Statement of Financial Position
Assets
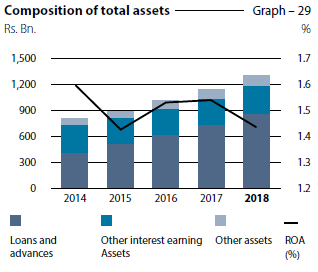
Total assets of the Bank grew by 14.00% during the year to reach Rs. 1.303 Tn. at the year end compared to Rs. 1.143 Tn. as at December 31, 2017, a noteworthy growth of Rs. 160.111 Bn. in absolute terms during the year. 77% or Rs. 123.654 Bn. of which came from loans to customers, reflecting the robustness of the Bank’s primary activities of financial intermediation, and maturity transformation. The asset growth of the banking industry moderated to 14.6% for the year.
Contribution from the Bank’s International Operations now accounts for 11.38% of total assets (11.11% in 2017) and 15.61% of net operating income (11.95% in 2017) of the Group.
Loans to customers
Loans to customers is the single biggest asset of the Bank on its balance sheet, accounting for 66.06% of total assets compared to 64.50% a year ago. The Bank continued to sustain its growth momentum in loans to customers from last year, recording a 16.77% growth to Rs. 861.100 Bn. as at December 31, 2018 compared to Rs. 737.447 Bn. a year ago. This is lower than the industry growth of 19.40% for the year due to conscious decision taken by the Bank to slow down credit growth. Key contributors to the loans to customers growth came from term loans, overdrafts, trade finance, personal loans, and housing loans. Heightened focus on SMEs, new customer acquisition, higher Single Borrower Limit, etc. contributed to this achievement.
Asset quality
The sustainability of the Bank’s operations largely depends on the quality of the portfolio of loans to customers which accounts for two thirds of total assets. Reflecting the industry-wide trend of a deteriorating asset quality, the Bank too experienced an increase in NPLs. However, due to the conservative risk profile with a moderate risk appetite, robust risk management framework and the strengthened recovery initiatives, the Bank managed to contain the increase in the gross and the net NPL ratios to 3.24% and 1.71% as at December 31, 2018 from 1.88% and 0.92%, respectively a year ago and compared to industry averages of 3.40% and 2.00% respectively.
Cumulative impairment allowance for loans to customers as a percentage of the loans to customers as at the end of the year amounted to 3.27% compared to 2.29% in 2017. Provision cover dropped to 47.21% in 2018 from 51.05% in 2017 while open credit exposure ratio (which is net exposure on NPLs as a percentage of regulatory capital) increased from 7.60% at end 2017 to 12.38% as at December 31, 2018 but stood below the industry average of 14.5%.
The loans to customers portfolio of the Bank is fairly well diversified across several industry sectors with exposure to any particular sector not exceeding 20% of the total.
Deposits
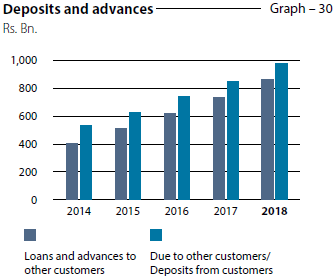
With the solid domestic franchise in Sri Lanka, customer deposits continued to be the single biggest source of funding for the Bank, accounting for 75.42% of the total assets as at December 31, 2018 compared to 74.35% a year ago. Deposits grew by
Rs. 132.909 Bn. or 15.63% during the year and reached Rs. 983.037 Bn. as at December 31, 2018 compared to Rs. 850.128 Bn. as at the previous year end. With the wide gap in interest rates between CASA and time deposits, shift of funds from current and savings accounts to high yielding time deposits continued as evident from the CASA ratio declining further to 37.55% as at December 31, 2018 from 39.23% a year ago. Nevertheless, this compares well with the industry CASA ratio of 32.00%.
Other liabilities
The Bank continued to have a strong and resilient funding profile. Customer deposits and equity capital together funded 84.50% of the total assets as at December 31, 2018 (83.72% in 2017) with all forms of other liabilities such as trade related payables and borrowings accounting for 15.50% or Rs. 202.042 Bn. compared to 16.28% or Rs. 186.147 Bn. as at December 31, 2017. Significant growth in deposits, Rs. 10 Bn. raised from the debenture issue, borrowings of USD 100 Mn. from IFC coupled with the capital funds from the rights issue of shares in 2017 lowered the need for other borrowings during the year. Securities sold under repurchase agreements, borrowings from IFC, China Development Bank, and subordinated liabilities represented significant forms of borrowings as at the year end.
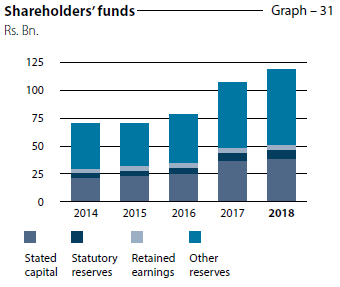
Capital
Reflecting the profitability of the Bank and the prudent dividend policy, equity capital of the Bank grew to Rs. 118.406 Bn. as at December 31, 2018 from Rs. 107.099 Bn. a year ago. With an on balance sheet multiplier (gearing ratio) of 11.0 times compared to the industry average of 11.45 times, equity funded 9.08% of the assets as at the current year end, compared to the 9.37% as at December 31, 2017. Bank ploughed back Rs. 9.609 Bn. out of profit of the year 2017 after setting aside the dividends declared. However, risk weighted assets of the Bank grew by 21.50% to Rs. 944.682 Bn. in 2018. Consequently, both the Common Equity Tier 1 ratio and the total capital ratio decreased to 11.338% (minimum requirement – 8.875%) and 15.603% (minimum requirement 12.875%), respectively as at December 31, 2018, yet exceeding the higher capital adequacy requirements imposed on the Bank under Basel III as a Domestic Systemically Important Bank. Given the pending increase in total capital adequacy ratio to 14% with effect from January 1, 2019, through the deliberations on the corporate plan, the Bank has already made necessary arrangements to augment capital creating sufficient leeway for the planned expansion of the Bank’s operations. The equity multiplier in terms of risk weighted assets marginally improved to 6.41 times from 6.35 times a year ago.
Liquidity
Compared to the liquidity shortage that prevailed in the market during the year, the Bank maintained a healthy liquidity position throughout the year. The Bank is mindful of the trade-off between liquidity and profitability and had a liquid asset ratio of 23.54% as at December 31, 2018 (27.64% as at December 31, 2017). Loans to deposits ratio was 90.55% (88.78% in 2017). Given its importance, review of liquidity is a permanent agenda item in the fortnightly ALCO meetings of the Bank.
Available stable funding based on definitions prescribed by the CBSL stood at Rs. 1.008 Tn. as at December 31, 2018, leading to a Net Stable Funding Ratio (NSFR) of 139.18% (based on the test calculations done) comfortably above the statutory minimum of 100% which is effective from January 2019.
Demonstrating the availability of unencumbered high quality liquid assets at the disposal of the Bank, the Liquidity Coverage Ratio (all currency) stood at 238.69% as at December 31, 2018 as against the statutory minimum of 100% effective from January 2019.
Core Financial Soundness Indicators (FSIs)
Financial soundness indicators given below provide further insights into the financial health and stability of the Bank.
Financial soundness indicators Table – 31
| Financial soundness indicator (%) | 2018 | 2017 | 2016 | 2015 | 2014 |
| Capital adequacy (under Basel II and Basel III): | |||||
| Common Equity Tier 1 ratio | 11.34 | 12.11 | N/A | N/A | N/A |
| Tier 1 capital ratio | 11.34 | 12.11 | 10.37* | 11.60* | 12.93* |
| Total capital ratio | 15.60 | 15.75 | 14.87* | 14.26* | 15.97* |
| Non-performing loans [net of interest in suspense and specific provisions] to equity |
12.71 | 6.39 | 8.65 | 10.36 | 10.95 |
| Equity to total assets | 9.08 | 9.37 | 7.74 | 8.00 | 8.86 |
| Asset quality: | |||||
| Gross NPL ratio | 3.24 | 1.88 | 2.18 | 2.74 | 3.47 |
| Net NPL ratio | 1.71 | 0.92 | 1.09 | 1.41 | 1.86 |
| Total provisions made against gross loans and receivables | 1.97 | 1.40 | 1.53 | 1.75 | 1.65 |
| Provision coverage ratio | 47.21 | 51.05 | 50.11 | 48.49 | 46.34 |
| Earnings and profitability: | |||||
| Net interest income to total operating income | 70.56 | 78.02 | 74.43 | 73.51 | 72.82 |
| Interest margin (Net interest income to average assets) | 3.67 | 3.62 | 3.47 | 3.62 | 3.88 |
| Operating expenses to gross income | 17.00 | 17.33 | 20.20 | 22.22 | 21.62 |
| Impairment charge to total operating income | 13.46 | 1.39 | 3.47 | 9.55 | 8.64 |
| Return on assets | 1.43 | 1.54 | 1.53 | 1.42 | 1.60 |
| Return on equity | 15.56 | 17.88 | 19.52 | 16.90 | 17.01 |
| Cost to income ratio | 46.35 | 51.08 | 51.06 | 48.92 | 49.26 |
| Liquidity: | |||||
| Statutory liquid assets ratio (DBU) | 24.47 | 27.28 | 27.19 | 26.24 | 33.15 |
| Statutory liquid assets ratio (OBU) | 30.20 | 30.95 | 30.19 | 49.13 | 31.43 |
| Liquidity Coverage ratio (All currency) | 238.69 | 209.17 | 150.45 | – | – |
| Net Stable Funding ratio | 139.18 | 127.87 | – | – | – |
| CASA ratio | 37.55 | 39.23 | 41.67 | 49.70 | 48.38 |
| Gross Loans to deposits ratio | 90.56 | 88.78 | 85.64 | 84.31 | 79.79 |
| Assets and funding structure: | |||||
| Deposits to total assets | 75.42 | 74.35 | 73.06 | 70.94 | 66.54 |
| Borrowings to total assets | 4.86 | 4.28 | 3.37 | 2.50 | 2.85 |
| Equity to total assets | 9.08 | 9.37 | 7.74 | 8.00 | 8.86 |
| Deposits to gross loans | 110.43 | 112.64 | 116.76 | 118.61 | 125.33 |
*Computed under Basel II guidelines
Subsidiaries and associates
The group structure of the Bank consists of the Bank and six subsidiaries (including three foreign subsidiaries) and two associates as depicted in the section on Annex 12 in the chapter on Annexes
Given below is an overview of operations of the subsidiaries and associates of the Bank.
Commercial Development Company PLC (CDC)
Established in 1980 as the Bank’s first subsidiary, CDC was responsible for building the present Head Office building of Commercial Bank, “Commercial House”. The Bank holds a 92.41% stake in CDC as at end of 2018, which is the only listed Subsidiary of the Group, which handles a major portion of the Bank’s utility services. A large part of its income is derived from rental earned on building, hiring of vehicles to the Bank, and outsourcing staff.
CDC recorded a post-tax profit of Rs. 328.546 Mn. for the year 2018, recording a decrease of Rs. 98.234 Mn. from Rs. 426.780 Mn. recorded in the previous year. The decrease in profit was primarily attributable due to a lower gain recognised on revaluation of the investment property in 2018.
ONEzero Company Ltd. (ONEzero)
ONEzero is a wholly-owned subsidiary of the Bank that provides Information Technology Services and Solutions to the Bank. Its four main lines of business are:
- provision of hardware and software related support services
- supply of computer hardware and licensed software
- development of software and
- outsourcing of professional and skilled manpower to the Bank
Company recorded a post-tax profit of Rs. 64.261 Mn. for the year 2018, a significant growth of 45.15% compared to the previous year.
Serendib Finance Limited (SFL)
SFL is a 100% owned subsidiary of the Bank and is a Licensed Finance Company (LFC) under the Finance Business Act No. 42 of 2011.
SFL has grown and expanded its asset base up to Rs.5.425 Bn. by end 2018 since the acquisition of the company, which had a total asset base of Rs. 1.8 Bn. in 2014.
Upon acquisition by the Bank, SFL underwent vast changes in risk management and corporate governance structures. Subsequent to new business plans and strategies devised, the company has shown signs of reaching its true potential during
the last quarter of the year.
The leasing business, the Company’s key strength, performed well over the past four years, although at a slower pace due to regulatory restrictions.
SFL’s is on course to improve its performance in the near future based on its current business strategy which is twofold;
- To capitalise on business strengths by utilising its existing resource base and employing professional lending staff for non-leasing business. SFL has been able to disburse a substantial amount in new lending facilities towards end of the year.
- Improve the risk profile of the asset portfolio by enhanced lending to higher investment grade customers and strengthening the recovery function of the Company.
These strategies are expected to contribute towards enhanced profitability in 2019.
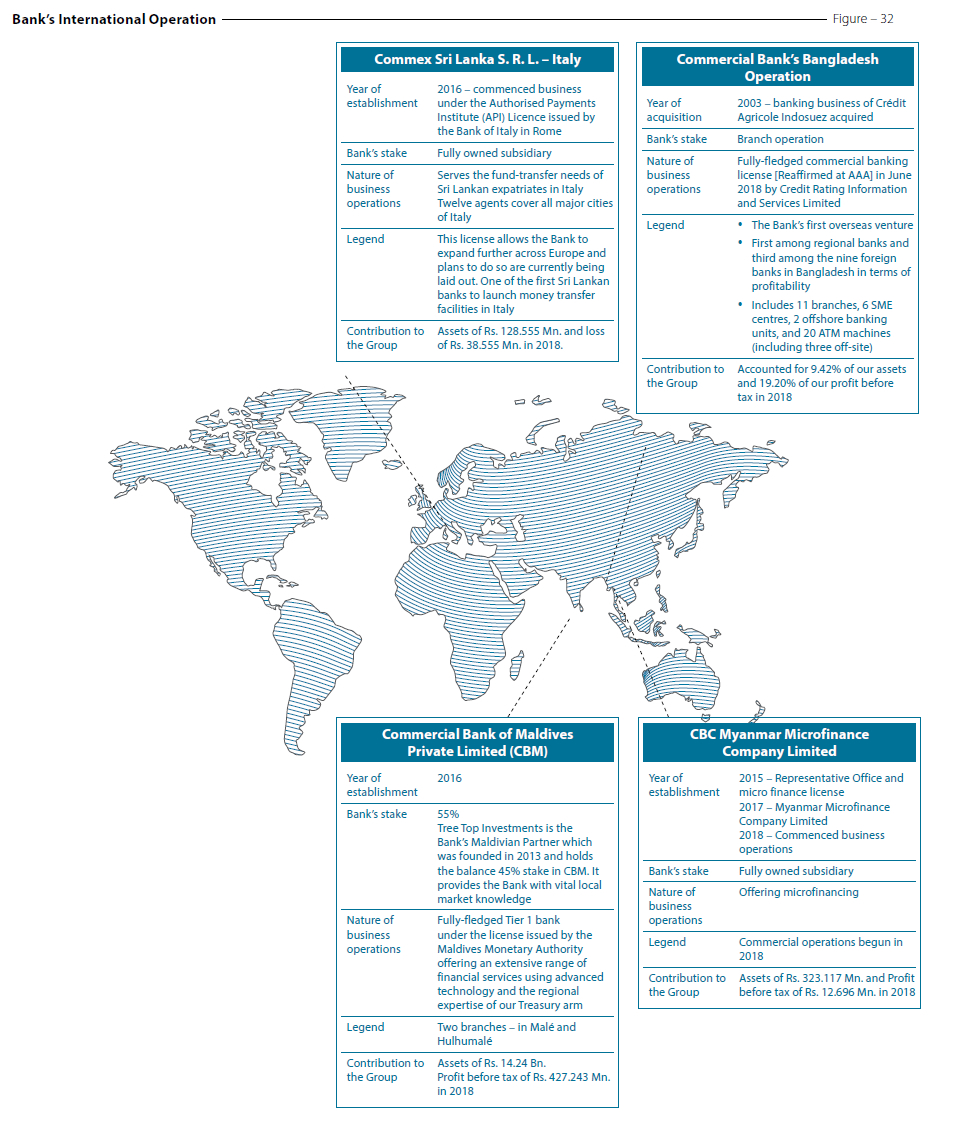
Commercial Bank of Maldives Private Limited (CBM)
CBM was founded in May 2013 together with Tree Top Investments, the Bank’s Maldivian partner, which contributes vital local market knowledge to the team and has a stake of 45% while Commercial Bank holds a 55% stake in the company. Established during the latter part of 2016, CBM opened its Head Office and first branch in the capital, Malé. During the year, it opened its second branch on the island of Hulhumalé.
While offering an extensive range of financial services, CBM’s goal is to be the most technologically advanced, innovative, customer friendly, and the most sought-after financial service organisation in the Maldives.
In its second year of operation, CBM recorded a post-tax profit of Rs. 270.67 Mn., an impressive growth of Rs. 237.69 Mn. compared to Rs. 32.98 Mn. in 2017.
CBC Myanmar Microfinance Company Limited (CBC Myanmar)
CBC Myanmar is a fully-owned subsidiary of the Bank that was established to capitalise on opportunities available in the microfinance sector in Myanmar. In early 2018, the Bank obtained its microfinance business license from the Financial Regulatory Department (FRD) of Myanmar and commenced operations in the region of Nay Pyi Taw.
Similar to the concept of Grameen banking, the operations in Myanmar presently offer group loans to customers with a compulsory saving requirement. Plans are afoot to provide individual loans to established micro and small entrepreneurs during the first quarter of 2019.
By end December 2018, after just six months in operation, CBC Myanmar was able to develop a loan portfolio serving over 2,300 customers.
Commex Sri Lanka S.R.L. (Commex)
Commex, a fully-owned subsidiary of Bank, began money transfer operations in Italy, in 2016. As a result, Commercial Bank became the first Sri Lankan bank to be licensed by the Central Bank of Italy to operate as a money transfer company. The license allows Commex to expand across the European Union using passporting rights.
By further increasing the total number of agents to twelve, during the year, Commex expanded its agent network to Napoli and Messina, two major cities situated in the South where a large number of Sri Lankan expatriates reside.
Commex moved people with the right skills into key management positions in the region to ensure it remained poised to make the best of potential opportunities. This helped the subsidiary to fully comply with the General Data Privacy Regulation (GDPR) imposed by the European Union since mid-2018.
Commercial Insurance Brokers (Pvt) Ltd. (CIBL)
The Bank holds an indirect stake of 18.48% in CIBL, through its subsidiary Commercial Development Company PLC. The line of business of CIBL includes insurance brokering for all types of insurance through reputed life and general insurance companies in Sri Lanka.
CIBL recorded a profit after tax of Rs. 32.828 Mn. for the year ended 2018 up from Rs. 28.711 Mn. in 2017. The company’s total assets stood at Rs. 344.009 Mn. as at December 31, 2018.
Equity Investments Lanka Ltd. (EQUILL)
The Bank owns a 22.92% stake in EQUILL, a venture capital company established 28 years ago. EQUILL invests in equity and equity featured debt instruments.
The Company recorded a post tax loss of Rs. 0.241 Mn. compared to the loss of Rs. 6.716 Mn. recorded for the previous financial year.
Returns to shareholders
The Bank’s business model enables creating value for its shareholders by delivering value to various stakeholders and deriving value from them in turn. Such value created enables the Bank to enhance shareholder wealth both in the short and long term through dividend payments and capital gains arising from increases in the market price. The Bank’s dividend policy seeks to balance the short-term shareholder returns, while also supporting business expansion in the long-term.
Bank proposed a final dividend of Rs. 2.00 per share for the year ended December 31, 2018 which together with the two interim dividends paid add up to a total dividend of Rs. 6.50 for the year. Reflecting the overall trend in the market, the Bank’s shares were trading at 0.98 times marginal discount to its book value as at December 31, 2018, but has the highest market capitalisation among all the banks listed on the CSE.
Commercial Bank of Ceylon PLC – Bangladesh Operations
Bangladesh has made substantial progress in growing its economy, lifting people out of poverty, and improving the lives of its people by increased employment, increased access to health and education, and improved basic infrastructure. With a forecast real GDP growth of 7.1% up to 2030, Bangladesh is poised to become the 26th largest economy in the world by 2030 – up from its current ranking of 42. Over the past decade alone, Commercial Bank of Ceylon PLC (CBC), Bangladesh, has taken great strides and contributed towards this economic growth and improve the lives of its people.
During the past 15 years, our Bangladesh operations have grown to take on a leadership position among the country’s regional banks. Its network now comprises 11 branches, 6 SME centres, 2 Offshore Banking Units, and 20 ATMs (including 3 in off-site locations). In addition, the Bank recently introduced Automatic Banking Centres (ABCs), through which customers can make real-time cash and cheque deposits round the clock.
Our proven expertise together with market knowledge in foreign exchange, money market, fixed income products, and the ability to offer consistent, cost-effective fund management as well as trade finance services in Bangladesh, provides us with an edge over competition. Online banking continues to gain in popularity with the total number of online fund transfers amounting to BDT 656 Mn. during the year.
Against strong competition from international and large local banks, we were named best Regional Bank in terms of performance in deposits, advances, and profitability. Our remit in Bangladesh includes Corporate Banking, Retail Banking, and Treasury Operations.
Key performance indicators during the year, including past statistics
The progress of the Bank in core banking areas is detailed below.
(Amount in BDT Mn.) Table – 32
| Particulars | 2018 | 2017 | 2016 | 2015 | 2014 | Percentage change from 2017 to 2018 |
| Total deposits | 35,221.65 | 28,808.18 | 23,124.88 | 21,935.55 | 18,633.81 | 22.26 |
| Gross advances | 38,448.10 | 32,113.53 | 24,456.51 | 22,621.26 | 18,328.43 | 19.73 |
| Profit before tax and provisions | 2,439.98 | 1,817.79 | 1,478.40 | 1,798.66 | 1,675.81 | 22.26 |
| Profit before tax | 2,439.98 | 1,758.56 | 1,381.93 | 1,592.10 | 1,630.56 | 38.75 |
| Profit after tax | 1,406.65 | 988.4 | 785.13 | 904.1 | 947.49 | 42.32 |
All information above is based on management accounts
Key financial ratios for the past five years is as follows:
Our cost to income ratio has reduced over the past five years, as a result of leveraging the expertise and state-of-the-art systems and processes of our Sri Lankan operations. One of the most preferred employers in the banking industry in Bangladesh, the Bank’s annual profit per employee increased over 2018 due to investments made by the Bank in training and developing our people.
Table – 33
| Ratio | 2018 | 2017 | 2016 | 2015 | 2014 | Change from 2017 to 2018 |
| Cost/Income ratio (%) | 25.28 | 28.62 | 32.76 | 24.98 | 28.15 | 3.34 |
| Net interest margin (%) | 4.53 | 4.46 | 5.11 | 6.44 | 6.30 | 0.07 |
| Profit per employee (in Mn. BDT) | 8.16 | 6.26 | 5.38 | 6.24 | 7.73 | 1.90 |
| Return on asset (gross) (%) | 4.31 | 3.81 | 3.74 | 4.63 | 5.09 | 0.50 |
| Return on capital employed (%) | 13.29 | 11.18 | 9.90 | 12.61 | 14.86 | 2.11 |
Recognition received during the year
During the year, the UK-based Global Business Outlook magazine awarded the Bank “Best Foreign Bank” in Bangladesh. The Bank also received a “AAA” rating for the 8th consecutive year from Credit Rating Information and Services Limited (CRISL) based on 2017 financial statements. For our customers – particularly in the corporate sector – our regional footprint affords greater opportunity and support for growth with their trusted Bank (Refer for information on local subsidiaries). Our work in this area helps us to contribute towards Sustainable Development Goals 17: Partnerships for the Goals, as we promote international trade, help developing countries in the region to increase their exports, and promote investment for the least developed.
Future outlook
Currently, the Bank is present in five key districts, namely: Dhaka, Chittagong, Sylhet, Narayangonj and Gazipur. Plans to cover one more district by 2019 are currently under way.
Despite severe competition among international and large local banks, CBC has recorded consistent growth in business volumes specially catering to multinationals and large local corporates by offering better service and commitment.
As our branch network and other customer touchpoints keep on expanding, we continue to provide integrated products and service offering that are relevant to varying customer segments. We have begun gradually attracting SME and retail clients, which will help us to improve profitability and mobilise low cost deposits in the medium term.