CITIZENS DEVELOPMENT BUSINESS FINANCE PLC
ANNUAL REPORT 2020/21


Chief Financial Officer’s Analysis

“CDB reported a consistent performance for the year under review, which is a manifestation of the resilience of our business model, the soundness of our strategy and the robustness of our risk management framework.”
GRI 102-7
An overview
Overall, the performance of the Non-Bank Financial Institutions (NBFIs) sector is projected to have suffered a setback during the financial year 2020/21 in terms of business volumes. Loans & advances, deposits and total assets of the sector are expected to have come down while asset quality too deteriorated. However, based on the interim financials available so far, almost all the large NBFIs in our peer group appear to have weathered the storms well and managed to report growth or maintain their asset bases, a demonstration of the strength of their franchises. Profitability in terms of both ROA and ROE appear to have improved as a result of the increase in profit after tax and the slow growth in assets and equity. Improvement in cost to income ratio mainly as a result of operational efficiencies arising from changes to the business model such as work from home arrangements and increased patronage of digital channels by stakeholders, customers in particular and containment of discretionary expenses coupled with the drop in income tax rate from 28% to 24%, are expected to have had a positive impact on profit after taxation. Liquidity and capital too appear to have been maintained at fairly comfortable levels partly due to the lower demand for credit during the year and also due to a conscious decision of some of the players to maintain excess liquidity given its paramount importance in the event of any contingency situation.
Performance of the sector as well as our performance should be reviewed in the context of the volatile, uncertain, complex and ambiguous operating environment that prevailed as elaborated on page 30 of this Annual Report. CDB was no exception. However, CDB reported a consistent performance for the year under review, which is a manifestation of the resilience of our business model, the soundness of our strategy and the robustness of our risk management framework. It is also a demonstration of how truly we lived by and meant our purpose of empowering aspirations of our stakeholders
Let me explain.
Business volumes
Loans and receivables
With the initial lockdown, the Company experienced a drastic drop in new lending business in the first quarter of the year. However, it gradually recovered in the subsequent quarters and by the fourth quarter, the Company reached about 95% of the pre-COVID new business volumes. With the major portion of the revenue being generated from motor vehicle leases in our business model, import restrictions undoubtedly had a significant adverse impact on business volumes. As a result, we experienced a clear shift from leases for brand new vehicles to leases for registered vehicles. Another challenge we faced was the unusually high early settlements of leases which more than doubled our historical experience due to the stress situation in arrears positions as well as higher vehicle prices. The first lockdown severely impacted our monthly collections too, but I am happy to note that by the end of the second quarter, we managed to reach our pre-COVID collection levels. Yet again, the second outbreak somewhat impacted our collections, but by March 2021 we were back at pre-COVID levels.
With the unusually higher vehicle prices in the market, we faced a challenging situation with regard to new leases. Higher prices exposed the Company to higher Loan To Value (LTV) ratios which may potentially cause additional risk in the event the vehicle prices come down during the tenure of such lease agreements. The underlying risk was compounded when we had to underwrite new business at substantially lower interest rates. We took adequate precautions to maintain our exposures at acceptable levels by maintaining the LTV at lower levels by discounting the value of the vehicles to some extent taking the pre-COVID market prices into account.
Accordingly, we managed to do sufficient new lending business to maintain our lending portfolio by replenishing the monthly capital repayments, early settlements and maturities of the existing portfolio. The growth in the lending portfolio in fact came from gold related loans, which experienced a growth of Rs. 2,206 Mn. or 47%, helping us to further diversify the loan portfolio and to improve the short-term assets in the maturity profile. Consequently, our gross lending portfolio grew by 5% to Rs. 78,799 Mn. compared to the 4% contraction experienced by the NBFI sector. Managing to maintain the total assets at the pre-COVID level, leaving alone a growth, itself is a significant achievement, something the vast majority of the players failed to achieve as evident by the decrease in total assets of the industry by 3% as at 31 March 2021. The below analysis demonstrates the behaviour of the lending portfolio by each quarter of the financial year reflecting how business volumes and recoveries progressed.
Analysis of new lending business volumes and settlements
| Q1
(Rs. Mn.) |
Q2
(Rs. Mn.) |
Q3
(Rs. Mn.) |
Q4
(Rs. Mn.) |
Year (Rs. Mn.) |
|
| Lending Portfolio (Net of Provisions) B/F | 72,423 | 73,695 | 74,778 | 75,085 | 72,423 |
| New Credit underwrite | 2,100 | 8,750 | 7,521 | 9,819 | 28,190 |
| Repayment of loans/ leases | (639) | (7,282) | (6,779) | (9,734) | (24,434) |
| Impairment Provision for the period | (189) | (385) | (435) | (112) | (1,121) |
| Lending Portfolio (Net of Provisions) C/F | 73,695 | 74,778 | 75,085 | 75,058 | 75,058 |
Deposits from customers
Contrary to the initial expectations of a flight of deposits from the NBFI sector to the Banking sector and a projected drop in deposits of a majority of the sector players leading to a drop in total deposits of the sector, CDB managed to grow its deposit base by 13% from Rs. 43,306 Mn. as at 31 March 2020 to Rs. 48,999 Mn. as at 31 March 2021. Both time deposits and savings deposits recorded growth during the year. Consequently, deposits to debt composition increased to 64% from 56% a year ago.
Growth in deposit base in the last five years
| 2020/21 (Rs. Mn.) |
2019/20
(Rs. Mn.) |
2018/19
(Rs. Mn.) |
2017/18 (Rs. Mn.) |
2016/17
(Rs. Mn.) |
|
| Time deposits | 45,648 | 40,783 | 44,945 | 42,331 | 30,889 |
| Savings deposits | 2,915 | 2,267 | 2,014 | 1,991 | 1,568 |
| Mudharabah | 436 | 256 | 264 | 388 | 145 |
| Total deposits | 48,999 | 43,305 | 47,223 | 44,710 | 32,602 |
Growth in the deposit base by Rs. 5,694 Mn. and the shareholders’ equity by Rs. 2,496 Mn. during the year compared to the nominal growth in total assets enabled us to reduce our reliance on term borrowings, although it had an adverse impact on the maturity profile when viewed on the basis of contractual maturities.
Income
Fund-based income
Demonstrating the strength of our solid franchise, net interest income for the period increased by 14% to Rs. 7,595 Mn. from Rs. 6,639 Mn. in the previous year. This was consequent to the drop in interest income by 5% being more than offset by a drop in interest expense by 19%. Consequently, NIM improved to 8.10% for the year from 7.17% a year ago.
Interest earning assets as a percentage of total assets continued to maintain around 88%, while Interest bearing liabilities as a percentage of total liabilities stood at 95% as at 31 March 2021 compared to 94% as at 31 March 2020. Interest earning assets to interest bearing liabilities continued to be maintained at around 110%.
Besides the downward trend experienced in interest rates, excess liquidity invested in low-yielding assets which generated a negative return too had an adverse impact on the average rate on interest earning assets during the year.
Fee-based income
Fee-based income from fees and commissions and other operating income recorded a marginal increase of Rs. 19.40 Mn. for the year. Other operating income recorded a growth of 9% or Rs. 113 Mn. mainly due to the increase in early settlement income which more than offset the decrease in fees and commission income of 19% or Rs. 94 Mn.
Growth in net interest income coupled with the increase in fee and commission income contributed to the growth in total operating income by 12% to Rs. 9,340 Mn. for the year from Rs. 8,365 Mn. in 2019/20.
Operating expenses
We managed to improve on our plans at the outset of the year of containing operating expenses in the year under review at the levels of the previous year. As a result, total operating expenses for the year decreased by 6% from Rs. 4,081 Mn. in 2019/20 to Rs. 3,830 Mn. in 2020/21.
While decreases were seen across all major categories of operating expenses, the most significant saving of 15% came from personnel expenses which decreased from Rs. 1,651 Mn. to Rs. 1,402 Mn. The main contributory factors for the savings from personnel expenses were working from home arrangements due to COVID-19 pandemic related lockdowns and curtailment of discretionary expenses. With due regard to the volatile and uncertain times ahead, certain decisions were also taken with regard to the employee benefits and emoluments. It is noteworthy to mention here that, with our employee-focused HR strategy, we did not retrench a single staff member or resort to pay cuts. The marketing budget was slashed during the year while increasingly resorting to marketing and communications on the website and digital media.
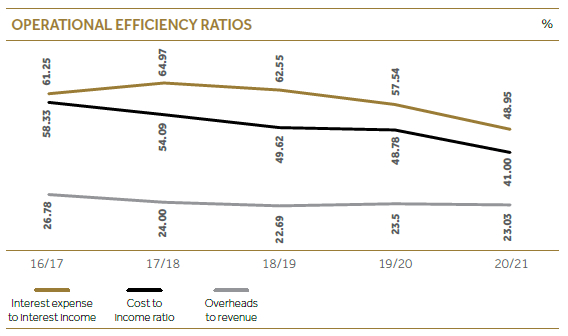
Growth in operating income and the containment of costs saw the cost to income ratio (excluding taxes on financial services) for the year under review decrease to 41% from 49 % in 2019/20, signifying operational efficiencies.
Asset quality and impairment provisioning
On average, our lending portfolio accounts for 80% of our total assets and hence, it is needless to say that the quality of our assets portfolio depends heavily on the quality of the lending portfolio. I am happy to report that the economic slowdown did not lead to an increase in defaults. It is noteworthy that 69% of our lending portfolio comprises leasing while gold loans accounts for 9%. As a result of the abnormally higher vehicle prices, lessees undergoing stress conditions with regard to their repayments either by themselves or based on our advice at times, opted to dispose their vehicles and settle the lease contracts.
Historically, we have been maintaining our LTV ratio lower than the industry average and it is yet another reason for our lower NPA ratio.
At a time when the industry was experiencing a significant deterioration in asset quality, CDB managed to maintain its asset quality at a level substantially lower than the industry average as evident from the NPA ratio (gross) of 7.00% (7.54% in in 2019/20) compared to the industry average of 11%. Improvement in asset quality led the impairment provision for the year to decrease to Rs. 1,422 Mn. compared to Rs. 1,553 Mn. last year. Provision cover too improved accordingly from 49.34% in 2019/20 to 69.12% in the current year. Open credit exposure ratio came down to 39.22% as at 31 March 2021 from 47.55% a year ago.
Asset quality and impairment provision of the last 5 years
| 2020/21 | 2019/20 | 2018/19 | 2017/18 | 2016/17 | |
| NPA ratio (Gross) (%) | 7.00 | 7.54 | 6.68 | 3.07 | 3.08 |
| NPA ratio (Net) (%) | 2.21 | 4.24 | 3.84 | 0.89 | 1.05 |
| Impairment provision (Rs. Mn.) | 3,741 | 2,667 | 2,064 | 1,336 | 895 |
| Provision cover (%) | 69.12 | 49.34 | 44.12 | 71.60 | 66.44 |
| Open credit exposure ratio (%) | 39.22 | 47.55 | 51.54 | 21.22 | 20.63 |
Except for the 2.00% personal loans portfolio, the rest of the lending portfolio is asset backed with a lower LTV ratio and as a result, our LGD is relatively lower. Historically our loss rates have been significantly lower compared to the industry. Our NIM which was 8.10% in 2020/21 too makes a statement about the risk profile of the customers that we cater to.
All these factors combined contributed to the decrease in the impairment provision for the year compared to the previous year.
Stage-wise break down of the lending portfolio and the impairment provision is given below.
| Product | Stage 1
(Rs. Mn.) |
Stage 2
(Rs. Mn.) |
Stage 3
(Rs. Mn.) |
Total
(Rs. Mn.) |
| Lending portfolio | 63,779 | 8,105 | 6,915 | 78,799 |
| Impairment provision | 394 | 561 | 2,786 | 3,741 |
Performance of loans under moratoria
Guided by our purpose, CDB extended 2 months deferment of installments for over 90% of the lending portfolio even without a request from the borrowers, during the first round of the moratorium announced by the Central Bank of Sri Lanka in March 2020. At the end of the two months, we extended the moratorium for a further period of three to six months for over 52% of the lending portfolio at the request of the borrowers. We are delighted to report that over 94% of the lending portfolio that were given moratorium are being satisfactorily repaid as at the financial year end.
A detailed analysis of the loan portfolio that went under moratorium is given below.
Extent of the lending portfolio that went under moratoria
| No. of
Moratoriums |
% of
Moratoriums |
Exposure
Rs. Mn. |
% of
Moratorium exposure |
|
| First moratorium | ||||
| For 2 months | 33,366 | 36 | 24,762 | 42 |
| For 3 months | 43,272 | 46 | 25,188 | 43 |
| For 4- 6 months | 5,970 | 6 | 7,430 | 13 |
| Second moratorium | ||||
For 6 months |
10,991 | 12 | 1,724 | 3 |
Total moratorium |
93,599 | 100 | 59,104 | 100 |
Status of the lending portfolio that was granted moratorium, as at 31 March 2021
| No of Accounts | ||||
| No. of
Moratoriums |
% of
Moratoriums |
Exposure
Rs. Mn. |
% of
Moratorium exposure |
|
| Satisfactory repayments | 63,965 | 68 | 38,978 | 66 |
| Rescheduled/Restructured | 1,654 | 2 | 2,737 | 5 |
| Irregular repayments | 6,438 | 7 | 5,212 | 8 |
| Fully settled and exit | 21,542 | 23 | 12,176 | 21 |
| Total | 93,599 | 100 | 59,104 | 100 |
5%
growth in the gross lending portfolio to Rs. 78,799 Mn. compared to the 4% contraction experienced by the NBFI sector.
13%
growth in the CDB deposit base to Rs. 48,999 Mn.

We are delighted to report that over 94% of the lending portfolio that were given moratorium are being satisfactorily repaid as at the financial year end.
Profitability
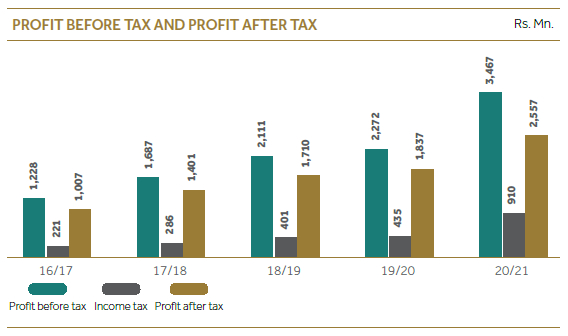
Increase in the net operating income by 16% and the decrease in the total operating expenses by 6% increased the operating profit before taxes on financial services for the year by 50% to Rs. 4,089 Mn. from Rs. 2.731 Mn. in 2019/20. Value added tax on financial services saw an increase proportionate to the increase in pre-VAT profit. Profit before tax increased by 53% for the year to Rs. 3,467 Mn. against Rs. 2,272 Mn. in 2019/20. Despite the salutary impact on the tax provision from the decrease in income tax rate from 28% to 24% effective from 1 January 2020, provision for income tax increased by 109% to Rs. 910 Mn. compared to Rs. 435 Mn. in 2019/20, thereby limiting the increase in the profit after tax to 39%. Accordingly, the Company recorded a profit after tax of Rs. 2,557 Mn. for the year under review as against Rs. 1,837 Mn. in 2019/20. Earnings per share increased to Rs. 36.64 from Rs. 26.32 a year ago.
Increase in profit after taxation coupled with relatively lower growth seen in total assets and shareholder equity during the year led to significant improvements in profitability. Accordingly, both Return on Average Assets (after tax) and Return on Average Equity increased to 2.73% and 19.97% for the year compared to 1.98% and 17.99% reported in 2019/20.
Liquidity
Given the well-structured nature of our balance sheet, asset liability maturity mismatches are low, generally within the ALCO approved limits, particularly when we take into account the behavioural patterns going beyond the contractual maturities, both in relation to early settlements on the asset side and hardcore deposits based on the consistent deposit renewal ratio. With the uncertainties surrounding the operating environment, we increased the frequency of conducting stress testing on liquidity. Accordingly, we were confident of managing our cash flows even under stressed conditions. Although the industry envisaged concerns with regard to liquidity at the initial stages of locked down and experienced a shift of some deposits from the NBFIs to the Banking sector, we were very comfortable in our liquidity throughout the year. In fact, there was excess liquidity towards the latter part of the year which had to be invested in low yielding assets due to lacklustre credit demand, with adverse impact on our NIM. However, presence of a substantial gold loan portfolio with short term maturities (80% due to mature within two months at any given point in time) as well as a sizable percentage of early settlements and the resulting re-pricing possibility helped us to manage the interest rate risk relating to the assets and liabilities. In other words, the structure of our assets and liabilities is such that in both an upward interest rate as well as a downward interest rate scenario, we have leeway to manage the interest rate risk.
The fact that ours is a very liquid asset portfolio with over 90% of the lending portfolio being contracts with monthly instalment repayments too contributed to maintaining liquidity at comfortable levels.
Asset liability mismatch based on contractual maturities versus behavioural maturity patterns
| Upto 1 year
(Rs. Mn.) |
1 – 3 years
(Rs. Mn.) |
3 – 5 years
(Rs. Mn.) |
Over 5 years
(Rs. Mn.) |
Unclassified
(Rs. Mn.) |
|
| Based on contractual maturities (Assets – Liabilities) |
(3,053) | 5,113 | 2,990 | 3,901 | (8,951) |
| Based on behavioural maturities (Assets – Liabilities) |
18,380 | 2,041 | (2,682) | (1,558) | (16,181) |
Capital
As evident from the table below, the Company has been improving its capital adequacy ratios over the past several years and is in a comfortable position today in meeting even higher capital adequacy requirements stipulated under guidelines on the Sector Consolidation and the Prompt Corrective Action of the Central Bank of Sri Lanka. Growth in the gold loans portfolio as well as growth in overall risk-weighted assets being limited to 3% during 2020/21 had positive impacts on capital adequacy.
Capital adequacy ratios
| 2020/21 | 2019/20 | 2018/19 | 2017/18 | 2016/17 | |
| Core Capital Ratio (%) | 12.10 | 10.25 | 8.09 | 10.64 | 12.32 |
| Total Capital Ratio (%) | 15.34 | 13.29 | 11.07 | 13.93 | 14.12 |
The Company also has a capital augmentation plan in place in order to ensure availability of capital commensurate with the plans for expansion of business in the years to come and the risk profile of the business.
Shareholder returns
Taking improved profitability for the year, the concerns on the uncertain and volatile operating environment ahead of us, and our growth plans in the upcoming years into account, the Directors decided to recommend a first and final dividend for 2020/21 of Rs. 7.50 per share for approval by the shareholders at the forthcoming annual general meeting to be held on 30 July 2021.
Market prices of both voting and non-voting shares witnessed substantial increases during the year, thereby increasing the Company’s market capitalisation to Rs. 7,283 Mn. from Rs. 4,750 Mn. a year ago. Accordingly, closing market prices of voting and non-voting shares were Rs. 110.00 and Rs. 71.90 as at 31 March 2021 compared to Rs. 72.10 and Rs. 44.80 as at 31 March 2020. Appreciation of the prices by 53% and 60% respectively for voting and non-voting shares compares well against the increase in the ASPI index during the year of 56%.
Outlook for 2021 and beyond
Despite the earlier expectation of a faster emergence of the new normal, the pandemic is still ranging in many nations including our neighboring country, India as I write this review. Even as the pandemic continues to change lives drastically, we expect the world to undergo significant changes making the new normal very different to our earlier expectation.
However, we have gone through many a shock during the first generation and had the resilience to come out of them. We are confident that our purpose coupled with exemplary governance and meticulous execution of strategic plans enables us to build an organisation that is highly resilient to the volatile and uncertain times expected to impact the next generation.
Despite the challenges posed by the uncertain macro-economic context and encouraged by our satisfactory performance in 2020/21 under unprecedented circumstances, we will strongly commit ourselves to the three strategic priorities of Tech-Fin Transformation, One Million Customer Base and A Quarter Trillion Asset Base (Q-TAB) by 2030 in the immediate future. We have already introduced revolutionary changes to the traditional financial services through innovation and technology. We will continue to adapt and realign our strategies to suit the dynamics of the emerging new normal and chart a course of sustainable success.
We believe the use of technology, resulting operational efficiencies and enhanced customer experience will drive profitability, and as a result, the financial services industry will gradually regain its attractiveness to the investors. We expect to be at the forefront of this transformation.

Damith Tennakoon
Executive Director/ Deputy Chief Executive Officer/Chief Financial Officer
10 June 2021