CITIZENS DEVELOPMENT BUSINESS FINANCE PLC
ANNUAL REPORT 2020/21


Investors
A resilient performance
Capital market performance
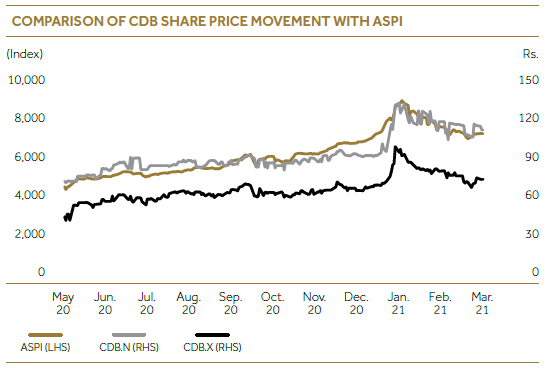
The Colombo Stock Exchange (CSE) has 278 companies with a market capitalisation of Rs. 3,111 Bn. as at 31 March 2021. All Share Price Index (ASPI) and S&P Sri Lanka 20 Index (S&P SL 20) stood at 7,121 and 2,850 respectively.
The issued ordinary shares of Citizens Development Business Finance PLC are listed on the Main Board of the Colombo Stock Exchange.
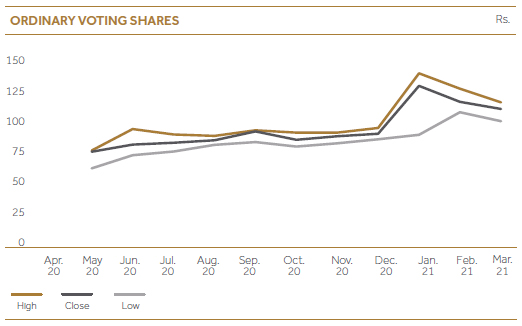
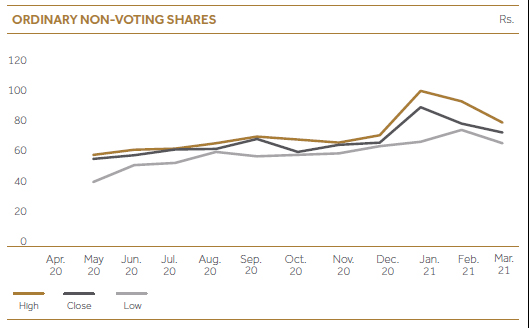
A steady growth momentum is expected, considering the share movement trend of CDB. During the financial year, prices of ordinary voting and ordinary non-voting shares of CDB generated a capital appreciation of 133% and 160% respectively, whereas ASPI performed 55.75% YoY as of 31 March 2021. CDB.N was trading between Rs. 60.10 – Rs. 140.00 and CDB.X was trading between Rs. 38.50 – Rs. 100.00. Overall, CDB stock market capitalisation has appreciated by 53.33% YoY, where Rs. 4.75 Bn. market capitalisation in 2019/20 has grown to Rs. 7.28 Bn.
We have maintained a positive and effective communication with investors and shareholders over the period, leading to enhanced relationships and performance of the organisation. We have connected with the investors through online and offline communication, in order to ensure fair and timely disclosures, and provide relevant information.
Stock exchange listing
The unaudited Interim Financial Statements for the three quarters in the financial year 2020/21 have been submitted to the CSE within the stated 45 day period. The unaudited Interim Financial Statements for the final quarter was submitted to the CSE within the stated 60 days from the Statement of Financial Position date.
Overall share market
Market capitalisation of Rs. 3,111 Bn. reflecting an increase of 46% compared to Rs. 2,128 Bn. in the previous year.
| 31 March 2021 | |
| All Share Price Index (ASPI) | 7,121 |
| S&P Sri Lanka 20 Index (S&P SL 20) | 2,850 |
| Market capitalisation (Rs. Bn.) |
3,111 |
Financial information
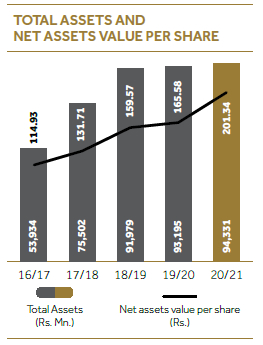
Operating in a very challenging economic context in 2020/21, we recorded a resilient performance, with consistent revenue, recording a 39% YoY growth in profit after tax and a 1.22% growth in our balance sheet as at 31 March 2021. The net asset value per share increased by 22% to Rs. 201.34. Strength of our balance sheet and continued improvement in our financial position reflect our financial stability and financial strength.
Highlights
| 2020/21 | 2019/20 | |
| Price earnings ratio (Times) | 3.00 | 2.74 |
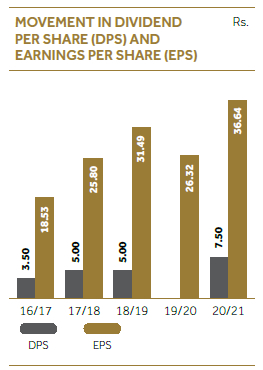
| Earnings per share (Rs.) | 36.64 | 26.32 |
| Net assets value per share (Rs.) | 201.34 | 165.58 |
| Price to Book value (Times) | 0.55 | 0.44 |
| Return on Equity (%) | 19.97 | 17.99 |
| Return on Assets (%) | 2.73 | 1.98 |
| Earnings Yield (%) | 33.31 | 36.50 |
| Dividend Yield (%) | 6.82 | – |
| Dividend pay-out (%) | 20.47 | – |
| Dividend Cover (Times) | 4.89 | – |
| Net interest margin (%) | 8.10 | 7.17 |
| Debt/Equity Ratio (Times) | 5.45 | 6.64 |
| Quick Assets Ratio (Times) | 0.94 | 0.86 |
| Interest Cover (Times) | 1.48 | 1.25 |
For further analysis of the financial performance of the company refer CFO’s analysis on pages 24 - 29.
Dividends
For the financial year ended 31 March 2021, CDB declared a cash dividend of Rs. 7.50 per share for both voting and non-voting shares of Rs. 445,868,100 and Rs. 77,577,510 respectively, which aggregated to a sum of Rs. 523,445,610.
Share price
| Voting | Non -Voting | |||
| 2020/21 Rs. | 2019/20 Rs. | 2020/21 Rs. | 2019/20 Rs. | |
| High | 140.00 | 101.10 | 100.00 | 78.90 |
| Low | 60.10 | 65.80 | 38.50 | 43.00 |
| Last traded | 110.00 | 72.10 | 71.90 | 44.80 |
Performance of the share
Share trading information
Annual transaction information – Ordinary voting shares
| 2020/21 | 2019/20 | 2018/19 | 2017/18 | 2016/17 | |
| Number of transactions | 1,556 | 1,401 | 1,970 | 3,330 | 2,965 |
| Number of shares traded | 2,497,879 | 5,647,980 | 2,735,334 | 7,354,042 | 4,453,153 |
| Value of shares traded (Rs.) | 240,347,905 | 500,892,517 | 229,888,715 | 508,655,792 | 351,201,140 |
Annual transaction information – Ordinary non-voting shares
| 2020/21 | 2019/20 | 2018/19 | 2017/18 | 2016/17 | |
| Number of transactions | 3,341 | 1,267 | 789 | 1,261 | 1,200 |
| Number of shares traded | 4,322,586 | 1,175,929 | 755,533 | 1,172,546 | 1,601,961 |
| Value of shares traded (Rs.) | 306,053,238 | 76,157,195 | 55,384,111 | 70,699,527 | 116,268,214 |
Share price movement
[[QR Code View quarterly summary of voting and non-voting shares]]
Quarterly summary
| Period - Voting | High
Rs. |
Low Rs. |
Close Rs. |
Trade volume | Share volume | Turnover Rs. |
Days traded |
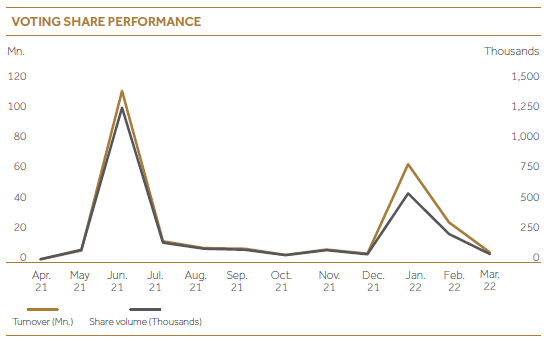
| 2020/21 - Q1 | 93.00 | 60.10 | 80.00 | 139 | 1,290,775 | 113,606,067 | 29 |
| 2020/21 - Q2 | 92.00 | 74.40 | 91.10 | 217 | 291,601 | 25,308,131 | 40 |
| 2020/21 - Q3 | 94.00 | 78.60 | 89.10 | 282 | 145,308 | 12,516,830 | 53 |
| 2020/21 - Q4 | 140.00 | 88.50 | 110.00 | 918 | 770,195 | 88,916,865 | 51 |
| Period – Non-voting | High Rs. |
Low Rs. |
Close
Rs. |
Trade volume | Share volume | Turnover Rs. |
Days traded |
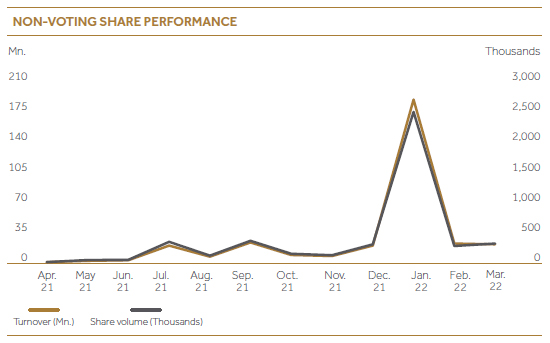
| 2020/21 - Q1 | 60.00 | 38.50 | 56.40 | 254 | 72,314 | 3,764,721 | 32 |
| 2020/21 - Q2 | 69.00 | 51.50 | 67.50 | 886 | 766,413 | 46,678,384 | 61 |
| 2020/21 - Q3 | 69.90 | 57.00 | 65.00 | 715 | 531,951 | 33,523,271 | 59 |
| 2020/21 - Q4 | 100.00 | 65.00 | 71.90 | 1,486 | 2,951,908 | 222,086,848 | 57 |
Market capitalisation
| As at 31 March 2021 |
Number of shares | Market price per share | 2020/21 |
2019/20 |
| Voting | 59,449,080 | 110.00 | 6,539,398,800 | 4,286,278,668 |
| Non-voting | 10,343,668 | 71.90 | 743,709,729 | 463,396,326 |
| 7,283,108,529 | 4,749,674,994 |
Float adjusted market capitalisation
| As at 31 March 2021 |
Number of shares | Market price per share | Market capitalisation (Rs.) | Percentage of public holders (%) | Float adjusted market capitalisation (Rs.) |
| Voting | 59,449,080 | 110.00 | 6,539,398,800 | 44.22 | 2,891,722,149 |
| Non-voting | 10,343,668 | 71.90 | 743,709,729 | 83.13 | 618,245,898 |
| 7,283,108,529 | 3,509,968,047 |
The float adjusted market capitalisation of the Company falls under Option 4 of Rule 7.13.1 (a) of the Listing Rules of the Colombo Stock Exchange, and the Company has complied with the minimum public holding requirement applicable under the said option.
Shareholder analysis
Ordinary voting – Composition according to shareholding
| Resident | Non-resident | Total | |||||||
| Shareholdings | Number of shareholders | No. of shares | Percentage (%) | Number of shareholders | No. of shares | Percentage (%) | Number of shareholders | No. of shares | Percentage (%) |
| 1 to 1,000 Shares | 1,043 | 197,828 | 0.33 | 5 | 1,111 | – | 1,048 | 198,939 | 0.33 |
| 1,001 to 10,000 Shares | 506 | 1,349,419 | 2.27 | 3 | 8,603 | 0.01 | 509 | 1,358,022 | 2.28 |
| 10,001 to 100,000 Shares | 150 | 4,443,182 | 7.47 | 1 | 15,685 | 0.03 | 151 | 4,458,867 | 7.50 |
| 100,001 to1,000,000 Shares | 28 | 5,704,345 | 9.60 | – | – | – | 28 | 5,704,345 | 9.60 |
| Over 1,000,000 Shares | 14 | 47,728,907 | 80.29 | – | – | – | 14 | 47,728,907 | 80.29 |
| 1,741 | 59,423,681 | 99.96 | 9 | 25,399 | 0.04 | 1,750 | 59,449,080 | 100.00 | |
Composition of voting shareholders
| 2020/21 | 2019/20 | |||||
| Categories of shareholders | No. of shareholders | No. of shares | Holding % | No. of shareholders | No. of shares | Holding % |
| Individual | 1,662 | 8,163,576 | 13.73 | 1,771 | 8,735,165 | 14.69 |
| Institutional | 88 | 51,285,504 | 86.27 | 101 | 50,713,915 | 85.31 |
| 1,750 | 59,449,080 | 100.00 | 1,872 | 59,449,080 | 100.00 | |
Ordinary non-voting – Composition according to shareholding
| Resident | Non-resident | Total | |||||||
| Shareholdings | Number of shareholders | No. of shares | Percentage (%) | Number of shareholders | No. of shares | Percentage (%) | Number of shareholders | No. of shares | Percentage (%) |
| 1 to 1,000 Shares | 1,473 | 188,221 | 1.82 | 4 | 916 | 0.01 | 1,477 | 189,137 | 1.83 |
| 1,001 to 10,000 Shares | 170 | 627,921 | 6.07 | 1 | 7,046 | 0.07 | 171 | 634,967 | 6.14 |
| 10,001 to 100,000 Shares | 73 | 2,474,221 | 23.92 | 1 | 39,500 | 0.38 | 74 | 2,513,721 | 24.30 |
| 100,001 to1000,000 Shares | 16 | 3,820,081 | 36.93 | 2 | 216,018 | 2.09 | 18 | 4,036,099 | 39.02 |
| Over 1,000,000 Shares | 2 | 2,969,744 | 28.71 | – | – | 0.00 | 2 | 2,969,744 | 28.71 |
| 1,734 | 10,080,188 | 97.45 | 8 | 263,480 | 2.55 | 1,742 | 10,343,668 | 100.00 | |
Composition of non-voting shareholders
| 2020/21 | 2019/20 | |||||
| Categories of shareholders | No. of shareholders | No. of shares | Holding % | No. of shareholders | No. of shares | Holding % |
| Individual | 1,656 | 4,693,084 | 45.37 | 1,649 | 4,783,572 | 46.25 |
| Institutional | 86 | 5,650,584 | 54.63 | 87 | 5,560,096 | 53.75 |
| 1,742 | 10,343,668 | 100.00 | 1,736 | 10,343,668 | 100.00 | |
Information on share capital movement
| Year | Details Prior to Introduction | Share Type Voting shares | Basis | No. of shares issue | No. of voting shares issues (after issue) | No. of non-voting shares issues (after issue) | New Capital raised |
| 2010 | Introduction | 39,685,048 | |||||
| 2011 | Right Issue | Voting shares @ Rs. 70.00 |
1 for every 6 voting shares | 6,614,175 | 46,299,223 | 462,992,250 | |
| Rights Issue | Non-voting shares @ Rs. 45.00 | 1 for every 7 voting shares | 5,669,293 | 46,299,223 | 5,669,293 | 255,118,185 | |
| 2012 | Scrip issue | Non-voting shares | 1 for every 22.222224 voting shares and non-voting shares | 2,336,691 | 46,299,223 | 8,005,984 | |
| 2019 | Right issue | Voting shares @ Rs. 77.00 | 1 for every 4 voting shares | 11,574,805 | 57,874,028 | 8,005,984 | 891,259,985 |
| Rights issue | Non-voting shares @ Rs. 64.00 | 1 for every 4 non-voting shares | 2,001,496 | 57,874,028 | 10,007,480 | 128,095,744 | |
| 2019 | Scrip issue | Voting shares | 0.02721519 new share for every one existing voting shares issued | 1,575,052 | 59,449,080 | 10,007,480 | |
| Scrip issue | Non-voting shares | 0.03359375 new share for every one existing non-voting shares issued | 336,188 | 59,449,080 | 10,343,668 |
Establishment of an Employee Share Option Plan (ESOP 2021)
In terms of rule 5.6.6 (b) of the listing rules of the CSE, we are pleased to inform you that the Board of Directors of Citizens Development Business Finance PLC has duly resolved to establish an ESOP on the basis outlined below.
Employee Share Option Plan (ESOP 2021)
1. The total number of options to be granted for the period commencing from 1 September 2021 to 1 September 2023 is 2,972,454 ordinary voting shares
2. The number of shares to be issued under ordinary voting shares represents 5%
3. The stated capital as at 31 March 2021 is Rs. 2,350,362,616
4. The number of shares representing the stated capital as at 31 March 2021:
- Ordinary voting shares 59,449,080
- Ordinary non-voting shares 10,343,668
The granting of options under the proposed ESOP is in compliance with the Listing Rules of the CSE and is subject to the Exchange approving, in principle, the issue and listing of shares issued pursuant to such scheme and obtaining shareholder approval, by way of a special resolution at a General Meeting.
List of 20 major shareholders based on their shareholdings as at 31 March 2021
Ordinary voting shares
| . | Name | Shareholding | (%) |
| 1. | Ceylinco Life Insurance Limited Account No.3 | 19,120,225 | 32.16 |
| 2. | Janashakthi Insurance PLC – Shareholders | 3,044,855 | 5.12 |
| 3. | Janashakthi Insurance PLC – Non Par | 2,977,453 | 5.01 |
| 4. | Cargills Bank Limited/Asia Management Consultancy (Private) Limited | 2,444,169 | 4.11 |
| 5. | People's Leasing & Finance PLC/Mr W P C M Nanayakkara | 2,399,957 | 4.04 |
| 6. | Commercial Bank of Ceylon PLC/Janashakthi Limited | 2,384,787 | 4.01 |
| 7. | Ceylinco Insurance PLC Account No.2 (General Fund) | 2,379,654 | 4.00 |
| 8. | Ceylinco Life Insurance Limited Account No.1 | 2,377,871 | 4.00 |
| 9. | Asia Management Consultancy (Private) Limited | 2,345,816 | 3.95 |
| 10. | Seylan Bank PLC/Janashakthi PLC | 2,241,048 | 3.77 |
| 11. | Citizens Development Business Finance PLC A/C 02 (CDB Employee Gratuity Fund) | 2,194,152 | 3.69 |
| 12. | People's Leasing & Finance PLC/Mr S V Munasinghe | 1,316,247 | 2.21 |
| 13. | People’s Leasing & Finance PLC/Mr R H Abeygoonewardena & Mrs V F Abeygoonewardena | 1,301,785 | 2.19 |
| 14. | Seylan Bank PLC/Tennakoon Mudiyanselage Damith Prasanna Tennakoon | 1,200,888 | 2.02 |
| 15. | Mr E Karthik | 551,486 | 0.93 |
| 16. | People's Leasing & Finance PLC/Mrs N D Kodagoda | 503,972 | 0.85 |
| 17. | People's Leasing & Finance PLC/Mr H K Dassanayake | 349,115 | 0.59 |
| 18. | People's Leasing & Finance PLC/Mr I M Kotigala | 327,798 | 0.55 |
| 19. | National Development Bank PLC/Asia Management Consultancy | 325,000 | 0.55 |
| 20. | Janashakthi PLC Account No.1 | 301,588 | 0.51 |
| 50,087,866 | 84.25 | ||
| 9,361,214 | 15.75 | ||
|
|
59,449,080 | 100.00 |
The percentage of shares held by the public as at 31 March 2021 was 44.22% (with 1,735 public shareholders).
Ordinary non-voting shares
| Name | Shareholding | (%) | |
| 1. | J B Cocoshell (Pvt) Ltd | 1,588,251 | 15.35 |
| 2. | Deutsche Bank AG As Trustee for JB Vantage Value Equity Fund | 1,381,493 | 13.36 |
| 3. | Mr Amarakoon Mudiyanselage Weerasinghe | 635,095 | 6.14 |
| 4. | Mr Jafferjee Murtoza Ali | 356,380 | 3.45 |
| 5. | Askold (Private) Limited | 327,840 | 3.17 |
| 6. | Mr Yusuf Husseinally Abdulhussein | 315,554 | 3.05 |
| 7. | Commercial Bank of Ceylon PLC/Andaradeniya Estate (Pvt) Ltd | 286,515 | 2.77 |
| 8. | People's Leasing & Finance PLC /Mr H M Abdulhussein | 274,402 | 2.65 |
| 9. | Essajee Carimjee Insurance Brokers (Pvt) Ltd | 263,520 | 2.55 |
| 10. | Miss Rukaiya Husseinally Abdulhussein | 260,653 | 2.52 |
| 11. | Mr Abbasally Nuruddin Esufally | 217,551 | 2.10 |
| 12. | Avanti Manoja Moonesinghe | 165,375 | 1.60 |
| 13. | Little Smile Organic (Pvt) Ltd | 150,856 | 1.46 |
| 14. | Sabapathi Mudiyanselage Pradeep Lal Jayaratne | 133,966 | 1.30 |
| 15. | People's Leasing & Finance PLC/Mr H A D U G Gunasekera | 115,616 | 1.12 |
| 16. | Gold Investment Limited. | 108,009 | 1.04 |
| 17. | Jafferjees Investments (Pvt) Ltd. | 108,009 | 1.04 |
| 18. | Mukesh Abhaykumar Valabhji | 108,009 | 1.04 |
| 19. | Commercial Bank of Ceylon PLC Account No. 4 |
105,390 | 1.02 |
| 20. | Lakdhanavi Limited | 103,359 | 1.00 |
| 7,005,843 | 67.73 | ||
| 3,337,825 | 32.27 | ||
| 10,343,668 | 100.00 |
The percentage of shares held by the public as at 31 March 2021 was 83.13% (with 1,735 public shareholders).
Directors’ and Chief Executive Officer’s Shareholding as at 31 March 2021
Ordinary voting shares
| . | Name | Shareholding |
| 1. | Mr W P C M Nanayakkara | 1,283 |
| 2. | People's Leasing & Finance PLC/Mr W P C M Nanayakkara | 2,399,957 |
| 3. | Mr T M D P Tennakoon | – |
| 4. | Assetline Leasing Company Ltd/Mr T M D P Tennakoon | 170,151 |
| 5. | Seylan Bank PLC/Mr T M D P Tennakoon | 1,200,888 |
| 6. | Mr S V Munasinghe | – |
| 7. | People's Leasing & Finance PLC/Mr S V Munasinghe | 1,316,247 |
| 8. | Mr R H Abeygoonewardena/Mrs V F Abeygoonewardena | 5,652 |
| 9. | Peoples's Leasing & Finance PLC/Mr R H Abeygoonewardena & Mrs V F Abeygoonewardena | 1,301,785 |
| 10. | Mr D A De Silva | – |
| 11. | Dialog Finance PLC/D A De Silva | 117,550 |
| 12. | Dr A Dharmasiri | – |
| 13. | Mr S P P Amaratunge | – |
| 14. | Mr J R A Corera | 1,027 |
| 15. | People's Leasing & Finance PLC/Mr J R A Corera | 21,622 |
| 16. | Mr J P Abhayaratne | – |
| 17. | Mr E Karthik | 551,486 |
| 18. | Mrs P R W Perera | – |
| 19. | Mr S Kumarapperuma | – |
| 20. | Mr E R S G S Hemachandra | – |
| 7,087,648 |
Ordinary non-voting shares
| . | Name | Shareholding |
| 1. | Mr W P C M Nanayakkara | 56 |
| 2. | Mr T M D P Tennakoon | – |
| 3. | Seylan Bank PLC/Tennakoon Mudiyanselage Damith Prasanna Tennakoon | – |
| 4. | Mr S V Munasinghe | – |
| 5. | Mr R H Abeygoonewardena/Mrs V F Abeygoonewardena | 99,653 |
| 6. | Peoples's Leasing & Finance PLC/Mr R H Abeygoonewardena & Mrs V F Abeygoonewardena | 37,850 |
| 7. | Mr D A De Silva | – |
| 8. | Dr A Dharmasiri | – |
| 9. | Mr S P P Amaratunge | – |
| 10. | Mr J R A Corera | 10,335 |
| 11. | Mr J P Abhayaratne | – |
| 12. | Mr E Karthik | – |
| 13. | Mrs P R W Perera | – |
| 14. | Mr S Kumarapperuma | – |
| 15. | Mr E R S G S Hemachandra | – |
| 16. | Mrs P N Gamage | – |
| 147,894 |
Directors’ interest in debentures
Following Director has subscribed for company debentures as indicated below as at 31 March 2021.
Mr R H Abeygoonewardana Rs. 4 Mn. (31 March 2019 – Rs. 4 Mn.) Except for above there were no debentures registered in the name of other directors as at 31 March 2021.
Rights issue 2019/20
Rights issue of 11,574,805 new ordinary voting shares each issued at Rs. 77/- per share and 2,001,496 new ordinary non-voting shares each issued at Rs. 64/- per share
In the financial year 2019/20, Company issued a right issue one new (1) Ordinary Voting Share each for every four (4) Ordinary Voting Shares held by the shareholders by Issue of 11,574,805 new Ordinary Voting Shares, at a price of Rs. 77/- per share . Further one new (1) Ordinary Non-voting Share each for every four (4) Ordinary Non-voting Shares held by the shareholders by Issue of 2,001,496 new Ordinary Non-voting Shares, at a price of Rs. 64/- per share. Company raised total of Rs. 1,019,355,729. CSE granted the principal approval for the proposed Rights Issue on 30 April 2019. The ordinary resolution pertaining to the Right Issue was passed at the Extraordinary General Meeting held on 28 May 2019. Accordingly XR date and last date of payment and acceptance was 29 May 2019 and 19 June 2019 respectively where right issue was oversubscribed. The main objectives of the proposed Rights issue was to strengthen the Tier 1 capital while supporting to the company’s asset growth.
Right issue movement
| Share type | Total number of Issued shares prior right issue | Basis | Share type | Number of shares issues | New capital raised Rs. |
| Voting Share | 46,299,223 | 1 for every 4 voting shares | Voting shares at Rs. 77.00 | 11,574,805 | 891,259,985 |
| Non-Voting Share | 8,005,984 | 1 for every 4 voting shares | Non-Voting shares at Rs. 64.00 | 2,001,494 | 128,095,744 |
Information on listed debentures movement
| Opening balance as at 01.04.2019 (Rs.) |
During the year issue | During the year maturity | Closing balance as at 31.03.2020 (Rs.) |
||||||
| Type | Rate | Value | Total value | Type | Rate | Value | Total value | ||
| 3,927,000,000 | A (Semi Annual) | 13.43% | 387,900,000 | 1,075,200,000 | 5,002,970,000 | ||||
| B (Annual) | 13.88% | 687,300,3000 | |||||||
| Opening balance as at 01.04.2020
(Rs.) |
During the year issue | During the year Maturity | Closing balance as at 31.03.2021
(Rs.) |
||||||
| Type | Rate | Value | Total Value | Type | Rate | Value | Total value | ||
| 5,002,970,000 | A (Semi Annual) | - | - | - | A | - | - | - | 5,002,970,000 |
| B Annual) | - | - | B | - | - | ||||
Information on listed debentures
Debentures issue June 2016 - June 2021
| Listing | Debenture description | Type | Interest payment frequency | Tenor (years) | Interest rate | Comparable Government Security Yield (%) | ||
| Issued quantity as at 31.03.2021 | Coupon Rate (per annum) (%) | Annual Effective Rate (%) | ||||||
| Listed Debenture (Rs. 100) |
Rated Subordinated Guaranteed Redeemable Debenture | A | Semi-annually | 5 | 9,983,700 | 12.75 | 13.16 | 7.14 |
| B | Semi-annually | 5 | 16,300 | 6 Months Net T.Bill rate (net of tax plus 1.5%)** | 7.14 | |||
Debenture Issue March 2018 – March 2023
| Listing | Debenture Description | Type | Interest payment frequency | Tenor (years) | Interest Rate | Comparable Government Security Yield (%) | ||
| Issued quantity as at 31.03.2021 | Coupon Rate (Per Annum) (%) | Annual Effective Rate (%) | ||||||
| Listed Debenture (Rs. 100) | Rated Subordinated | A | Semi-annually | 5 | 10,669,900 | 13.75 | 14.22 | 7.14 |
| Listed Unsecured | B | Annually | 5 | 9,330,100 | 14.20 | 14.20 | 7.14 | |
| Redeemable Debenture | ||||||||
Debentures Issue January 2019 – January 2024
| Listing | Debenture Description | Type | Interest payment frequency | Tenor (years) | Interest Rate | Comparable Government Security Yield (%) | ||
| Issued quantity as at 31.03.2021 | Coupon Rate (Per Annum) (%) | Annual Effective Rate (%) | ||||||
| Listed Debenture (Rs. 100) |
Rated Subordinated | A | Semi-annually | 5 | 2,591,800 | 15.00 | 15.56 | 7.14 |
| Listed Unsecured | B | Annually | 5 | 6,685,900 | 15.50 | 15.50 | 7.14 | |
| Redeemable Debenture | ||||||||
Debentures Issue December 2019 -December 2024
| Listing | Debenture Description | Type | Interest payment frequency | Tenor (years) | Interest Rate | Comparable Government Security Yield (%) | ||
| Issued quantity as at 31.03.2021 | Coupon Rate (Per Annum) (%) | Annual Effective Rate | ||||||
| Listed Debenture (Rs. 100) | Rated Subordinated | A | Semi-annually | 5 | 3,879,000 | 13.43 | 13.88 | 7.14 |
| Listed Unsecured | B | Annually | 5 | 6,873,000 | 13.88 | 13.88 | 7.14 | |
| Redeemable Debenture | ||||||||
Market prices for the year ended 31 March 2021
Price, current yield and yield to maturity
Guaranteed listed rated unsecured redeemable debentures June 2016 – June 2021
| Debenture type | Highest price
Rs. |
Lowest price
Rs. |
Last traded
Rs. |
Current yield
(%) |
Yield to maturity
(%) |
| Type A | 102.60 | 100.61 | 101.50 | 12.74 | 9.92 |
| Type B | – | Not traded | – | – | – |
“During the
financial year,
prices of ordinary
voting and
ordinary nonvoting
shares of
CDB generated
a capital
appreciation of
133% and 160%
respectively.”
22%
increase in Net asset value per share to Rs. 201.34
Subordinated listed rated unsecured redeemable debentures March 2018 – March 2023
| Debenture type | Highest price
Rs. |
Lowest price
Rs. |
Last traded
Rs. |
Current yield
(%) |
Yield to maturity
(%) |
| Type A | – | – | Not traded | – | – |
| Type B | 103.00 | 103.00 | 103.00 | 14.51 | 15.13 |
Subordinated listed rated unsecured redeemable debentures January 2019 – January 2024
| Debenture type | Highest price
Rs. |
Lowest price
Rs. |
Last traded
Rs. |
Current yield
(%) |
Yield to maturity
(%) |
| Type A | 108.00 | 108.00 | 108.00 | 14.77 | 17.64 |
| Type B | 100.00 | 100.00 | 100.00 | 16.22 | 17.09 |
Subordinated listed rated unsecured redeemable debentures December 2019 – December 2024
| Debenture type | Highest price
Rs. |
Lowest price
Rs. |
Last traded
Rs. |
Current yield
(%) |
Yield to maturity
(%) |
| Type A | 100.00 | 100.00 | 100.00 | 19.00 | 13.79 |
| Type B | – | – | Not traded | – | – |
Utilisation of funds via capital market from the rights issue
| Objective as per prospectus |
Amount allocated as per prospectus in Rs. | Proposed date of utilisation as per prospectus | Amount allocated from proceeds in Rs. (A) | Total
proceeds % |
Amount utilised in Rs. (B) | Utilisation against Allocation (B/A) % |
| To strengthen the Tier 1 capital of the Company in the light of the regulatory requirements introduced by the Central bank of Sri Lanka | 1,019,355,729 | Within the next 12 months from the date of allotment | 1,019,355,729 | 100 | 1,019,355,729 | 100 |
| Company’s Achievement of the Capital Adequacy Ratio (CAR) under the Finance Business Act Direction No.3 of 2018 | ||||||
| Support the Company’s Asset Growth |
Disclosure on utilisation of funds via capital market during 1 January 2015 – 30 March 2016
Debenture Issue June 2016
| Objective number | Objective as per prospectus | Amount allocated as per prospectus in Rs. | Proposed date of utilisation as per prospectus | Amount allocated from proceeds in Rs. (A) | % of total proceeds | Amounts utilised in Rs. (B) | % of utilization against allocation (B/A) | Clarification if not fully utilised including where the funds are invested (eg: whether lent to related party/s etc.) |
| 1 | Expanding the leasing portfolio | Rs. 1 Bn. | Within the 06 months from date of cash receipt | Rs. 1 Bn. | 100 | Rs. 1 Bn. | 100 | N/A |
| 2 | Improving the Capital Adequacy of the Company’s Balance Sheet, by strengthening its Tier II Capital | With effect from the closure of issue | ||||||
| 3 | Reducing the mismatch of maturity periods between assets and liabilities | Within 12 months from date of cash receipt |
Debenture Issue March 2018
| Objective number | Objective as per prospectus | Amount allocated as per prospectus in Rs.. | Proposed date of utilisation as per prospectus | Amount allocated from proceeds in Rs. (A) | % of total proceeds | Amounts utilised in Rs. (B) | % of utilization against allocation (B/A) | Clarification if not fully utilised including where the funds are invested (eg: whether lent to related party/s etc.) |
| 1 | Supporting the general business growth opportunities of the Company | Rs. 2 Bn. | Within the 06 months from date of cash receipt | Rs. 2 Bn. | 100 | Rs. 2 Bn. | 100 | N/A |
| 2 | Improving the Capital Adequacy of the Company’s Balance Sheet, by strengthening its Tier II Capital | With effect from the closure of issue | ||||||
| 3 | Reducing the mismatch of maturity periods between assets and liabilities | Within 12 months from date of cash receipt |
Debenture Issue January 2019
| Objective number | Objective as per prospectus | Amount allocated as per prospectus in Rs.. | Proposed date of utilisation as per prospectus | Amount allocated from proceeds in Rs. (A) | % of total proceeds | Amounts utilised in Rs. (B) | % of utilization against allocation (B/A) | Clarification if not fully utilised including where the funds are invested (eg: whether lent to related party/s etc.) |
| 1 | Supporting the general business growth opportunities of the Company | Rs. 927,770,000 | Within the 06 months from date of cash receipt | Rs. 927,770,000 | 100 | Rs. 927,770,000 | 100 | N/A |
| 2 | Improving the Capital Adequacy of the Company’s Balance Sheet, by strengthening its Tier II Capital | With effect from the closure of issue | ||||||
| 3 | Reducing the mismatch of maturity periods between assets and liabilities | Within 12 months from date of cash receipt |
Debenture Issue December 2019
| Objective number | Objective as per prospectus | Amount allocated as per prospectus in Rs. | Proposed date of utilisation as per prospectus | Amount allocated from proceeds in Rs. (A) | % of total proceeds | Amounts utilised in Rs. (B) | % of utilization against allocation (B/A) | Clarification if not fully utilised including where the funds are invested (eg: whether lent to related party/s etc.) |
| 1 | Supporting the general business growth opportunities of the Company | Rs. 1,075,200,000 | Within the 06 months from date of cash receipt | Rs. 1,075,200,000 | Rs. 1,075,200,000 | N/A | 100 | N/A |
| 2 | Improving the Capital Adequacy of the Company’s Balance Sheet, by strengthening its Tier II Capital | With effect from the closure of issue | ||||||
| 3 | Reducing the mismatch of maturity periods between assets and liabilities | Within 12 months from date of cash receipt |
Credit rating
ICRA Lanka Limited has assigned a credit rating of (SL) ‘BBB’+ (negative) outstanding long and short-term corporate credit ratings of the Company. Credit ratings obtained for listed, unsecured, debentures are as follows:
| Instrument | Rated amount (Rs. Mn.) | Rating action |
| Issuer rating | N/A | [SL]BBB+ (Negative); Outstanding |
| Subordinated, unsecured, listed redeemable debentures programme | 928 | [SL]BBB (Negative); Outstanding |
| Subordinated unsecured listed redeemable debentures | 1,075 | [SL]BBB (Negative); Outstanding |
| Subordinated, unsecured, listed redeemable debentures programme | 2,000 | [SL]BBB (Negative); Outstanding |
| Subordinated guaranteed listed redeemable debentures | 1,000 | [SL]A-(SO) (Stable); Outstanding |
Report on compliance with the rules on the content of the Annual Report according to section 7.6 of the Listing Rules of the Colombo Stock Exchange (Listing rules)
Colombo Stock Exchange (CSE) Listing Rules aim to boost the confidence of investors by requiring companies to publish accurate information on a timely basis to help investors to evaluate companies and make wise decisions on investing. These rules also depict governance rules, which should be adhered to by all listed companies. Level of compliance by CDB with such rules is highlighted in the following table:
| Rule no. | Disclosure Requirement | Section Reference | Page Reference |
| 7.6 (i) | Name of persons who held the positions of Directors during the financial year | 95 | |
| 7.6 (ii) | Principal activities of the Entity and its Subsidiaries during the year and any changes therein | Notes to the Financial Statements- Reporting Entity | 144 - 248 |
| 7.6 (iii) | The names and the number of shares held by the 20 largest holders of voting and non-voting shares and the percentages of such shares held | 3.7 Investors | 74 - 84 |
| 7.6 (iv) | The public holding percentage | 3.7 Investors | 74 - 84 |
| 7.6 (v) | A statement of each Director’s and Chief Executive Officer’s shareholding and the percentage of such shares held | 3.7 Investors | 80 |
| 7.6 (vi) | Information pertaining to material foreseeable risk factors of the Entity | Risk Management | 85 - 90 |
| 7.6 (vii) | Details of material issues pertaining to employees and industrial relations of the Entity | N/A | N/A |
| 7.6 (viii) | Extent, locations, valuations, and the number of buildings of the Entity’s land holdings and investment properties | Notes to the Financial Statements | 144 - 248 |
| 7.6 (ix) | Number of shares representing the Entity’s stated capital | 3.7 Investors | 74 - 84 |
| 7.6 (x) | A distribution schedule of the number of holders in each class of equity securities and the percentage of their total holdings | 3.7 Investors | 74 - 84 |
| 7.6 (xi) | Ratios and market price information: Equity Debt Any changes in credit rating | 3.7 Investors | 74 - 84 |
| 7.6 (xii) | Significant changes in the Entity’s or its subsidiaries’ fixed assets and the market value of land, if the value differs substantially from the book value | Notes to the Financial Statements | 144 - 248 |
| 7.6 (xiii) | Details of funds raised through Public Issues, Rights and Private Placements during the year | 3.7 Investors | 74 - 84 |
| 7.6 (xiv) | Information in respect of Employee Share Option Schemes and Employee Share Purchase Schemes | 3.7 Investors | 74 - 84 |
| 7.6 (xv) | Disclosure pertaining to Corporate Governance Practices in terms of Rules 7.10.3, 7.10.5 c and 7.10.6 c of Section 7 of the Rules |
3.7 Investors | 83 - 84 |
| 7.6 (xvi) | Disclosure on Related Party Transaction exceeding 10% of the equity or 5% of the total assets whichever is lower, of the Entity as per the latest Audited Financial Statements. | Refer Notes to the Financial Statements in relation to Related Party Transactions. Further, refer page 84 for compliance with section 09. | 144 - 248 |
Compliance Requirements on Corporate Governance Rule 7.10 of the Listing Rules
The Continuing Listing Rule Section 7.10 of the Colombo Stock Exchange (CSE) mandates companies listed on the Colombo Stock Exchange to publish a table in the Annual Report, confirming that as at the date of the Annual Report, they comply with the Corporate Governance rules. The rule addresses the following areas:
A. Non-Executive Directors,
B. Independent Directors,
C. Disclosures relating to Directors,
D. Remuneration Committee,
E. Audit Committee.
| Rule Reference | Requirement | Compliance Status | Details |
| 7.10.1 (a) | Two or one third of the Directors, whichever is higher, should be Non-Executive Directors | Compliant | For the FY 2020/21, seven of the thirteen Directors were Non-Executives (NED), which is more than the requirement of the rule. |
| 7.10.2 (a) | Two or one third of Non-Executive Directors, whichever is higher, should be independent | Compliant | For the FY 2020/21 four out of seven Non-Executive Directors are Independent. |
| 7.10.2 (b) | Each Non-Executive Director should submit a declaration of independence/non-independence in the prescribed format | Compliant | All Non-Executive Directors submitted the requisite declarations during the year under review. |
| 7.10.3 (a) | Names of Independent Directors should be disclosed in the Annual Report | Compliant | Please refer Corporate Governance section on pages 91 to 105. |
| 7.10.3 (b) | In the event a Director does not qualify as independent as per the rules on corporate governance but if the Board is of the opinion that the Director is nevertheless independent, it shall specify the basis of the determination in the Annual Report | N/A | No such determination was required to be made by the Board, as all the Independent Directors of the Company met the specified criteria. |
| 7.10.3 (c) | A brief resume of each Director should be published in the Annual Report including the areas of expertise | Compliant | Please refer pages108 to 109 for Directors profiles. |
| 7.10.3 (d) | A brief resume of any new Director appointed to the Board should be provided to the Exchange for dissemination to the public | Compliant | During this financial year 2020/21, one Executive Director, two Independent Non-Executive Directors and two Non-Executive Directors were appointed to the Board. Please refer page 100. |
| 7.10.5 | A listed company shall have a Remuneration Committee | Compliant | Refer the Remuneration Committee Report on page 120 for disclosure on the names of the Remuneration Committee Members and the Remuneration Policy of the Company. |
| 7.10.5 (a) | The Remuneration Committee shall comprise a minimum of two Independent Non-Executive Directors or a majority of Independent Non-Executive Directors, whichever is higher | Compliant | Refer the Remuneration Committee Report on page 120 for disclosure on the names of the Remuneration Committee members |
| 7.10.5 (b) | Functions of the Remuneration Committee shall be to recommend the remuneration of the Chief Executive Officer and the Executive Directors | Compliant | Refer the Remuneration Committee Report on page 120 for disclosure on the names of the Remuneration Committee Members and the Remuneration Policy of the Company. |
| 7.10.5 (c) | The Annual Report shall set out: | ||
| (i) The names of the Directors that comprise the Remuneration Committee | Compliant | Refer the Remuneration Committee Report on page 120 for disclosure on the names of the Remuneration Committee Members | |
| (ii) A statement of Remuneration Policy | Compliant | Refer the Remuneration Committee Report on page 120 for disclosure on the names of the Remuneration Committee Members and the Remuneration Policy of the Company. | |
| (iii) Aggregate remuneration paid to Executive and Non-Executive Directors | Compliant | Please refer pages 212 - 215 on Key Management Personnel (KMP) compensation. | |
| 7.10.6 | A listed company shall have an Audit Committee | Compliant | Refer Board Audit Committee Report on pages 115 to 117. |
| 7.10.6 (a) | The Audit Committee shall comprise a minimum of two Independent Non-Executive Directors, or a majority of Independent Non-Executive Directors, whichever is higher | Compliant | The Audit Committee comprised three Non-Executive Directors and out of those three, two Directors are Independent. Please refer page 115. |
| The Chief Executive Officer and Chief Financial Officer shall attend Audit Committee meetings | Compliant | Both the Chief Executive Officer and the Chief Financial Officer attended the Audit Committee meetings by invitation. | |
| The Chairman or one member of the Committee should be a member of a recognised professional accounting body | Compliant | The Chairperson of the Committee is a Fellow Member of The Institute of Chartered Accountants of Sri Lanka. | |
| 7.10.6 (b) | The functions of the Audit Committee shall be as set out in Section 7.10 of the Listing Rules. | Compliant | Refer Board Audit Committee Report on pages 115 to 117. |
| 7.10.6 (c) | The Annual Report shall set out; | ||
| The names of the Directors who comprise the Audit Committee | Compliant | Refer Board Audit Committee Report on pages 115 to 117. | |
| The Audit Committee shall make a determination of the independence of the Auditors and disclose the basis for such determination | Compliant | Refer Board Audit Committee Report on pages 115 to 117. | |
| A report by the Audit Committee setting out the manner of compliance of the functions set out in Section 7.10 of the Listing Rules | Compliant | Refer Board Audit Committee Report on pages 115 to 117. |
“Report on compliance with the rules on the content of the Annual Report in section 9.3.2 of the listing rules of the Colombo Stock Exchange (Related Party Transactions)”
With the compulsory adoption of the Code of Best Practices on Related Party Transactions (RPT) (‘the Code’) issued by the Securities and Exchange Commission of Sri Lanka since January 2016, the Related Party Transactions Review Committee (RPTR) was established with the approval of the Board of Directors of CDB to ensure strict compliance with the rules and regulations governing related party transactions for Listed Entities.
| Rule no. | Disclosure Requirement | Section Reference | Page Reference |
| 9.3.2 (a) | In the case of Non-recurrent Related Party Transactions, if aggregate value of the non-recurrent Related Party Transactions exceeds 10% of the Equity or 5% of the Total Assets, whichever is lower, of the Listed Entity according to the latest Audited Financial Statements. | Related Party Transaction Note in the Financial Statements | 212 - 215 |
| 9.3.2 (b) | In the case of Recurrent Related Party Transactions, if the aggregate value of the Recurrent Related Party Transactions exceeds 10% of the Net revenue/income as per the latest Audited Financial Statements | Related Party Transaction Note in the Financial Statements | 212 - 215 |
| 9.3.2 (c) | Annual Report shall contain a report compiled by the RPTR Committee including followings:
|
BRPT Review Committee Report. | 122 - 123 |