Financial Reports

Notes to the Financial Statements

1.1 Corporate information

DFCC Bank PLC (“the Bank”) is a limited liability public company incorporated and domiciled in Sri Lanka.

The Bank was incorporated in 1955 under DFCC Bank Act No. 35 of 1955 as a limited liability public company. The ordinary shares of the Bank were listed in the Colombo Stock Exchange (CSE).

Consequent to the enactment of the DFCC Bank (Repeal and Consequential Provisions) Act No. 39 of 2014, the DFCC Bank Act No. 35 of 1955 was repealed and the Bank was incorporated under the Companies Act No. 07 of 2007 as a public limited company listed in the Colombo Stock Exchange with the name “DFCC Bank PLC” with effect from 6 January 2015.

DFCC Bank PLC (DFCC) also obtained a commercial banking license from the Monetary Board of the Central Bank of Sri Lanka in terms of the Banking Act No. 30 of 1988, as amended, and accordingly upon the amalgamation with DFCC Vardhana Bank PLC now operates as a licensed commercial bank.

The registered office of the Bank is at No. 73/5, Galle Road, Colombo 3.

Total staff strength of the Group and Bank on 31 December 2020 was as follows:

Group 2,182 (31 December 2019 – 2,192)
Bank 2,072 (31 December 2019 – 2,076)

1.2 Consolidated Financial Statements

DFCC Bank PLC as the parent of subsidiaries under its control is required to present only the consolidated financial statements as per Sri Lanka Accounting Standard – SLFRS 10 on “Consolidated Financial Statements” and the proportionate share of the profit or loss and net assets of its associates and joint ventures in terms of the Sri Lanka Accounting Standard – LKAS 28 on “Investments in Associates and Joint Ventures”. In addition to the consolidated financial statements, separate financial statements are also presented as per the Companies Act No. 07 of 2007 and Banking Act No. 30 of 1988 and amendments thereto.

The Bank’s financial statements comprise the amalgamation of the financial statements of the Domestic Banking Unit (DBU) and the Foreign Currency Banking
Unit (FCBU).

1.3 Parent entity and ultimate parent entity

The Bank does not have an identifiable parent of its own. The Bank is the ultimate parent of the Group companies.

1.4 Principal business activities, nature of operations of the Group and ownership by the Bank in its subsidiaries, associate and joint venture.

A summary of principal activities of DFCC Bank PLC, its subsidiary companies, associate company and joint venture company is as follows:

Entity Principal business activity
DFCC Bank PLC Range of financial services such as accepting deposits, corporate credit and retail banking, personal financial services, project financing, investment banking, foreign currency operations, trade finance and dealing in Government Securities, and Treasury-related products.
Subsidiaries
DFCC Consulting (Pvt) Limited Technical, financial, and other professional consultancy services in Sri Lanka and abroad.
Lanka Industrial Estates Limited Leasing of land and buildings to industrial enterprises.
Synapsys Limited Information technology services and information technology enabled services.
Associate
National Asset Management Limited Management of Unit Trust and private portfolios.
Joint venture
Acuity Partners (Pvt) Limited Investment banking-related financial services.

There were no significant changes in the nature of the principal activities of the Group during the financial year under review.

1.5 Approval of financial statements

The financial statements for the year ended 31 December 2020 were authorised for issue by the Directors on 17 February 2021.

1.6 Responsibility for financial statements

The responsibility of the Board of Directors in relation to the financial statements is set out in the Statement of Directors’ Responsibility report in the Annual Report.

2.1 Statement of compliance

The consolidated financial statements of the Group and the separate financial statements of the Bank, which comprise the Statement of Financial Position, Income Statement, Statement of Profit or Loss and Other Comprehensive Income, Statement of Changes in Equity, Statement of Cash Flows and Notes thereto, have been prepared in accordance with Sri Lanka Accounting Standards (SLFRSs and LKASs) laid down by The Institute of Chartered Accountants of Sri Lanka (CA Sri Lanka) and in compliance with the requirements of the Companies Act No. 07 of 2007 and the Banking Act No. 30 of 1988 and amendments thereto, and provide appropriate disclosures as required by the Listing Rules of the Colombo Stock Exchange (CSE).

These financial statements, except for information on cash flows have been prepared following the accrual basis of accounting.

Details of the Group’s significant accounting policies followed during the year are given on Note 5.

These financial statements include the following components:

  • an Income statement and statement of profit or loss and other comprehensive income providing information on the financial performance of the Group and the Bank for the year under review; (Refer Income Statement and Statement of Profit or Loss and Other Comprehensive Income).
  • a statement of financial position providing information on the financial position of the Group and the Bank as at the year end; (Refer Statement of Financial Position).
  • a statement of changes in equity depicting all changes in shareholders’ funds during the year under review of the Group and the Bank; (Refer Statement of Changes in Equity).
  • a statement of cash flows providing information to the users, on the ability of the Group and the Bank to generate cash and cash equivalents and the needs of the entity to utilise those cash flows; (Refer Statement of Cash Flows).
  • Notes to the financial statements comprising accounting policies and other explanatory information. (Refer Notes to the Financial Statements)

The format used in the preparation and presentation of the financial statement and the disclosures made therein also comply with the specified formats prescribed by the Central Bank of Sri Lanka in the Circular No. 2 of 2019 on “Publication of Annual and Quarterly Financial Statements and Other Disclosures by Licensed Banks”.

2.2 Basis of measurement

These financial statements have been prepared on the historical cost convention except for the following material items, which are measured on an alternative basis on each reporting date:

Financial instruments

Item Basis of measurement Note Page
Financial assets measured at fair value through profit or loss Fair value 30 237
Derivative financial assets and derivative financial liabilities Fair value 29 233
Financial assets measured at fair value through other comprehensive income (FVOCI) Fair value 34 246

Non-financial assets/liabilities

Item Basis of measurement Note Page
Employee retirement benefits Present value of the defined benefit pension obligation less the net total of the pension assets maintained in DFCC Bank Pension Fund, a trust separate from the Bank. 48 270
Present value of the defined benefit gratuity obligation. 48 270

No adjustments have been made for inflationary factors affecting the financial statements.

2.3 Materiality and aggregation

Each item which is similar in nature is presented separately if material. Items of dissimilar nature or function are presented separately unless they are immaterial as permitted by the Sri Lanka Accounting Standard – LKAS 1 on “Presentation of Financial Statements”.

2.4 Going concern

The Directors have made an assessment of the Group’s ability to continue as a going concern and are satisfied that it has the resources to continue in business for the foreseeable future. The assessment took into consideration the existing and potential implications of COVID-19 pandemic on the business operations and performance of the Group and the measures adopted by the Government to mitigate the pandemic’s spread and support recovery of the economy. The Board is not aware of any material uncertainties that may cast significant doubt upon the Group’s ability to continue as a going concern and they do not intend either to liquidate or to cease operations of the Group. Therefore, the financial statements continue to be prepared on the going concern basis.

2.5 Comparative information

Comparative information including quantitative, narrative, and descriptive information is disclosed in respect of the previous period in the financial statements in order to enhance the understanding of the current period’s financial statements and to enhance the inter-period comparability.

The presentation and classification of the financial statements of the previous year are amended, where relevant for better presentation and to be comparable with those of the current year.

These consolidated financial statements are presented in Sri Lankan Rupees (LKR), which is the Bank’s functional currency. All amounts have been rounded to the nearest thousand, except when otherwise indicated.

There was no change in the Group’s presentation and functional currency during the year under review.

In preparing these financial statements, Management has made judgements, estimates and assumptions that affect the application of the Group’s accounting policies and the reported amounts of assets, liabilities, income and expenses. Actual results may differ from these estimates.

Estimates and underlying assumptions are reviewed on an ongoing basis. Revisions to estimates are recognised prospectively.

Coronavirus (COVID-19) pandemic

The COVID-19 pandemic and its effect on the global economy have impacted the customers, operations and Group performance. The outbreak necessitated the government to respond at unprecedented levels to protect the health of the population, local economy and livelihoods. Thus the pandemic has significantly increased the estimation uncertainty in the preparation of these financial statements including, the extent and duration of the disruption to businesses, expected economic downturn, and subsequent recovery.

The significant accounting estimates impacted by these forecasts and associated uncertainties are predominantly related to expected credit losses, fair value measurement, and the assessment of the recoverable amount of non-financial assets. The impact of the COVID-19 pandemic on each of these estimates is discussed further in the relevant notes of these financial statements. Actual results may differ from these estimates. Estimates and underlying assumptions are reviewed on an ongoing basis. Revisions to estimates are recognised prospectively.

4.1 Judgements

Information about judgements made in applying accounting policies that have the most significant effects on the amounts recognised in the financial statements are included in the following Notes:

Item Note Page
Establishing the criteria for determining whether credit risk on the financial asset has increased significantly since initial recognition, determining methodology for incorporating forward-looking information into measurement of Expected Credit Loss (ECL) and selection and approval models used to measure ECL. 17 213
Classification of financial assets: assessment of the business model within which the assets are held and assessment of whether the contractual terms of the financial assets are Solely Payment of Principal and Interest (SPPI) on the principal amount outstanding. 5.3.2 169
Determination of control over investees. 36, 37 252, 253

4.2 Assumptions and estimation uncertainties

Information about assumptions and estimation uncertainties that have a significant risk of resulting in material adjustments to the carrying amounts of assets and liabilities is included in the following Notes:

Item Note Page
Impairment of financial instruments: determining inputs into the ECL measurement model, including incorporation of forward-looking information and key assumptions used in estimating recoverable cash flows. 17, 32 213, 239
Determination of the fair value of financial instruments with significant unobservable inputs. 9.3.1 201
Measurement of defined benefit obligations: key actuarial assumptions. 48.2.2 275
Recognition of deferred tax assets: availability of future taxable profit against which carry-forward tax losses can be utilised. 41 262
Impairment testing for Cash Generating Units (CGU) containing goodwill: key assumptions underlying recoverable amounts. 5.4 172
Item Note Page
Recognition and measurement of contingencies: key assumptions about the likelihood and magnitude of an outflow of resources. 57 283
Fair values of the assets held for sale: determination of fair value less costs to sell on the basis of significant unobservable inputs. 43 265

The significant accounting policies set out below have been applied consistently to all periods presented in the financial statements of the Group.

These accounting policies have been applied consistently by Group entities.

Set out below is an index of the significant accounting polices:

Note Page
A. Basis of consolidation 5.1 167
B. Foreign currency 5.2 168
C. Interest 11 207
D. Fee and commission 12 209
E. Net trading gain/(loss) 13 211
F. Net income from other financial instruments at fair value through
profit or loss
14 211
G. Dividend income 16 212
H. Leases 59 290
I. Income tax 22 224
J. Financial assets and financial liabilities 5.3 169
– Recognition and initial measurement 5.3.1 169
– Classification 5.3.2 169
– Derecognition 5.3.4 170
– Modification of financial assets
and financial liabilities
5.3.5 171
– Offsetting 5.3.6 171
– Fair value measurement 5.3.7 172
– Impairment 5.3.8 172
– Designation at fair value
through profit or loss
5.3.9 172
K. Cash and cash equivalents 26 231
L. Trading assets and liabilities 30 237
Note Page
M. Derivatives held for risk management purposes and hedge accounting 29 233
N. Loans and advances 31,32 238, 239
O. Investment securities 30, 33, 34 237, 245, 246
P. Property, plant and equipment 39 256
Q. Investment property 38 255
R. Intangible assets and goodwill 40 260
S. Impairment of non-financial assets 5.4 172
T. Deposits, debt securities in issue
and subordinated liabilities
45, 47, 51 266, 269, 278
U. Provisions 50 277
V. Financial guarantees and
loan commitments
57 283
W. Employee retirement benefits 48 270
X. Share capital, other equity
and reserves
52-55 279-281
Y. Earnings per share 23 226
Z. Segment reporting 60 293

5.1 Basis of consolidation

5.1.1 Business combinations

The Group accounts for business combinations using the acquisition method when the acquired set of activities and assets meets the definition of a business and control is transferred to the Group.

From 1 January 2020, in determining whether a particular set of activities and assets is a business, the Group assesses whether the set of assets and activities acquired includes, at a minimum, an input and substantive process and whether the acquired set has the ability to produce outputs. The Group has an option to apply a “concentration test” that permits a simplified assessment of whether an acquired set of activities and assets is not a business. The optional concentration test is met if substantially all of the fair value of the gross assets acquired is concentrated in a single identifiable asset or group of similar identifiable assets.

The consideration transferred in the acquisition is generally measured at fair value, as are the identifiable net assets acquired. Any goodwill that arises is tested annually for impairment. Any gain on a bargain purchase is recognised in profit or loss immediately. Transaction costs are expensed as incurred, except if related to the issue of debt or equity securities.

The consideration transferred does not include amounts related to the settlement of pre-existing relationships. Such amounts are generally recognised in income statement.

Any contingent consideration is measured at fair value at the date of acquisition. If an obligation to pay contingent consideration that meets the definition of a financial instrument is classified as equity, then it is not remeasured and settlement is accounted for within equity. Otherwise, other contingent consideration is remeasured at fair value at each reporting date and subsequent changes in the fair value of the contingent consideration are recognised in Income Statement.

5.1.2 Subsidiaries

Details of the Bank’s subsidiaries, how they are accounted for in the financial statements and their contingencies are set out in Note 35.

5.1.3 Non-controlling interests (NCI)

Details of non-controlling interests are given in Note 56.

5.1.4 Loss of control

When the Group looses control over a subsidiary, it derecognises the assets and liabilities of the subsidiary, and any related NCI and other components of equity. Any resulting gain or loss is recognised in profit or loss. Any interest retained in the former subsidiary is measured at fair value when control is lost.

5.1.5 Interests in equity-accounted investees

The Group’s interests in equity-accounted investees comprise interests in an associate and a joint venture.

Details of the Bank’s equity-accounted investees, how they are accounted in the financial statements and their contingencies are set out in Notes 36 and 37.

5.1.6 Transactions eliminated on consolidation

Intra-group balances and transactions, and any unrealised income and expenses (except for foreign currency transaction gains or losses) arising from intra-group transactions, are eliminated.

Unrealised losses are eliminated in the same way as unrealised gains, but only to the extent that there is no evidence of impairment.

5.1.7 Financial statements of subsidiaries, associate company, and joint venture company included in the consolidated financial statements

The financial statements of DFCC Consulting (Pvt) Limited, Acuity Partners (Pvt) Limited, Synapsys Limited and National Asset Management Limited included in the consolidation have financial years ending on 31 December.

Financial statements of Lanka Industrial Estates Limited included in the consolidation has financial year ending on 31 March.

Audited financial statements are used for consolidation of companies which have a similar financial year end, as the Bank and for other a special review is performed.

5.2 Foreign currency

5.2.1 Foreign currency transactions

Transactions in foreign currencies are translated into the respective functional currencies of Group companies at the exchange rates at the date of the transactions.

Monetary assets and liabilities denominated in foreign currencies are translated into the functional currency at the exchange rate at the reporting date. The foreign currency gain or loss on monetary items is the difference between the amortised cost in the functional currency at the beginning of the year, adjusted for effective interest, impairment and payments during the year, and the amortised cost in the foreign currency translated at the spot exchange rate at the end of the year.

Non-monetary assets and liabilities that are measured at fair value in a foreign currency are translated into the functional currency at the exchange rate when the fair value is determined. Non-monetary items that are measured based on historical cost in a foreign currency are translated at the exchange rate at the date of the transaction.

Foreign currency differences arising on translation are generally recognised in profit or loss. However, foreign currency differences arising from the translation of the following items are recognised in other comprehensive income (OCI):

  • equity investments in respect of which an election has been made to present subsequent changes in fair value in OCI;
  • a financial liability designated as a hedge of the net investment in a foreign operation to the extent that the hedge is effective; and
  • qualifying cash flow hedges to the extent that the hedges are effective

5.2.2 Foreign operations

The Bank does not have any foreign operations that is a subsidiary, associate, joint venture, or a branch. Therefore, there is no exchange differences recognised in other comprehensive income.

5.3 Financial assets and financial liabilities

5.3.1 Recognition and initial measurement

The Group initially recognises loans and advances, deposits, debt securities issued and subordinated liabilities on the date on which they are originated. All other financial instruments (including regular-way purchases and sales of financial assets) are recognised on the trade date, which is the date on which the Group becomes a party to the contractual provisions of the instrument.

A financial asset or financial liability is measured initially at fair value plus, for an item not at fair value through profit or loss (FVTPL), transaction costs that are directly attributable to its acquisition or issue. The fair value of a financial instrument at initial recognition is generally its transaction price.

5.3.2 Classification

5.3.2.1 Financial assets

On initial recognition, a financial asset is classified as measured at: amortised cost, FVOCI or FVTPL.

A financial asset is measured at amortised cost if it meets both of the following conditions and is not designated as at FVTPL:

  • the asset is held within a business model whose objective is to hold assets to collect contractual cash flows; and
  • the contractual terms of the financial asset give rise on specified dates to cash flows that are SPPI.

A debt instrument is measured at FVOCI only if it meets both of the following conditions and is not designated
as at FVTPL:

  • the asset is held within a business model whose objective is achieved by both collecting contractual cash flows and selling financial assets; and
  • the contractual terms of the financial asset give rise on specified dates to cash flows that are SPPI.

On initial recognition of an equity investment that is not held for trading, the Group may irrevocably elect to present subsequent changes in fair value in OCI. This election is made on an investment-by-investment basis.

All other financial assets are classified as measured at FVTPL.

In addition, on initial recognition, the Group may irrevocably designate a financial asset that otherwise meets the requirements to be measured at amortised cost or at FVOCI as at FVTPL if doing so eliminates or significantly reduces an accounting mismatch that would otherwise arise.

5.3.2.1.1 Business model assessment

The Group makes an assessment of the objective of a business model in which an asset is held at a portfolio level because this best reflects the way the business is managed and information is provided to Management. The information considered includes:

  • the stated policies and objectives for the portfolio and the operation of those policies in practice. In particular, whether Management’s strategy focuses on earning contractual interest revenue, maintaining a particular interest rate profile, matching the duration of the financial assets to the duration of the liabilities that are funding those assets or realising cash flows through the sale of the assets;
  • how the performance of the portfolio is evaluated and reported to the Group’s Management;
  • the risks that affect the performance of the business model (and the financial assets held within that business model) and its strategy for how those risks are managed;
  • how managers of the business are compensated (e.g. whether compensation is based on the fair value of the assets managed or the contractual cash flows collected); and
  • the frequency, volume and timing of sales in prior periods, the reasons for such sales and its expectations about future sales activity. However, information about sales activity is not considered in isolation, but as part of an overall assessment of how the Group’s stated objective for managing the financial assets is achieved and how cash flows are realised.

The Bank’s retail, small and medium enterprises and corporate banking business comprises primarily loans to customers that are held for collecting contractual cash flows. In the retail business the loans comprise mortgages, overdrafts, unsecured personal lending, and credit card facilities. Sales of loans from these portfolios are very rare.

Certain debt securities are held by the Group Central Treasury in a separate portfolio for long-term yield. These securities may be sold, but such sales are not expected to be more than infrequent. The Group considers that these securities are held within a business model whose objective is to hold assets to collect the contractual cash flows.

Certain other debt securities are held by the Group Central Treasury in separate portfolios to meet everyday liquidity needs. The Group’s Central Treasury seeks to minimise the costs of managing these liquidity needs and therefore actively manages the return on the portfolio. That return consists of collecting contractual cash flows as well as gains and losses from the sale of financial assets. The investment strategy often results in sales activity that is significant in value. The Group considers that these financial assets are held within a business model whose objective is achieved by both collecting contractual cash flows and selling financial assets.

Financial assets that are held for trading or managed and whose performance is evaluated on a fair value basis are measured at FVTPL because they are neither held to collect contractual cash flows nor held both to collect contractual cash flows and to sell financial assets.

5.3.2.1.2 Assessment of whether contractual cash flows are solely payments of principal and interest

For the purposes of this assessment,“principal” is defined as the fair value of the financial asset on initial recognition. “Interest” is defined as consideration for the time value of money and for the credit risk associated with the principal amount outstanding during a particular period of time and for other basic lending risks and costs (e.g. liquidity risk and administrative costs), as well as profit margin.

In assessing whether the contractual cash flows are SPPI, the Group considers the contractual terms of the instrument. This includes assessing whether the financial asset contains a contractual term that could change the timing or amount of contractual cash flows such that it would not meet this condition. In making the assessment, the Group considers:

  • contingent events that would change the amount and timing of cash flows;
  • leverage features;
  • prepayment and extension terms;
  • terms that limit the Group’s claim to cash flows from specified assets; and
  • features that modify consideration of the time value of money.

Equity instruments have contractual cash flows that do not meet the SPPI criterion. Accordingly, all such financial assets are measured at FVTPL unless the FVOCI option is selected.

5.3.2.2 Financial liabilities

On initial recognition, the Group classifies financial liabilities, other than financial guarantees and loan commitments, into one of the following categories:

  • Financial liabilities at amortised cost; and
  • Financial liabilities at fair value through profit or loss
5.3.2.2.1 Financial liabilities at amortised cost

Financial liabilities issued by the Group that are not designated at fair value through profit or loss are recognised initially at fair value plus any directly attributable transaction costs, by taking into account any discount or premium on acquisition and fees or costs that are an integral part of the EIR. Subsequent to initial recognition these financial liabilities are measured at amortised cost using the effective interest method. Deposit liabilities including savings deposits, current deposits, fixed/time deposits, call deposits, certificates of deposit and debentures are classified as financial liabilities measured at amortised cost.

The EIR amortisation is included in “Interest expense” in the income statement. Gains and losses too are recognised in the income statement when the liabilities are derecognised as well as through the EIR amortisation process.

5.3.2.2.2 Financial liabilities at fair value through profit or loss

Financial liabilities at fair value through profit or loss include derivative liabilities held for risk management purposes.

5.3.3 Reclassifications

Financial assets are not reclassified subsequent to their initial recognition, except in the period after the Group changes its business model for managing financial assets. Financial liabilities are not reclassified as such reclassifications are not permitted by SLFRS 9.

5.3.4 Derecognition

5.3.4.1 Financial assets

The Group derecognises a financial asset when the contractual rights to the cash flows from the financial asset expire, or it transfers the rights to receive the contractual cash flows in a transaction in which substantially all of the risks and rewards of ownership of the financial asset are transferred or in which the Group neither transfers nor retains substantially all of the risks and rewards of ownership and it does not retain control of the financial asset.

On derecognition of a financial asset, the difference between the carrying amount of the asset (or the carrying amount allocated to the portion of the asset derecognised) and the sum of (i) the consideration received (including any new asset obtained less any new liability assumed) and (ii) any cumulative gain or loss that had been recognised in OCI is recognised in profit or loss. Any cumulative gain/loss recognised in OCI in respect of equity investment securities designated as at FVOCI is not recognised in profit or loss on derecognition of such securities.

Any interest in transferred financial assets that qualify for derecognition that is created or retained by the Group is recognised as a separate asset or liability.

5.3.4.2 Financial liabilities

The Group derecognises a financial liability when its contractual obligations are discharged or cancelled, or expire.

5.3.5 Modifications of financial assets and financial liabilities

5.3.5.1 Financial assets

If the terms of a financial asset are modified, then the Group evaluates whether the cash flows of the modified asset are substantially different.

If the cash flows are substantially different, then the contractual rights to cash flows from the original financial assets are deemed to have expired. In this case, the original financial asset is derecognised and a new financial asset is recognised at fair value plus any eligible transaction costs. Any fees received as part of the modification are accounted for as follows:

  • fees that are considered in determining the fair value of the new asset and fees that represent reimbursement of eligible transaction costs are included in the initial measurement of the asset; and
  • other fees are included in profit or loss as part of the gain or loss on derecognition.

If cash flows are modified when the borrower is in financial difficulties, then the objective of the modification is usually to maximise recovery of the original contractual terms rather than to originate a new asset with substantially different terms. If the Group plans to modify a financial asset in a way that would result in forgiveness of cash flows, then it first considers whether a portion of the asset should be written off before the modification takes place. This approach impacts the result of the quantitative evaluation and means that the derecognition criteria are not usually met in such cases.

If the modification of a financial asset measured at amortised cost or FVOCI does not result in derecognition of the financial asset, then the Group first recalculates the gross carrying amount of the financial asset using the original effective interest rate of the asset and recognises the resulting adjustment as a modification gain or loss in profit or loss. For floating-rate financial assets, the original effective interest rate used to calculate the modification gain or loss is adjusted to reflect current market terms at the time of the modification. Any costs or fees incurred and modification fees received adjust the gross carrying amount of the modified financial asset and are amortised over the remaining term of the modified financial assets.

If such a modification is carried out because of financial difficulties of the borrower, then the gain or loss is presented together with impairment losses. In other cases, it is presented as interest income calculated using the effective interest rate method.

5.3.5.2 Financial liabilities

The Group derecognises a financial liability when its terms are modified and the cash flows of the modified liability are substantially different. In this case, a new financial liability based on the modified terms is recognised at fair value. The difference between the carrying amount of the financial liability derecognised and the consideration paid is recognised in profit or loss. Consideration paid includes non-financial assets transferred, if any, and the assumption of liabilities, including the new modified financial liability.

If the modification of a financial liability is not accounted for as derecognition, then the amortised cost of the liability is recalculated by discounting the modified cash flows at the original effective interest rate and the resulting gain or loss is recognised in profit or loss. For floating-rate financial liabilities, the original effective interest rate used to calculate the modification gain or loss is adjusted to reflect current market terms at the time of the modification. Any costs and fees incurred are recognised as an adjustment to the carrying amount of the liability and amortised over the remaining term of the modified financial liability by re-computing the effective interest rate on the instrument.

5.3.6 Offsetting

Financial assets and financial liabilities are offset and the net amount reported in the Statement of Financial Position, only when there is a legally enforceable right to offset the recognised amounts and there is an intention to settle on a net basis or to realise the assets and settle the liabilities simultaneously. Income and expenses are not offset in the Income Statement, unless required or permitted by an Accounting Standard or Interpretation (issued by the SLFRS Interpretations Committee and Standard Interpretations Committee) and as specifically disclosed in the significant accounting policies of the Bank/Group.

5.3.7 Fair value measurement

“Fair value” is the price that would be received to sell an asset or paid to transfer a liability in an orderly transaction between market participants at the measurement date in the principal or, in its absence, the most advantageous market to which the Group has access at that date. The fair value of a liability reflects its non-performance risk.

When available, the Group measures the fair value of an instrument using the quoted price in an active market for that instrument. A market is regarded as “active” if transactions for the asset or liability take place with sufficient frequency and volume to provide pricing information on an ongoing basis.

If there is no quoted price in an active market, then the Group uses valuation techniques that maximise the use of relevant observable inputs and minimise the use of unobservable inputs. The chosen valuation technique incorporates all of the factors that market participants would take into account in pricing a transaction.

The best evidence of the fair value of a financial instrument on initial recognition is normally the transaction price – i.e. the fair value of the consideration given or received. If the Group determines that the fair value on initial recognition differs from the transaction price and the fair value is evidenced neither by a quoted price in an active market for an identical asset or liability nor based on a valuation technique for which any unobservable inputs are judged to be insignificant in based on a valuation technique for which any unobservable inputs are judged to be insignificant in relation to the difference, then the financial instrument is initially measured at fair value, adjusted to defer the difference between the fair value on initial recognition and the transaction price.

Subsequently, that difference is recognised in profit or loss on an appropriate basis over the life of the instrument but no later than when the valuation is wholly supported by observable market data or the transaction is closed out.

If an asset or a liability measured at fair value has a bid price and an ask price, then the Group measures assets and long positions at a bid price and liabilities and short positions at an ask price.

Portfolios of financial assets and financial liabilities that are exposed to market risk and credit risk that are managed by the Group on the basis of the net exposure to either market or credit risk are measured on the basis of a price that would be received to sell a net long position (or paid to transfer a net short position) for the particular risk exposure. Portfolio-level adjustments are allocated to the individual assets and liabilities on the basis of the relative risk adjustment of each of the individual instruments in
the portfolio.

The fair value of a financial liability with a demand feature (e.g. a demand deposit) is not less than the amount payable on demand, discounted from the first date on which the amount could be required to be paid.

The Group recognises transfers between levels of the fair value hierarchy as of the end of the reporting period during which the change has occurred.

5.3.8 Impairment

Details of impairment is given in Note 17.

5.3.9 Designation at fair value through profit or loss

On initial recognition, the Group may irrevocably designate a financial asset that otherwise meets the requirements to be measured at amortised cost or at FVOCI or at FVTPL, if doing so eliminated or significantly reduces an accounting mismatch that would otherwise arise.

The Group has not designated any financial asset upon initial recognition at fair value through profit or loss as at the reporting date.

5.4 Impairment of non-financial assets

At each reporting date, the Group reviews the carrying amounts of its non-financial assets (other than investment properties and deferred tax assets) to determine whether there is any indication of impairment. If any such indication exists, then the asset’s recoverable amount is estimated.

Goodwill is tested annually for impairment.

For impairment testing, assets are grouped together into the smallest group of assets that generates cash inflows from continuing use that is largely independent of the cash inflows of other assets or CGUs. Goodwill arising from a business combination is allocated to CGUs or groups of CGUs that are expected to benefit from the synergies
of the combination.

The recoverable amount of an asset or CGU is the greater of its value in use and its fair value less costs to sell. Value in use is based on the estimated future cash flows, discounted to their present value using a pre-tax discount rate that reflects current market assessments of the time value of money and the risks specific to the asset or CGU.

An impairment loss is recognised if the carrying amount
of an asset or CGU exceeds its recoverable amount.

The Group’s corporate assets do not generate separate cash inflows and are used by more than one CGU. Corporate assets are allocated to CGUs on a reasonable and consistent basis and tested for impairment as part
of the testing of the CGUs to which the corporate assets
are allocated.

Impairment losses are recognised in profit or loss. They are allocated first to reduce the carrying amount of any goodwill allocated to the CGU, and then to reduce the carrying amounts of the other assets in the CGU on a pro rata basis.

An impairment loss in respect of goodwill is not reversed. For other assets, an impairment loss is reversed only to the extent that the asset’s carrying amount does not exceed the carrying amount that would have been determined, net of depreciation or amortisation, if no impairment loss had been recognised.

The Group has initially adopted Definition of a Business (Amendments to SLFRS 3) from 1 January 2020. A number of other new standards are also effective from 1 January 2020 that do not have a material effect on the Group’s financial statements.

A. Definition of a business

The Group applied Definition of a Business (Amendments to SLFRS 3) to business combinations whose dates of acquisition are on or after 1 January 2020 in assessing whether it had acquired a business or a group of assets. The amendments do not have a material effect on the Group’s financial statements because the Group has not acquired any subsidiaries during the year.

However, the Group has not made any acquisitions on or after 1 January 2020.

A number of new standards and amendments to standards are effective for annual periods beginning after 1 January 2021 and earlier application is permitted; however, the Group has not early adopted them in preparing these consolidated financial statements.

The following amended standards are not expected to have a significant impact on the Group’s consolidated financial statements/Bank’s separate financial statements.

Accounting standard Summary of requirements Possible impact on financial statements
Amendments to references to conceptual framework in SLFRS Standards The revised framework is more comprehensive than the old one – its aim is to provide the Board with the full set of tools for standard setting. It covers all aspects of standard setting from the objective of financial reporting, to presentation and disclosures. The new conceptual framework is effective for annual periods beginning on or after 1 January 2020. Group is not expecting a significant impact arising from the new conceptual framework.
Interest rate benchmark reforms.(Amendments to SLFRS 9, LKAS 39, and SLFRS 7) Interest rate benchmark reform is a global initiative to replace or reform interbank offered rates (IBORs) that are used to determine interest cash flows on financial instruments such as loans to customers, debt securities and derivatives. Historically IBORs such as USD LIBOR have been determined by panels of banks with a heavy reliance on expert judgement. The objective of the reforms is to replace IBORs with alternative nearly risk-free rates (RFRs) that are based on actual market transactions. The Financial Conduct Authority has stated that it will no longer compel panel banks to submit values for LIBORs after 31 December 2021 and it is expected that these benchmarks will cease to exist thereafter. Consequently, financial contracts referencing these benchmarks with a maturity beyond 2021 may need to be amended to reference the alternative RFR in the applicable currency. There remain many uncertainties associated with the IBOR transition, including the prospective. Group is in the process of assessing the possible impact.
Other new accounting pronouncements The following new and amended standards are also not expected to have a significant impact on the Group’s consolidated financial statements;
– Sri Lanka Accounting Standard – SLFRS 17 “Insurance Contracts” effective from 1 January 2023 – Onerous Contracts – Cost of Fulfilling a Contract (Amendments to LKAS 37). – COVID-19-Related Rent Concessions (Amendment to SLFRS 16). – Property, Plant and Equipment: Proceeds before Intended Use
(Amendments to LKAS 16).

This note presents information about the Bank’s exposure to financial risks and the Bank’s management of capital.

8.1 Introduction and Overview

The Bank has exposure to the following key risks from financial instruments:

  • Credit risk;
  • Liquidity risk;
  • Market risk; and
  • Operational risks

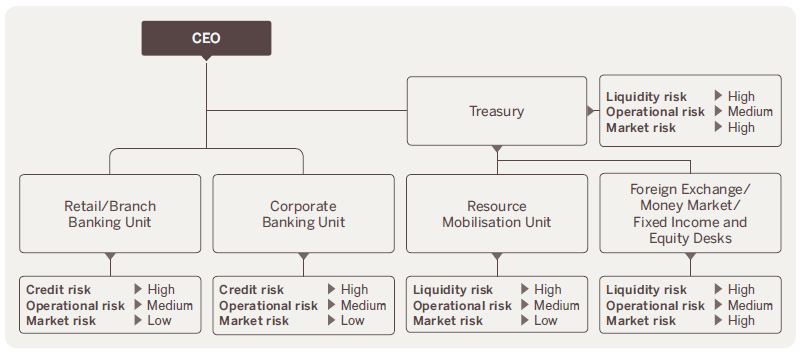
The following chart provides a link between the Bank’s main business units and the principal risks that they are exposed to. The significance of risk is assessed within the context of the Bank as a whole and is measured based on allocation of the regulatory capital within the Bank.

This note presents information about the Bank’s exposure to each of the above risks, the objectives, policies and processes for measuring and managing such risk.

Risk management framework

The Board of Directors has the overall responsibility for the establishment and oversight of the Bank’s risk management framework.

The Board Integrated Risk Management Committee (BIRMC) provides the Board, the assurance that risk management strategies, policies and processes are in place to manage events/outcomes that have the potential to impact significantly on earnings, performance, reputation and capital.

Bank’s risk management policies are established to identify and analyse the risks faced by the Bank, to set appropriate risk limits and controls, and monitor risk and adherence to limits. Risk management policies and systems are reviewed regularly to reflect changes in market conditions and the Bank activities. The Bank through its training and management standards and procedures, aims to develop a disciplined and constructive control environment in which all employees understand their roles and obligations.

Internal Audit undertakes both regular and ad hoc reviews of risk management controls and procedures, the results of which are reported to the Bank Audit Committee.

Page
8.2 Credit risk
8.2.1 Settlement risk 175
8.2.2 Management of credit risk 175
8.2.3 Credit quality analysis 176
8.2.4 Collateral held and other credit enhancements 177
8.2.5 Amounts arising from ECL 179
8.2.6 Concentrations of credit risk 182
8.2.7 Offsetting financial assets and financial liabilities 182
8.3 Liquidity risk
8.3.1 Management of liquidity risk 183
8.3.2 Exposure to liquidity risk 183
8.3.3 Maturity analysis for financial liabilities
and financial assets
184
8.3.4 Liquidity reserves 188
8.3.5 Financial assets available to
support future funding
189
8.4 Market risk
8.4.1 Management of market risk 190
8.4.2 Exposure to market risk – Trading portfolios 191
8.4.3 Exposure to market risk – Non-trading portfolios 192
8.4.4 Interest rate risk 192
8.4.5 Foreign exchange risk 194
8.4.6 Market risk exposure for regulatory capital assessment 195
8.5 Operational risk
8.5.1 Capital Management 195

8.2 Credit risk

Credit risk is the risk of financial loss to the Bank if a customer or counterparty to a financial instrument fails to meet its contractual obligations, and arises principally from Bank’s loans and advances to customers and other banks and investment in debt securities.

8.2.1 Settlement risk

The Bank’s activities may give rise to risk at the time of settlement of transactions and trades. “Settlement risk” is the risk of loss due to the failure of an entity to honour its obligations to deliver cash, securities or other assets as contractually agreed.

8.2.2 Management of credit risk

The Board of Directors, BIRMC and the Credit Committee are responsible for the oversight of credit risk. Management of credit risk includes the following:

  1. Formulating credit policies in consultation with business units covering collateral requirements, credit assessment, risk grading and reporting, documentary and legal procedures and compliance with regulatory and statutory requirements.
  2. Authority for establishing the authorisation structure for the approval and renewal of credit facilities is vested with the Board of Directors. Authorisation limits are allocated to business unit Heads. Approval by Branch Managers, Regional Managers, Head of Branch Banking, Head of Corporate Banking, Credit Committee or the Board of Directors would be required based on loan quantum and risk levels as appropriate.
  3. Reviewing and assessing credit risk: Bank credit assesses all credit exposures in excess of designated limits, before facilities are committed to customers by the business unit concerned. Renewals and reviews of facilities are subject to the same review process.
  4. Limiting concentrations of exposure to counterparties, industries (for loans and advances, financial guarantees and similar exposures), credit ratings and countries.
  5. Developing and maintaining the Bank’s processes for measuring ECL: This includes processes for: – initial approval, regular validation and back-testing of the models used; – determining and monitoring significant increase in credit risk; and – incorporation of forward-looking information.
  6. Reviewing compliance of business units with agreed exposure limits, including those for selected industries, country risk, and product types. Regular reports on the credit quality of local portfolios are provided to bank credit, which may require appropriate corrective action to be taken. These include reports containing estimates of Expected Credit Loss (ECL) allowances.
  7. Providing advice, guidance and specialist skills to business units to promote best practice throughout the Bank in the management of credit risk.

Each business unit is required to follow Bank credit policies and procedures, and each business unit is responsible for the quality and performance of its credit portfolio and for monitoring and controlling all credit risks in its portfolios, including those subject to central approval.

Regular audits of business units and Bank Credit processes are undertaken by Internal Audit.

8.2.3 Credit quality analysis

The following table sets out information about the overdue status of loans and advances to customers in Stages 1, 2 and 3.

Loans to and receivables from customers at amortised cost – gross carrying amount
As at 31 December 2020
In LKR '000 Stage 1 Stage 2 Stage 3 Total
Current 183,303,084 8,446,879 2,200,563 193,950,526
Overdue < 30 days 65,112,665 9,292,992 2,618,816 77,024,473
Overdue > 30 days 2,302,688 24,412,315 19,542,611 46,257,614
Total 250,718,437 42,152,186 24,361,990 317,232,613
As at 31December 2019
In LKR '000 Stage1 Stage2 Stage3 Total
Current 182,849,726 5,014,881 5,427,262 193,291,869
Overdue < 30 days 34,802,427 3,459,297 1,043,267 39,304,991
Overdue > 30 days 6,368,696 28,894,745 17,364,492 52,627,933
Total 224,020,849 37,368,923 23,835,021 285,224,793

8.2.3.1 Gross carrying amount reports under Stage 2 above for the year 2020, include facilities amounting to LKR 5.4 Bn granted to Government Institutions, and are fully-guaranteed by Treasury. Accordingly no provision has been made in respect of these facilities. These facilities were classified under Stage 3 in 2019.

The following table shows an analysis of counterparty credit exposures arising from derivative transactions. Derivative transactions of the Bank are generally fully collateralised by cash. For further discussion of collateral and other credit enhancements:

Derivative type
As at 31 December 2020 Forward SWAP Spot Cross currency SWAP Interest rate SWAP Total
In LKR ’000 Notional
amount
Fair
value
Notional
amount
Fair
value
Notional
amount
Fair
value
Notional
amount
Fair
value
Notional
amount
Fair
value
Notional
amount
Fair
value
Derivative financial assets (Note 1) 8,874,370 30,895 39,541,236 276,665 81,690 27 11,852,637 527,877 60,349,933 835,464
Derivative financial liabilities (Note 2) 8,881,730 (28,002) 39,512,159 (239,805) 81,739 (76) 48,475,628 (267,883)
Note1
Derivative financial assets by counterparty type
With banks 6,128,972 22,862 39,541,236 276,665 81,690 27 11,852,637 527,877 57,604,535 827,431
With other customers 2,745,398 8,033 2,745,398 8,033
Total 8,874,370 30,895 39,541,236 276,665 81,690 27 11,852,637 527,877 60,349,933 835,464
Note2
Derivative financial liabilities by counterparty type
With banks 6,125,797 (17,276) 39,512,159 (239,805) 81,739 (76) 45,719,695 (257,157)
With other customers 2,755,933 (10,726) 2,755,933 (10,726)
Total 8,881,730 (28,002) 39,512,159 (239,805) 81,739 (76) 48,475,628 (267,883)
Derivative Type
As at 31 December 2019 Forward SWAP Spot Cross currency SWAP Interest rate SWAP Total
In LKR’000 Notional
amount
Fair
value
Notional
amount
Fair
value
Notional
amount
Fair
value
Notional
amount
Fair
value
Notional
amount
Fair
value
Notional
amount
Fair
value
Derivative financial assets (Note 1) 1,135,594 8,624 48,887,233 112,011 141,332 143 10,453,667 510,660 60,617,826 631,438
Derivative financial liabilities (Note 2) 1,128,050 (2,448) 49,730,379 (516,127) 141,346 (156) 50,999,775 (518,731)
Note1
Derivative financial assets by counterparty type
With banks 749,746 3,684 48,887,233 112,011 141,332 143 10,453,667 510,660 60,231,978 626,498
With other customers 385,848 4,940 385,848 4,940
Total 1,135,594 8,624 48,887,233 112,011 141,332 143 10,453,667 510,660 60,617,826 631,438
Note2
Derivative financial liabilities by counterparty type
With banks 748,576 (2,448) 49,730,379 (516,127) 141,346 (156) 50,620,301 (518,731)
With other customers 379,474 379,474
Total 1,128,050 (2,448) 49,730,379 (516,127) 141,346 (156) 50,999,775 (518,731)

8.2.4 Collateral held and other credit enhancements

The Bank holds collateral and other credit enhancements against certain of its credit exposures. The following table sets out the principal types of collateral held against different types of financial assets.

Type of credit exposure:

As at 31 December 2020 2019
Gross loan
balance
LKR ’000
Security
value
LKR ’000
Gross loan
balance
LKR ’000
Security
value
LKR ’000
Stage 1
Cash collateral 13,448,486 21,939,627 13,138,299 19,652,804
Property, plant and machinery 88,492,471 234,118,285 78,982,483 198,003,781
Treasury guarantee 4,184,616 8,019,987 3,614,059 7,328,863
Others 85,911,585 12,780,184 75,268,404 8,615,689
Unsecured 39,410,513 34,397,223
Total 231,447,671 276,858,083 205,400,468 233,601,137
As at 31 December 2020 2019
Gross loan
balance
LKR ’000
Security
value
LKR ’000
Gross loan
balance
LKR ’000
Security
value
LKR ’000
Stage 2
Cash collateral 1,186,142 1,453,731 1,360,633 1,702,338
Property, plant and machinery 16,774,823 36,954,269 21,482,134 53,779,650
Treasury guarantee (Note 8.2.3.1) 5,194,358 6,043,468
Others 11,042,254 43,659 10,216,504 1,328,826
Unsecured 3,489,676 2,087,073
Total 37,687,253 44,495,127 35,146,344 56,810,814
Stage 3
Cash collateral 181,950 235,006 76,026 89,403
Property, plant and machinery 10,015,522 14,402,036 7,679,725 17,449,496
Treasury guarantee (Note 8.2.3.1) 4,972,857 6,026,242
Others 6,670,291 21,594 4,313,852 22,272
Unsecured 6,102,588 5,461,571
Total 22,970,351 14,658,636 22,504,031 23,587,413

The above analysis does not include balances relating to lease rentals receivables.

8.2.4.1 Derivatives, reverse sale-and-repurchase agreements and securities borrowing

The Bank mitigates the credit risk of derivatives, reverse sale-and-repurchase agreements and securities lending by entering into master netting agreements and holding collateral in the form of cash and marketable securities.

DFCC requires counterparties to sign an ISDA master agreement (International Swaps and Derivative Association) in order to enter into swaps and other derivative transactions. The agreement outlines the terms and conditions to be applied to the derivative transactions agreed by DFCC and other parties. Any Dispute of the transaction will be handled according to the agreement terms.

The Bank’s sale-and-repurchase, and reverse sale-and-repurchase, transactions and securities borrowing and lending are covered by master agreements. A master agreement has to be signed by both parties to enter such transactions. All terms and conditions are stipulated in the master agreement.

8.2.4.2 Loan to value ratio of residential mortgage lending

The following tables stratify credit exposures by ranges of loan-to-value (LTV) ratio. LTV is calculated as the ratio of the gross amount of the loan to the value of the collateral. The valuation of the collateral excludes any adjustments for obtaining and selling the collateral. The value of the collateral is based on valuations made by independent professional valuers.

BANK/GROUP
As at 31 December 2020
LKR ’000
2019
LKR ’000
LTV ratio
Stage 1
Less than 50% 717,329 2,392,919
51%-70% 1,233,058 3,060,380
71%-90% 2,918,917 1,214,137
More than 90% 4,869,463 1,552,755
Total 9,738,767 8,220,191
Stage 2
Less than 50% 118,112 690,096
51%-70% 199,469 1,206,097
71%-90% 573,666 503,044
More than 90% 836,927 536,146
Total 1,728,174 2,935,383
Stage 3
Less than 50% 69,099 201,965
51%-70% 155,804 342,236
71%-90% 388,553 185,642
More than 90% 410,596 131,916
Total 1,024,052 861,759
Carrying amount – amortised cost 12,490,993 12,017,333
8.2.4.3 Assets obtained by taking possession of collateral

The Bank’s policy is to pursue timely realisation of the collateral in an orderly manner. The Bank does not generally use the non-cash collateral for its own operations.

8.2.5 Amounts arising from ECL

8.2.5.1 Loss allowance

The following tables show reconciliations from the opening to the closing balance of the loss allowance by class of financial instrument. The basis for determining transfers due to changes in credit risk is set out in our accounting policy; see Note 17.

Financial assets at amortised cost – Loans to and receivables from other customers – ECL
2020 2019
Stage 1
LKR ’000
Stage 2
LKR ’000
Stage 3
LKR ’000
Total
LKR ’000
Stage 1
LKR ’000
Stage 2
LKR ’000
Stage 3
LKR ’000
Total
LKR ’000
Balance at beginning 901,871 1,563,877 9,940,734 12,406,482 786,161 2,355,958 8,423,457 11,565,576
Transfer to Stage 1 662,248 (563,585) (98,663) 767,186 (706,463) (60,723)
Transfer to Stage 2 (84,923) 172,478 (87,555) (60,275) 109,101 (48,826)
Transfer to Stage 3 (27,796) (173,925) 201,721 (17,410) (210,075) 227,485
Net remeasurement of loss allowance (577,698) (161,992) 1,788,137 1,048,447 (1,050,167) (422,215) 1,727,227 254,845
New financial assets originated
or purchased
432,750 232,572 1,227,042 1,892,364 476,987 439,272 419,288 1,335,547
Write-off (712) (3,855) (27,398) (31,965) (611) (1,701) (741,068) (743,380)
Foreign exchange and other movement 7,948 7,948 (6,106) (6,106)
Balance as at 31 December 1,305,740 1,065,570 12,951,966 15,323,276 901,871 1,563,877 9,940,734 12,406,482
Financial assets at amortised cost-debt and other instruments – ECL
2020 2019
Stage 1
LKR ’000
Total
LKR ’000
Stage 1
LKR ’000
Total
LKR ’000
Balance at beginning 82,571 82,571 45,414 45,414
Transferred from FVOCI during the year 67,231 67,231
Net remeasurement of loss allowance 121,713 121,713 37,157 37,157
Balance as at 31 December 271,515 271,515 82,571 82,571
Loan Commitments and financial guarantee contracts
2020 2019
Stage 1
LKR ’000
Stage 2
LKR ’000
Total
LKR ’000
Stage 1
LKR ’000
Stage 2
LKR ’000
Total
LKR ’000
Balance at beginning 164,144 16,487 180,631 162,686 34,895 197,581
Net remeasurement of loss allowance 179,454 (3,195) 176,259 1,458 (18,408) (16,950)
Balance as at 31 December 343,598 13,292 356,890 164,144 16,487 180,631
8.2.5.2 Sensitivity of ECL to future economic conditions

The ECL are sensitive to judgements and assumptions made regarding formulation of forward looking scenarios and how such scenarios are incorporated into the calculations. Management performs a sensitivity analysis on the ECL recognised on material classes of its assets.

Sensitivity of factors used to determine impairment provisions

The uncertainty of the impact of COVID-19 introduces significant estimation uncertainty in relation to the measurement of the Bank’s allowance for expected credit losses. The rapidly evolving consequences of COVID-19 and government, business and consumer responses could result in significant adjustments to the allowance in future financial years.

Given current economic uncertainties and the judgment applied to factors used in determining the expected default of borrowers in future periods, expected credit losses reported by the Bank should be considered as a best estimate within a range of possible estimates.

The table below shows the sensitivity of the impairment provision of the Bank as at 31 December 2020 to a reasonably possible change in PDs, LGDs, and forward looking information.

Sensitivity effect on Statement of Financial Position Sensitivity effect
on Income
Statement
Increase/(Decrease) in impairment provision
Stage 1
LKR ’000
Stage 2
LKR ’000
Stage 3
LKR ’000
Total
LKR ’000

LKR ’000
PD 1% increase across all age buckets 997,988 225,291 1,223,279 (1,223,279)
PD 1% decrease across all age buckets* (839,773) (225,284) (1,065,057) 1,065,057
LGD 5% increase 173,900 175,522 368,595 718,017 (718,017)
LGD 5% decrease* (173,877) (175,468) (368,583) (717,928) 717,928
Probability weighted economic scenarios
– Worst case 4% decrease and base
case 4% increase
(10,418) (8,223) (18,641) 18,641
– Worst case 4% increase and base
case 4% decrease
10,418 8,214 18,632 (18,632)

* The PD/LGD decrease is capped to 0%, if applicable.

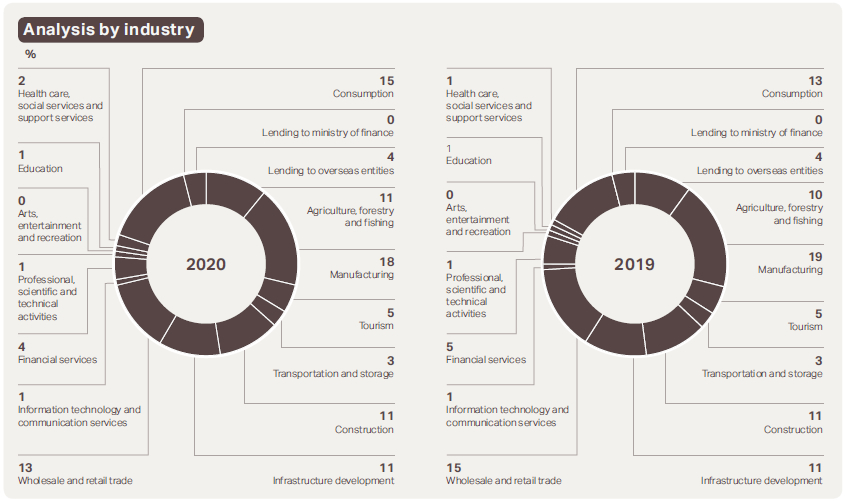
8.2.6 Concentration of credit risk

The Bank monitors concentrations of credit risk by sector and by geographic location. An analysis of concentrations of credit risk from loans and advances, loan commitments, financial guarantees and investment securities is shown below:

In LKR ’000 Loans to and receivable from banks Loans to and receivable
from customers
Investment in debt securities Loan commitments and financial guarantees issued
As at 31 December 2020 2019 2020 2019 2020 2019 2020 2019
Gross carrying amount 4,152,717 317,232,613 285,224,793 108,079,830 93,932,452
Amount committed/guaranteed 124,612,896 108,145,071
Concentration by sector
Agriculture, forestry, and fishing 34,483,557 28,282,969 9,554,167 11,139,531
Manufacturing 55,769,741 54,535,325 29,282,013 24,385,449
Tourism 15,990,359 13,393,587 2,612,852 7,977,653
Transportation and storage 9,108,654 9,434,389 643,732 1,105,107
Construction 34,175,044 32,559,866 252,953 6,700,539 7,074,504
Infrastructure development 34,465,896 30,024,078 21,722,145 14,869,134
Wholesale and retail trade 41,871,503 44,195,272 31,324,334 24,342,484
Information technology and communication services 1,712,933 1,531,401 1,294,637 660,586
Financial services 4,152,717 13,286,037 14,856,831 661,941 2,839,425 4,793,138 2,360,843
Professional, scientific, and
technical activities
3,203,777 1,709,325 318,401 383,807
Arts, entertainment, and
recreation
756,676 788,364 36,875 50,798
Education 3,751,677 1,471,284 1,631,020 283,802
Health care, social services,
and support services
6,077,955 4,213,504 1,089,879 1,181,414
Consumption 50,166,517 36,783,616 9,093,307 7,229,734
Lending to ministry of finance 33,923 164,257
Lending to overseas entities 12,378,364 11,280,725 4,515,858 5,100,225
Government 107,417,889 90,840,074
Other
Total 4,152,717 317,232,613 285,224,793 108,079,830 93,932,452 124,612,897 108,145,071

8.2.7 Offsetting financial assets and financial liabilities

Financial assets and financial liabilities are offset and the net amount presented in the statement of financial position when, and only when the Group currently has a legally enforceable right to set off the amounts and it intends either to settle them on a net basis or to realise the asset and settle the liability simultaneously.

8.3 Liquidity risk

“Liquidity risk” is the risk that the Bank will encounter difficulty in meeting obligations associated with its financial liabilities that are settled by delivering cash or another financial asset. Liquidity risk arises from mismatches in the timing and amounts of cash flows, which is inherent to the Bank’s operations and investments.

8.3.1 Management of liquidity risk

The Bank’s Board of Directors sets the Bank’s strategy for managing liquidity risk and oversight of the implementation is administered by Assets and Liability Management Committee (ALCO). ALCO approves the Bank’s liquidity policies and procedures. Treasury manages the Bank’s liquidity position on a day-to-day basis and reviews daily reports covering the liquidity position of both the Bank and operating subsidiaries. A summary report, including any exceptions and remedial action taken, is submitted to ALCO on a monthly basis or ad hoc when predefined thresholds are breached.

The Bank’s approach to managing liquidity is to ensure, as far as possible, that it will always have sufficient liquidity to meet its liabilities when they are due, under both normal and stressed conditions, without incurring unacceptable losses or risking damage to the Bank’s reputation. The key elements of the Bank’s liquidity strategy are as follows:

Monitoring maturity mismatches, behavioural characteristics of the Bank’s financial assets and financial liabilities, and the extent to which the Group’s assets are encumbered and so not available as potential collateral for obtaining funding. Monitoring the Bank’s liquidity through the Liquid Assets Ratio (statutory minimum is currently 20%) and Liquidity Coverage Ratios using a stock approach. Effecting threshold limits relevant for liquidity management as part of the overall risk limits system of the Bank. Carrying a portfolio of highly liquid assets, diversified by currency and maturity.

8.3.2 Exposure to liquidity risk – Regulatory liquidity (Bank)

As at 31 December 2020 2019
Statutory liquid assets (LKR ’000) 137,237,163 90,664,914
Statutory liquid assets ratio (minimum requirement 20%)
Domestic banking unit (%) 33.78 23.55
Off-shore banking unit (%) 35.45 53.07
Liquidity coverage ratio (minimum requirement 90% in 2020 and 100% in 2019)
All currencies (%) 204.44 140.53
Rupee only (%) 288.27 234.22

Details of the consolidated liquid assets ratio during the reporting period were as follows:

As at 31 December 2020 2019
Average for the period 31.98 25.70
Maximum for the period 34.99 26.91
Minimum for the period 28.27 24.15

8.3.3 Maturity analysis for financial liabilities and financial assets

The following tables set out the remaining contractual maturities of the Bank’s financial liabilities and financial assets.

As at 31 December 2020 BANK Carrying
amount
LKR ’000
Up to
3 months
LKR ’000
3 to
12 months
LKR ’000
1 to 3 years

LKR ’000
3 to 5 years

LKR ’000
More than
5 years
LKR ’000
Total

LKR ’000
Financial liability by type
Non-derivative liabilities
Due to banks 14,909,937 3,631,087 3,765,692 7,513,158 14,909,937
Financial liabilities at amortised
cost – Due to depositors
310,026,892 98,852,578 105,106,743 28,970,585 16,457,256 60,639,730 310,026,892
Financial liabilities at amortised
cost – Due to other borrowers
46,847,076 12,641,905 10,124,287 12,393,268 3,553,834 8,133,782 46,847,076
Debt securities in issue 16,291,279 1,025,771 305,890 8,764,378 6,195,240 16,291,279
Other liabilities 4,783,877 2,298,859 724,698 383,163 421,465 955,692 4,783,877
Subordinated term debt 19,357,497 617,851 1,173,506 8,956,610 8,404,530 205,000 19,357,497
412,216,558 119,068,051 121,200,816 58,216,784 37,601,463 76,129,444 412,216,558
Derivative liabilities
Risk management: 267,883 267,883 267,883
267,883 267,883 267,883
Financial assets by type
Non-derivative assets
Cash and cash equivalents 7,724,364 7,724,364 7,724,364
Balances with Central Bank 4,901,753 4,901,753 4,901,753
Placements with banks 15,414,287 15,414,287 15,414,287
Financial assets measured at
fair value through profit or loss
609,717 564,837 44,880 609,717
Financial assets at amortised cost – Loans to and receivables from banks 4,152,717 4,152,717 4,152,717
Financial assets at amortised cost – Loans to and receivables from other customers 301,909,337 53,502,826 35,148,436 58,850,180 57,608,042 96,799,853 301,909,337
Financial assets at amortised cost – Debt and other instruments 31,604,175 5,374,610 13,359,011 10,929,576 1,940,978 31,604,175
Financial assets measured at fair value through other comprehensive income 88,718,002 15,805,674 25,872,632 17,342,423 7,691,826 22,005,447 88,718,002
Other assets 1,999,405 1,921,049 13,550 11,747 31,747 21,312 1,999,405
457,033,757 109,362,117 74,393,629 87,133,926 67,272,593 118,871,492 457,033,757
Derivative assets
Risk management: 835,464 835,464 835,464
835,464 835,464 835,464
As at 31 December 2019 BANK Carrying
Amount
LKR ’000
Up to
3 months
LKR ’000
3 to 12
months
LKR ’000
1 to 3 years

LKR ’000
3 to 5 years

LKR ’000
More than
5 years
LKR ’000
Total

LKR ’000
Financial liability by type
Non-derivative liabilities
Due to banks 24,594,828 9,464,866 5,791,329 9,338,633 24,594,828
Financial liabilities at amortised cost – Due to depositors 247,786,974 86,203,676 85,695,022 17,085,344 12,864,437 45,938,495 247,786,974
Financial liabilities at amortised cost –
Due to other borrowers
47,307,556 9,107,966 9,149,713 14,000,752 6,154,080 8,895,045 47,307,556
Debt securities in issue 14,148,198 1,028,348 3,147,549 3,783,024 6,189,277 14,148,198
Other liabilities 3,786,445 2,388,520 798,747 36,775 118,536 443,867 3,786,445
Subordinated term debt 16,859,914 657,461 2,227,817 940,482 8,948,215 4,085,939 16,859,914
354,483,915 108,850,837 106,810,177 41,401,986 31,868,292 65,552,623 354,483,915
Derivative liabilities
Risk management: 518,731 518,731 518,731
518,731 518,731 518,731
Financial assets by type
Non-derivative assets
Cash and cash equivalents 5,450,209 5,450,209 5,450,209
Balances with Central Bank 8,666,547 8,666,547 8,666,547
Placements with banks 165,030 165,030 165,030
Financial assets measured at
fair value through profit or loss
5,307,066 251,593 5,055,473 5,307,066
Financial assets at amortised cost – Loans to and receivables from banks
Financial assets at amortised cost – Loans to and receivables from other customers 272,818,311 40,234,030 38,017,279 52,744,363 54,181,538 87,641,101 272,818,311
Financial assets at amortised cost – Debt and other instruments 30,147,032 4,966,191 2,630,013 18,639,478 3,911,350 30,147,032
Financial assets measured at fair value through other comprehensive income 72,716,407 9,450,109 3,187,401 30,008,205 15,649,171 14,421,521 72,716,407
Other assets 2,148,567 1,425,425 278,065 130,296 21,491 293,290 2,148,567
397,419,169 70,609,134 44,112,758 101,522,342 73,763,550 107,411,385 397,419,169
Derivative assets
Risk management: 631,438 631,438 631,438
631,438 631,438 631,438

The following tables set out the remaining contractual maturities of the Group’s financial liabilities and financial assets.

As at 31 December 2020 GROUP Carrying
Amount
LKR ’000
Up to
3 months
LKR ’000
3 to
12 months
LKR ’000
1 to 3 years

LKR ’000
3 to 5 years

LKR ’000
More than
5 years
LKR ’000
Total

LKR ’000
Financial liability by type
Non-derivative liabilities
Due to banks 14,909,937 3,631,087 3,765,692 7,513,158 14,909,937
Financial liabilities at amortised
cost – Due to depositors
309,566,423 98,392,109 105,106,743 28,970,585 16,457,256 60,639,730 309,566,423
Financial liabilities at amortised
cost – Due to other borrowers
46,847,076 12,641,905 10,124,287 12,393,268 3,553,834 8,133,782 46,847,076
Debt securities in issue 16,291,279 1,025,771 305,890 8,764,378 6,195,240 16,291,279
Other liabilities 4,900,958 2,298,860 724,698 500,243 421,465 955,692 4,900,958
Subordinated term debt 19,357,497 617,851 1,173,506 8,956,610 8,404,530 205,000 19,357,497
411,873,170 118,607,583 121,200,816 58,333,864 37,601,463 76,129,444 411,873,170
Derivative liabilities
Risk management: 267,883 267,883 267,883
267,883 267,883 267,883
Financial assets by type
Non-derivative assets
Cash and cash equivalents 7,728,969 7,728,969 7,728,969
Balances with Central Bank 4,901,753 4,901,753 4,901,753
Placements with banks 15,431,962 15,431,962 15,431,962
Financial assets measured
at fair value through profit or loss
609,717 564,837 44,880 609,717
Financial assets at amortised cost – Loans to and receivables from banks 4,152,717 4,152,717 4,152,717
Financial assets at amortised cost – Loans to and receivables from other customers 301,909,337 53,502,826 35,148,436 58,850,180 57,608,042 96,799,853 301,909,337
Financial assets at amortised cost – Debt and other instruments 31,604,175 5,374,610 13,359,011 10,929,576 1,940,978 31,604,175
Financial assets measured at fair value through other comprehensive income 88,718,002 15,805,674 25,872,632 17,342,423 7,691,826 22,005,447 88,718,002
Other assets 2,066,621 1,988,265 13,550 11,747 31,747 21,312 2,066,621
457,123,253 109,451,613 74,393,629 87,133,926 67,272,593 118,871,492 457,123,253
Derivative assets
Risk management: 835,464 835,464 835,464
835,464 835,464 835,464
As at 31 December 2019 GROUP Carrying
Amount
LKR ’000
Up to
3 months
LKR ’000
3 to
12 months
LKR ’000
1 to 3 years

LKR ’000
3 to 5 years

LKR ’000
More than
5 years
LKR ’000
Total

LKR ’000
Financial liability by type
Non-derivative liabilities
Due to banks 24,594,828 9,464,866 5,791,329 9,338,633 24,594,828
Financial liabilities at amortised
cost – Due to depositors
247,457,696 86,062,548 85,605,622 16,986,594 12,864,437 45,938,495 247,457,696
Financial liabilities at amortised
cost – Due to other borrowers
47,307,556 9,107,967 9,149,713 14,000,752 6,154,080 8,895,045 47,307,556
Debt securities in issue 14,148,198 1,028,348 3,147,549 3,783,024 6,189,277 14,148,198
Other liabilities 3,907,977 2,510,052 798,747 36,775 118,536 443,867 3,907,977
Subordinated term debt 16,859,914 657,460 2,227,817 940,482 8,948,215 4,085,939 16,859,914
354,276,169 108,831,241 106,720,777 41,303,236 31,868,292 65,552,623 354,276,169
Derivative liabilities
Risk management: 518,731 518,731 518,731
518,731 518,731 518,731
Financial assets by type
Non-derivative assets
Cash and cash equivalents 5,459,359 5,459,359 5,459,359
Balances with Central Bank 8,666,547 8,666,547 8,666,547
Placements with banks 200,441 165,030 35,411 200,441
Financial assets measured
at fair value through profit or loss
5,307,066 251,593 5,055,473 5,307,066
Financial assets at amortised cost – Loans to and receivables from banks
Financial assets at amortised cost – Loans to and receivables from other customers 272,818,311 40,234,030 38,017,279 52,744,363 54,181,538 87,641,101 272,818,311
Financial assets at amortised cost – Debt and other instruments 30,147,032 4,966,191 2,630,013 18,639,478 3,911,350 30,147,032
Financial assets measured at fair value through other comprehensive income 72,716,407 9,450,109 3,187,401 30,008,205 15,649,171 14,421,521 72,716,407
Other assets 2,238,053 1,514,911 278,065 130,296 21,491 293,290 2,238,053
397,553,216 70,707,770 44,148,169 101,522,342 73,763,550 107,411,385 397,553,216
Derivative assets
Risk management: 631,438 631,438 631,438
631,438 631,438 631,438

The amounts in the table above have been compiled as follows:

Type of financial instrument Basis on which amounts are compiled
Non-derivative financial liabilities and financial assets Undiscounted cash flows, which include estimated interest payments.
Issued financial guarantee contracts, and unrecognised loan commitments Earliest possible contractual maturity. For issued financial guarantee contracts, the maximum amount of the guarantee is allocated to the earliest period in which the guarantee could be called.
Derivative financial liabilities and financial assets held for risk management purposes Contractual undiscounted cash flows. The amounts shown are the gross nominal inflows and outflows for derivatives that have simultaneous gross settlement (e.g. forward exchange contracts and currency swaps) and the net amounts for derivatives that are net settled.
Trading derivative liabilities and assets forming part of the Group’s proprietary trading operations that are expected to be closed out before contractual maturity. Fair values at the date of the statement of financial position. This is because contractual maturities do not reflect the liquidity risk exposure arising from these positions. These fair values are disclosed in the “up to three months” column.
Trading derivative liabilities and assets that are entered into by the Bank with its customers Contractual undiscounted cash flows. This is because these instruments are not usually closed out before contractual maturity and so the Group believes that contractual maturities are essential for understanding the timing of cash flows associated with these derivative positions.

The Bank’s expected cash flows on some financial assets and financial liabilities vary significantly from the contractual cash flows. The principal differences are as follows:

  • demand deposits from customers are expected to remain stable or increase;
  • unrecognised loan commitments are not all expected to be drawn down immediately.

8.3.4 Liquidity reserves

As part of the management of liquidity risk arising from financial liabilities, the Bank holds liquid assets comprising cash and cash equivalents, and debt securities issued by sovereigns, which can be readily sold to meet liquidity requirements. In addition, the Bank maintains agreed lines of credit with other banks and holds unencumbered assets eligible for use as collateral with central banks (these amounts are referred to as the “Bank’s liquidity reserves”).

The following table sets out the components of the Bank’s liquidity reserves

As at 31December 2020
Carrying amount
LKR ’000
2020
Fair value
LKR ’000
2019
Carrying amount
LKR ’000
2019
Fair value
LKR ’000
Balances with Central Bank 4,901,753 4,901,753 8,666,547 8,666,547
Cash and cash equivalents 7,724,364 7,724,364 5,450,209 5,450,209
Placements with banks 15,414,287 15,414,287 165,030 165,030
Unencumbered debt securities issued by sovereigns 98,472,348 98,472,348 80,357,323 80,357,323
Total liquidity reserves 126,512,752 126,512,752 94,639,109 94,639,109

8.3.5 Financial assets available to support future funding

The following table sets out the availability of the bank’s financial assets to support future funding.

Encumbered Unencumbered
Note Pledged as
collateral
LKR ’000
Other*

LKR ’000
Available as
collateral
LKR ’000
Other**

LKR ’000
Total

LKR ’000
31 December 2020
Cash and cash equivalents 26 7,724,364 7,724,364
Balances with Central Bank 27 4,901,753 4,901,753
Placements with banks 28 15,414,287 15,414,287
Derivatives financial assets 29 835,464 835,464
Financial assets measured at fair value through profit or loss 30 609,717 609,717
Financial assets at amortised cost –
Loans to and advances to banks
31 4,152,717 4,152,717
Financial assets at amortised cost –
Loans to and receivables from customers
32 301,909,337 301,909,337
Financial assets at amortised cost –
Debt and other instruments
33 308,951 31,295,224 31,604,175
Financial assets measured at fair value through other comprehensive income 34 8,674,356 80,043,646 88,718,002
Other assets 42 1,999,405 1,999,405
Non-financial assets 7,208,066 7,208,066
Total assets 8,983,307 4,901,753 441,984,756 9,207,471 465,077,287
31 December 2019
Cash and cash equivalents 26 5,450,209 5,450,209
Balances with Central Bank 27 8,666,547 8,666,547
Placements with banks 28 165,030 165,030
Derivatives financial assets 29 631,438 631,438
Financial assets measured at fair value through profit or loss 30 5,307,066 5,307,066
Financial assets at amortised cost – Loans to and receivables from banks 31
Financial assets at amortised cost – Loans to and receivables from other customers 32 272,818,311 272,818,311
Financial assets at amortised cost –
Debt and other instruments
33 43,883 30,103,149 30,147,032
Financial assets measured at fair value through other comprehensive income 34 16,625,375 56,091,032 72,716,407
Other assets 42 2,148,567 2,148,567
Non-financial assets 6,846,673 6,846,673
Total assets 16,669,258 8,666,547 370,566,235 8,995,240 404,897,280

* Represents assets that are not pledged but that the Group believes it is restricted from using to secure funding, for legal or other reasons.

** Represents assets that are not restricted for use as collateral, but that the Group would not consider readily available to secure funding in the normal course of business.

8.4 Market risk

“Market risk” is the possibility of losses arising from changes in market variables such as interest rates, equity prices, foreign exchange rates, and credit spreads. The objective of the Bank’s market risk management is to manage and control market risk exposures within acceptable parameters to ensure the Bank’s solvency while optimising the return on risk.

8.4.1 Management of market risk

The Bank separates its exposure to market risks between trading and non-trading portfolios. Trading portfolios mainly include positions arising from market making and proprietary position taking, together with financial assets and financial liabilities that are managed on a fair value basis and non-trading portfolios from positions arising from financial investments measured at Fair Value through Other Comprehensive Income (FVOCI) and financial investments at amortised cost and from derivatives held for risk management purposes.

Overall authority for market risk management is vested with the Board of Directors through the Board Integrated Risk Management Committee (BIRMC). The operational authority for managing market risk is vested with ALCO. Foreign exchange risk is managed within approved limits
of the Bank.

The Bank employs a range of tools to monitor and limit market risk exposures. These are discussed below, separately for trading and non-trading portfolios.

The following table sets out the allocation of assets and liabilities subject to market risk between trading and
non-trading portfolios.

Market risk measure
In LKR ’000 Note Carrying
amount
LKR ’000
Trading
portfolio
LKR ’000
Non-trading
portfolio
LKR ’000
31 December 2020
Assets subject to market risk
Cash and cash equivalents 26 2,895,117 2,895,117
Placements with banks 28 15,414,287 15,414,287
Derivative financial assets 29 835,464 835,464
Financial assets measured at fair value through profit or loss 30 609,717 609,717
Financial assets at amortised cost –
Loans to and receivables from banks
31 4,152,717 4,152,717
Financial assets at amortised cost –
Loans to and receivables from other customers
32 301,909,337 301,909,337
Financial assets at amortised cost – Debt and other instruments 33 31,604,175 31,604,175
Financial assets measured at fair value through other
comprehensive income
34 88,718,002 88,718,002
Liabilities subject to market risk
Due to banks 44 14,909,937 14,909,937
Derivative financial liabilities 29 267,883 267,883
Financial liabilities at amortised cost – Due to depositors 45 310,026,892 310,026,892
Financial liabilities at amortised cost – Due to other borrowers 46 46,847,076 46,847,076
Debt securities in issue 47 16,291,279 16,291,279
Subordinated term debt 51 19,357,497 19,357,497
Market risk measure
In LKR ’000 Note Carrying
amount
LKR ’000
Trading
portfolio
LKR ’000
Non-trading
portfolio
LKR ’000
31 December 2019
Assets subject to market risk
Cash and cash equivalents 26 926,842 926,842
Placements with banks 28 165,030 165,030
Derivative financial assets 29 631,438 631,438
Financial assets measured at fair value through profit or loss 30 5,307,066 5,307,066
Financial assets at amortised cost – Loans to and advances to banks 31
Financial assets at amortised cost –
Loans to and receivables to customers
32 272,818,311 272,818,311
Financial assets at amortised cost – Debt and other instruments 33 30,147,032 30,147,032
Financial assets measured at fair value through other
comprehensive income
34 72,716,407 72,716,407
Liabilities subject to market risk
Due to banks 44 24,594,828 24,594,828
Derivative financial liabilities 29 518,731 518,731
Financial liabilities at amortised cost – Due to depositors 45 247,786,974 247,786,974
Financial liabilities at amortised cost – Due to other borrowers 46 47,307,556 47,307,556
Debt securities in issue 47 14,148,198 14,148,198
Subordinated term debt 51 16,859,914 16,859,914

8.4.2 Exposure to market risks – Trading portfolios

The principal tool used to measure and control market risk exposure within the Bank’s trading portfolios is VaR. The VaR of a trading portfolio is the maximum estimated loss that can arise with a specified probability (confidence level) in the portfolio over a specified period of time (holding period) from an adverse market movement.

The VaR model used by the Bank is based on a 99% confidence level and assumes 1, 10 and 60-day holding periods (Depending on product type). The VaR model used is based mainly on historical simulation. Taking account of market data, and observed correlation between different markets and prices, the model generates a wide range of plausible future scenarios for market price movements.

Although VaR is an important tool for measuring market risk, the assumptions on which the model is based give rise to some limitations, including the following:

  • The holding period assumes that it is possible to hedge or dispose of positions within that period. This may not be the case for illiquid assets or in situations in which there is severe market liquidity.
  • A 99% confidence level does not reflect losses that may occur beyond this level. Even within the model used, there is a 1% probability that losses could exceed the VaR in any given period.
  • VaR is calculated does not reflect exposures that may arise on positions during the trading day.
  • The use of historical data as a basis for determining the possible range of future outcomes does not cover all possible scenarios, especially those of an exceptional nature.
  • The VaR measure is dependent on the Bank’s position and the volatility of market prices. The VaR of an unchanged position reduces if market price volatility declines and vice versa.

The limitations of the VaR methodology are recognised by supplementing VaR limits with other position and sensitivity limit structures, including limits to address potential concentration risks within each trading portfolio. In addition, the Bank uses a wide range of stress tests to model the financial impact of a variety of exceptional market scenarios on individual trading portfolios and the Bank’s overall position. The Bank determines the scenarios as follows:

  • sensitivity scenarios consider the impact of any single risk factor or set of factors that are unlikely to be captured within the VaR models;
  • technical scenarios consider the largest move in each risk factor without consideration of any underlying market correlation; and
  • hypothetical scenarios consider potential macro-economic events – e.g., periods of prolonged market illiquidity, reduced fungibility of currencies, natural disasters or other catastrophes, health pandemics, etc.

The analysis of scenarios and stress tests is reviewed by ALCO.

8.4.2.1 Equity price risk

Equity price risk is part of market risk which is defined as the risk of possible losses arising from the equity market investments due to changes in the market prices of the invested shares. The Bank is exposed to equity prices risk through its investments in the equity market which has been shown in the FVOCI portfolio and the trading portfolio.

Financial assets measured at fair value through profit or loss portfolio
Parameter Position as at
31 December
2020
LKR ’000
Position as at
31 December
2019
LKR ’000
Marked-to-market value of the total quoted equity portfolio 44,880 4,777,423
Value-at-risk (under 99% probability for a quarterly time horizon) 28.93% 12.35%
Maximum possible loss of value in the marked-to-market value of the portfolio as
indicated by the VaR over a quarterly period
12,984 590,012
Unrealised gains in the trading equity portfolio reported in the fair value reserve 11,069 2,612,462

Equity price risk is quantified using the Value at Risk (VAR) approach based on the Historical Loss Method. Historical three-year portfolio returns is adopted to compute VAR as a measure of the equity prices risk exposure by the Bank. This VAR computation for the equity trading portfolio considers a quarterly time horizon.

8.4.3 Exposure to market risks –
Non-trading portfolios

Financial assets measured at fair value through other comprehensive income
Parameter Position as at
31 December
2020
LKR ’000
Position as at
31 December
2019
LKR ’000
Marked-to-market value of the total quoted equity portfolio 12,299,552 8,812,702
Value-at-risk (under 99% probability for a quarterly time horizon) 27.48% 18.20%
Maximum possible loss of value in the marked-to-market value of the portfolio as
indicated by the VaR over a quarterly period
3,379,917 1,603,912
Unrealised gains in the trading equity portfolio reported in the fair value reserve 2,801,795 4,476,529

Equity price risk is quantified using the Value at Risk (VaR) approach based on the Historical Loss Method. Historical three-year portfolio returns is adopted to compute VaR as a measure of the equity prices risk exposure by the Bank. This VAR computation for the equity Trading portfolio considers a quarterly time horizon.

8.4.4 Interest rate risk

The principal risk to which non-trading portfolios are exposed is the risk of loss from fluctuations in the future cash flows or fair values of financial instruments because
of a change in market interest rates.

Duration analysis as at 31 December 2020
Portfolio Face
value
LKR ’000
Marked-to
market value
LKR ’000
Duration Interpretation of duration
Treasury securities measured at FVOCI/LKR Bonds 69,328,224 75,272,434 1.53 Portfolio value will decline approximately by 1.53% as a result of 1% increase in the interest rates
Treasury securities measured at FVOCI/Sovereign Bonds 1,311,660 931,706 1.66 Portfolio value will decline approximately by 1.66% as a result of 1% increase in the interest rates

Market risk exposure for interest rate risk in the trading portfolio as at 31 December 2020 is Nil. Market risk exposure for interest rate risk in the FVOCI Rupee portfolio as at 31 December 2020 is depicted by duration of 1.53%.

This level of interest rate risk exposure in the Rupee FVOCI portfolio can be interpreted as a possible potential loss in the marked-to-market value amounting to LKR 1,154 Mn,
as at 31 December 2020.

Market risk exposure for interest rate risk in the FVOCI US Dollar portfolio as at 31 December 2020 is depicted by duration of 1.66%.

This level of interest rate risk exposure in the FVOCI US Dollar portfolio can be interpreted as a possible potential loss in the marked-to-market value amounting to LKR 15.4 Mn, as at 31 December 2020.

8.4.4.1 Potential impact to NII due to change in market interest rates

Overall up to the 12-month time bucket, the Bank carried a net liability sensitive position. This sensitivity will vary for each time bucket up to the 12-month period where up to one month there is a net asset sensitive position.

The interest rate risk exposure as at 31 December 2020 is quantified based on the assumed change in the interest rates for each time period and is given in table below:

Over 0 up to
1 month
LKR ’000
Over 1 up to
3 months
LKR ’000
Over 3 up to
6 months
LKR ’000
Over 6 up to
12 months
LKR ’000
Over
12 months
LKR ’000
31 December 2020
Cash and cash equivalents 317,034
Placements with banks 15,414,287
Loans to and receivables from banks 4,152,717
Loans to and receivables from other customers 151,094,075 24,374,012 12,864,586 16,170,593 89,643,442
Investment securities 4,861,228 16,635,784 5,113,290 34,151,804 47,046,209
175,839,341 41,009,796 17,977,876 50,322,397 136,689,651
Due to banks 1,792,092 7,927,554 5,000,000
Deposits from customers 89,795,761 58,804,855 68,468,382 53,354,008 30,962,639
Due to other borrowers 7,492,850 12,453,461 10,591,793 1,239,278 15,069,694
Debt securities in issue 16,291,279
Subordinated liabilities 1,791,357 17,566,140
99,080,703 79,185,870 79,060,175 56,384,643 84,889,752
Net rate sensitive assets/(liabilities) 76,758,638 (38,176,074) (61,082,299) (6,062,246) 51,799,899
Assumed change in interest rates (%) 0.50 1.00 1.50 2.00
Impact 383,793 (349,947) (687,176) (60,622)
Total net impact if interest rates increase (713,952)
Total net impact if interest rates decline 713,952
1 month to 0

LKR ’000
Over 1 up to
3 months
LKR ’000
Over 3 up to
6 months
LKR ’000
Over 6 up to
12 months
LKR ’000
Over
12 months
LKR ’000
31 December 2019
Cash and cash equivalents 333,741
Placements with banks 165,030
Loans to and receivables from banks
Loans to and receivables from other customers 151,965,068 7,780,400 12,106,527 14,419,459 78,745,361
Investment securities 338,257 9,499,387 3,357,174 2,852,941 77,802,123
152,802,096 17,279,787 15,463,701 17,272,400 156,547,484
Due to banks 6,502,929 8,129,761 2,148,769 2,566,164 5,000,000
Deposits from customers 75,196,582 54,615,104 49,236,046 55,107,361 8,177,872
Due to other borrowers 9,178,922 8,835,038 10,163,228 3,435,505 15,511,272
Debt securities in issue 3,000,000 10,000,000
Subordinated liabilities 2,000,000 14,000,000
90,878,433 71,579,903 66,548,043 61,109,030 52,689,144
Net rate sensitive assets/(liabilities) 61,923,663 (54,300,116) (51,084,342) (43,836,630) 103,858,340
Assumed change in interest rates (%) 0.50 1.00 1.50 2.00
Impact 309,618 (497,751) (574,699) (438,366)
Total net impact if interest rates increase (1,201,198)
Total net impact if interest rates decline 1,201,198

The Bank has assumed that the assets and liabilities are repriced at the beginning of each time bucket and has also taken into account the remaining time from the repricing date up to one year.

8.4.5 Foreign exchange risk

Foreign exchange risk in net open position (NOP)/unhedged position of Bank

The following table indicates the DFCC’s exchange rate risk exposure based on its size of the NOP/unhedged positions in the foreign currency assets/liabilities. By 31 December 2020, DFCC carried a USD equivalent net open/unhedged “Oversold” position of LKR 3.56 Mn. The impact of exchange rate risk is given below:

Amount
Net exposure – USD equivalent (1,901,534)
Value of position in LKR ’000 (356,309)
Exchange rate (USD/LKR) as at 31 December 2020 187.38
Possible potential loss to Bank – LKR ’000
– If Exchange rate (USD/LKR) depreciates by 1% (3,563)
– If exchange rate depreciates by 10% (35,631)
– If exchange rate depreciates by 15% (53,446)

The estimated potential exchange loss is off set by the interest gain due to interest differential between Sri Lankan Rupee and the respective foreign currencies.

8.4.6 Market risk exposures for regulatory capital assessment

Under the standardised approach of Basel III with effect from July 2017, market risk exposures are quantified for regulatory capital purposes. The computation results as at 31 December 2020 are as follows:

Risk-weighted
assets

LKR ’000
Quantified
possible
exposure
LKR ’000
Interest rate risk 12,554,742 1,506,569
Equity price risk 18,450 2,214
Foreign exchange and gold risk 383,258 45,991
Total 12,956,450 1,554,774

8.5 Operational risk

“Operational risk” is the risk of direct or indirect loss arising from a wide variety of causes associated with the Bank’s processes, personnel, technology, and infrastructure, and from external factors other than credit, market and liquidity risks. Operational risks arise from all of the Bank’s operations.

The Bank’s objective is to manage operational risk so as to balance the avoidance of financial losses and damage to the Bank’s reputation with overall cost effectiveness and innovation. In all cases, Bank’s policy requires compliance with all applicable legal and regulatory requirements.

The following are included in the process of the operational risk management in the Bank:

  1. a. Monitoring of the Key Risk Indicators (KRIs) for the departments/functions under the defined threshold limits using a traffic light system. Develop Risk and Control Self-Assessments to identify the risk exposure of all processes.
  2. b. Operational risk incident reporting system and the independent analysis of the incidents by the IRMD, and recognise necessary improvements in the systems, processes and procedures.
  3. c. Analyse downtime of the critical systems, attrition information, exit interview comments and complaints to identify operational risks and recommend mitigating controls. The key findings of the analysis are evaluated at the ORMC and the BIRMC meetings in an operational risk perspective.

The primary responsibility for the development and implementation of controls to address operational risk lies with IRMD whilst implementation is assigned to Senior Management within each business unit. Operational Risk Coordinating Officers are appointed within each department/Branch to assist in managing the Operational Risk. This responsibility is supported by the development of overall standards for management of operational risk in the following areas:

  1. a. Requirements for appropriate segregation of duties, including independent authorisation of transactions.
  2. b. Requirements for reconciliation and monitoring of transactions.
  3. c. Compliance with regulatory and other legal requirements.
  4. d. Documentation of controls and procedures.
  5. e. Requirements for periodic assessment of operational risks faced and the adequacy of controls and procedures to address the identified risks.
  6. f. Requirements for reporting of operational losses and propose remedial action.
  7. g. Development of contingency plans.
  8. h. Training and professional development to establish ethics and business standards.
  9. i. Insurance covering risk due to threats arising from external and other events.

Compliance with the Bank’s standards is supported by a programme of periodic reviews undertaken by internal audit. The results of internal audit reviews are discussed with the business unit to which they relate, with summaries submitted to the Audit Committee and Senior Management.

Group operational risk assessments are conducted at the board level.

8.5.1 Capital management

The Bank manages its capital at Bank and Group level considering both regulatory requirement and risk exposures. Its regulatory capital position is analysed by the BIRMC on a quarterly basis and recommendations and decisions are made accordingly. The capital management goals are as follows:

  1. a. Ensure regulatory minimum capital adequacy requirements are not compromised.
  2. b. Bank maintains its international and local credit ratings and ensures no downgrading occurs as a result of deterioration of risk capital of the Bank other than in an extreme change in external operating environment .
  3. c. Capital impact of business decisions including strategic business plans are properly assessed and taken into consideration.
  4. d. Ensure capital consumption by business actions are adequately priced. e. Optimising ROE

Central Bank of Sri Lanka sets and monitors regulatory capital requirement on both consolidated and solo basis. The Bank is required to comply with the provisions of the Basel III requirements in respect of regulatory capital commencing from July 2017. The Bank currently uses the standardised approach for credit risk and market risk and basic indicator approach for operational risk.

The Basel III capital regulations, which are currently in force, will continue to be based on the three-mutually reinforcing Pillars introduced under Basel II, i.e., minimum capital requirement, supervisory review process and market discipline. Basel III focuses on increasing the quality and quantity of capital especially the Core Capital, through redefining the common equity capital and introducing new capital buffers such as the Capital Conservation Buffer and a Capital Surcharge on domestic systematically important banks. DFCC Bank started reporting capital computations under the Basel III requirements from mid 2017 as per the regulatory requirements.

Regulatory capital comprises Tier 1 capital and Tier 2 capital. The Bank’s policy is to maintain a strong capital base so as to ensure investor, creditor, and market confidence to sustain future development of the business. DFCC Bank and its Group have complied with the minimum capital requirements imposed by the Central Bank of Sri Lanka throughout the year.

Extraordinary regulatory measures issued by Central Bank of Sri Lanka on 27 March 2020, to provide flexibility to Licensed Banks to support business and individuals affected by the ourtbreak of COVID-19, allowed the Bank to draw down 0.5% of the capital conservation buffer setting the regulatory minimum requirement as 8% for Tier 1 capital ratio and 12% for Total capital ratio.

8.5.1.1 Key regulatory ratios – Capital adequacy
Item 31 December 2020 31 December 2019
Bank Group Bank Group
Regulatory capital (LKR ’000)
Common equity Tier 1 35,041,771 35,113,117 34,824,554 34,908,304
Tier 1 Capital 35,041,771 35,113,117 34,824,554 34,908,304
Total Capital 51,055,165 51,126,511 48,542,925 48,626,675
Regulatory capital ratios (%)
Common equity Tier 1 Capital ratio 10.820 10.816 11.342 11.327
Minimum requirement 2020 – 6.5% (2019 – 7.00%)
Tier 1 capital ratio 10.820 10.816 11.342 11.327
Minimum requirement 2020 – 8.0% (2019 – 8.5%)
Total capital ratio 15.764 15.749 15.810 15.778
Minimum requirement 2020 – 12.0% (2019 – 12.5%)
Basel III computation of capital ratios
Item Amount (LKR ‘000)
31 December 2020 31 December 2019
Bank Group Bank Group
Common Equity Tier 1 (CET1) Capital after Adjustments 35,041,771 35,113,117 34,824,554 34,908,304
Common Equity Tier 1 (CET1) Capital 45,423,144 48,839,196 42,000,264 45,050,466
Equity Capital (Stated Capital)/Assigned Capital 7,682,465 7,682,465 7,530,371 7,530,371
Reserve Fund 2,583,968 2,583,968 2,461,968 2,461,968
Published retained earnings/(Accumulated retained losses) 19,652,168 23,061,080 18,228,086 21,278,288
Published accumulated Other Comprehensive Income (OCI) 1,724,704 1,731,844
General and other disclosed reserves 13,779,839 13,779,839 13,779,839 13,779,839
Unpublished current year's profit/loss and Gains reflected in OCI
Ordinary shares issued by consolidated banking and financial subsidiaries of the Bank and held by third parties
Total Adjustments to CET1 Capital 10,381,374 13,726,078 7,175,709 10,142,162
Goodwill (net) 156,226 156,226
Intangible assets (net) 1,713,052 1,728,580 1,184,659 1,205,923
Investment in capital of banks and financial institutions 8,571,286 11,838,353 5,762,829 8,648,828
Others 97,036 2,919 228,221 131,185
Additional Tier 1 (AT1) Capital after adjustments
Additional Tier 1 (AT1) Capital
Qualifying Additional Tier 1 Capital Instruments
Instruments issued by consolidated banking and financial subsidiaries of the Bank and held by third parties
Total Adjustments to AT1 Capital


Item Amount (LKR ‘000)
31 December 2020 31 December 2019
Bank Group Bank Group
Investment in own shares
Others (specify)
Tier 2 Capital after adjustments 16,013,394 16,013,394 13,718,371 13,718,371
Tier 2 Capital 16,013,394 16,013,394 13,718,371 13,718,371
Qualifying Tier 2 Capital Instruments 14,174,868 14,174,868 12,034,562 12,034,562
Revaluation gains
Loan loss provisions 1,838,526 1,838,526 1,683,809 1,683,809
Instruments issued by consolidated banking and financial subsidiaries of the Bank and held by third parties
Total adjustments to Tier 2
Investment in own shares
Others (specify)
CET1 Capital 35,041,771 35,113,117 34,824,554 34,908,304
Total Tier 1 Capital 35,041,771 35,113,117 34,824,554 34,908,304
Total Capital 51,055,165 51,126,511 48,542,925 48,626,675
Total Risk Weighted Assets (RWA)
RWAs for credit risk 293,505,729 293,920,302 274,009,885 274,759,093
RWAs for market risk 12,956,450 12,956,450 16,956,352 16,956,352
RWAs for operational risk 17,400,093 17,751,642 16,074,112 16,479,374
CET1 Capital Ratio (including capital conservation buffer, countercyclical capital buffer and surcharge on D-SIBs) (%) 10.820 10.816 11.342 11.327
of which: Capital Conservation Buffer (%) 1.20 1.20 1.25 1.25
of which: Countercyclical Buffer (%) N/A N/A N/A N/A
of which: Capital Surcharge on D-SIBs (%) N/A N/A N/A N/A
Total Tier 1 Capital Ratio (%) 10.820 10.816 11.342 11.327
Total Capital Ratio (including Capital Conservation Buffer, Countercyclical Capital Buffer and Surcharge on D-SIBs) (%) 15.764 15.749 15.810 15.778
of which: Capital Conservation Buffer (%) 1.20 1.20 1.25 1.25
of which: Countercyclical Buffer (%) N/A N/A N/A N/A
of which: Capital Surcharge on D-SIBs (%) N/A N/A N/A N/A

See accounting policy in Note 5.3.7.

9.1 Valuation models

The Group measures fair values using the following fair value hierarchy, which reflects the significance of the inputs used in making the measurements.

Level 1: Inputs that are quoted market prices (unadjusted) in active markets for identical instruments.

Level 2: Inputs other than quoted prices included within Level 1 that are observable either directly (i.e., as prices) or indirectly (i.e., derived from prices). This category includes instruments valued using: quoted market prices in active markets for similar instruments; quoted prices for identical or similar instruments in markets that are considered less than active; or other valuation techniques in which all significant inputs are directly or indirectly observable from market data.

Level 3: Inputs that are unobservable. This category includes all instruments for which the valuation technique includes inputs that are not observable and the unobservable inputs have a significant effect on the instrument’s valuation. This category includes instruments that are valued based on quoted prices for similar instruments for which significant unobservable adjustments or assumptions are required to reflect differences between the instruments.

Valuation techniques include net present value and discounted cash flow models, comparison with similar instruments for which observable market prices exist, and other valuation models. Assumptions and inputs used in valuation techniques include risk-free and benchmark interest rates, credit spreads and other premiums used in estimating discount rates, bond and equity prices, foreign currency exchange rates, equity and equity index prices and expected price volatilities and correlations.

The objective of valuation techniques is to arrive at a fair value measurement that reflects the price that would be received to sell the asset or paid to transfer the liability in an orderly transaction between market participants at the measurement date.

The Group uses widely recognised valuation models for determining the fair value of common and more simple financial instruments, like Government Securities, interest rate and currency swaps that use mostly observable market data and require little management judgement and estimation. Observable prices and model inputs are usually available in the market for listed debt and equity securities, Government Securities and simple over the counter derivatives like forward exchange contracts and interest rate swaps. Availability of observable market prices and model inputs reduces the need for management judgement and estimation and also reduces the uncertainty associated with determination of fair values. Availability of observable market prices and inputs varies depending on the products and markets and is prone to changes based on specific events and general conditions in the financial markets.

Fair value estimates obtained from models are adjusted for any other factors, such as liquidity risk or model uncertainties, to the extent that the Group believes that a third party market participant would take them into account in pricing a transaction.

Model inputs and values are calibrated against historical data and published forecasts and, where possible, against current or recent observed transactions in different instruments and against broker quotes. This calibration process is inherently subjective and it yields ranges of possible inputs and estimates of fair value, and management uses judgement to select the most appropriate point in the range.

9.2 Valuation framework

The established control framework with respect to the measurement of fair values, includes an oversight which is independent of front office management. Treasury Middle Office has overall responsibility for independently verifying the results of trading and investment operation.

Specific controls include:

  • – Verification of observable pricing
  • – Review and approval process for new models and changes to models involving both product control and group market risk
  • – Calibration and back testing of models
  • – Stress testing

When third party information, such as broker quotes or pricing services is used to measure fair value, the evidence so obtained to support the conclusion that such valuations meet the requirements of SLFRSs/LKASs is documented.

This includes:

  • – Verifying that the broker or pricing service is approved by the Bank for use in pricing the relevant type of financial instrument – Several quotes obtained from randomly selected brokers for the same financial instrument and the fair value determined on this basis

Any changes to the fair value methodology is reported to the Bank’s Audit Committee.

9.3 Financial instruments measured at fair value – Fair value hierarchy

The following table analyses financial instruments measured at fair value at the reporting date, by the level in the fair value hierarchy into which the fair value measurement is categorised. The amounts are based on the values recognised in the statement of financial position. The fair values include any deferred differences between the transaction price and the fair value on initial recognition when the fair value is based on a valuation technique that uses unobservable inputs.

A. Bank/Group

As at 31 December 2020 Notes Level 1
LKR ’000
Level 2
LKR ’000
Level 3
LKR ’000
Total
LKR ’000
Financial assets
Derivative financial assets 29
Forward foreign exchange contracts 835,464 835,464
Financial assets measured at fair value through profit or loss 30
Equity securities – quoted 44,880 44,880
Units in unit trusts – quoted 3,740 3,740
Units in unit trusts – unquoted 561,097 561,097
Financial assets measured at fair value
through other comprehensive income
34
Government of Sri Lanka Treasury Bills and Bonds 75,272,434 75,272,434
Sri Lanka Sovereign Bonds 931,706 931,706
Equity shares – quoted 12,299,552 12,299,552
Equity shares – unquoted 213,810 213,810
Preference shares 500 500
88,552,312 1,396,561 214,310 90,163,183
Financial liabilities
Derivative financial liabilities 29
Forward foreign exchange contracts 267,883 267,883
267,883 267,883
As at 31 December 2019 Notes Level 1
LKR ’000
Level 2
LKR ’000
Level 3
LKR ’000
Total
LKR ’000
Financial assets
Derivative financial assets 29
Forward foreign exchange contracts 631,438 631,438
Financial assets measured at fair value through profit or loss 30
Equity securities – quoted 4,777,423 4,777,423
Units in unit trusts – quoted 3,740 3,740
Units in unit trusts – unquoted 525,903 525,903
Financial assets measured at fair value
through other comprehensive income
34
Government of Sri Lanka Treasury Bills and Bonds 61,442,296 61,442,296
Sri Lanka Sovereign Bonds 2,260,552 2,260,552
Equity securities – quoted 8,812,702 8,812,702
Equity securities – unquoted 200,357 200,357
Preference shares 500 500
77,296,713 1,157,341 200,857 78,654,911
Financial liabilities
Derivative financial liabilities 29
Forward foreign exchange contracts 518,731 518,731
518,731 518,731

As Treasury Bills/Bonds are valued using Central Bank published rates, investments in Treasury Bills/Bonds are classified under Level 1. Other securities which are listed in Colombo stock exchange are also classified as Level 1 asset by referring to the quoted prices.

9.3.1 Valuation techniques and significant unobservable inputs

The following table shows the valuation techniques used in measuring Level 2 and Level 3 fair values for financial instruments in the statement of financial position, as well as the significant unobservable inputs used.

Type Valuation technique Significant unobservable inputs Inter-relationship between significant unobservable inputs and fair value measurement
Unquoted
equity shares
Net asset approach: The fair value is determining based
on the net assets value of the unquoted equity share
Net asset value
per share
The estimated fair value would increase/(decrease) if the adjusted net asset value per share were higher/(lower)
Forward
exchange contracts
Forward pricing: The fair value is determined using quoted forward exchange rates at the reporting date and present value calculations based on high credit quality yield curves in the respective currencies. Not applicable Not applicable
Interest rate swaps/Cross currency swaps Swap models: The fair value is calculated as the present value of the estimated future cash flows. Estimates of future floating-rate cash flows are based on quoted swap rates, futures prices and interbank borrowing rates. Estimated cash flows are discounted using a yield curve constructed from similar sources and which reflects the relevant benchmark interbank rate used by market participants for this purpose when pricing interest rate swaps. The fair value estimate is subject to a credit risk adjustment that reflects the credit risk of the Group and of the counterparty; this is calculated based on credit spreads derived from current credit default swap or bond prices. Not applicable Not applicable
Units in unit trusts – unquoted The fair value is determined by using the Daily Prices published by the Unit Trust managers (which is derived by dividing the net asset value by the number of units) Not applicable Not applicable

9.3.2 Transfers between Levels 1 and 2

There were no transfers from Level 1 to Level 2 or Level 2 to Level 1 in 2020 and no transfers in either direction in 2019.

9.3.3 Level 3 recurring fair values

9.3.3.1 Reconciliation of Level 3 fair values

The following table shows a reconciliation from the opening balances to the closing balances for Level 3 fair values:

Equity securities
Bank/Group
2020
LKR ’000
2019
LKR ’000
Balance at 1 January 200,357 188,789
Purchased during the year 1,000
Gain included in OCI
– Net change in fair value (unrealised) 13,453 10,568
Balance at 31 December 213,810 200,357
9.3.3.2 Transfer out of Level 3

There were no transfers out of Level 3 and no transfers out of Level 2 in 2020.

9.3.3.3 Sensitivity analysis

For the fair values of equity securities, reasonably possible changes at the reporting date to one of the significant unobservable inputs, holding other inputs constant, would have the following effects:

OCI, net of tax
Equity securities As at 31 December 2020 Increase
LKR ’000
Decrease
LKR ’000
Adjusted net assets value
(5% movement)
10,691 (10,691)
Accounting judgements, estimates and assumptions

Where the fair values of financial assets and financial liabilities recorded in the statement of financial position cannot be derived from active markets, those are determined using a variety of valuation techniques that include the use of mathematical models. The inputs to these models are derived from observable market data where possible, but if this is not available, judgement to establish fair values. The valuation of financial instruments is described in more detail in Note 4 to the financial statements.

COVID-19 Considereations

The Group evaluates the material accuracy of the valuations incorporated in the financial statements as they can involve a high degree of judgement and estimation in determining the carrying values of financial assets and financial liabilities at the reporting date.

The majority of valuation models the Group uses employ only observable market data as inputs. This has not changed as a result of COVID-19, However the Group has considered the impact of related economic and market disruptions on fair value measurement assumptions and the appropriateness of valuation inputs, notably valuation adjustments, as well as the impact of COVID-19 on the classification of exposures in the fair value hierarchy.

For certain financial instruments, the Group may use data that is not readily observable in current markets. If we use unobservable market data, then more judgement is exercised to determine fair value depending on the significance of the unobservable input to the overall valuation. Generally, unobservable inputs are derived from other relevant market data and compare them to observed transaction prices where available.

When establishing the fair value of a financial instrument using a valuation technique, the Group considers valuation adjustments in determining the fair value. The Group may apply adjustments (such as bid/offer spreads, credit valuation adjustments and funding valuation adjustments – refer Note 10 Derivative Financial Instruments) to reflect the Group’s assessment of factors that market participants would consider in setting fair value.

9.4 Financial instruments not measured at fair value

The following table sets out the fair values of financial instruments not measured at fair value and analyses them by the level in the fair value hierarchy into which each fair value measurement is categorised:

As at 31 December 2020 Notes Level 1
LKR ’000
Level 2
LKR ’000
Level 3
LKR ’000
Fair value
LKR ’000
Carrying amount
LKR ’000
Bank
Assets
Cash and cash equivalents 26 7,724,364 7,724,364 7,724,364
Balances with Central Bank of Sri Lanka 27 4,901,753 4,901,753 4,901,753
Placements with banks 28 15,414,287 15,414,287 15,414,287
Financial assets at amortised cost – Loans to and receivables from banks 31 4,152,717 4,152,717 4,152,717
Financial assets at amortised cost – Loans to and receivables from
other customers
32 295,969,708 295,969,708 301,909,337
Financial assets at amortised cost – Debt and other instruments 33 18,412,228 13,221,152 31,633,380 31,604,175
Other assets 42 1,999,405 1,999,405 1,999,405
Total 18,412,228 45,414,273 297,969,113 361,795,614 367,706,038
Liabilities
Due to banks 44 14,909,937 14,909,937 14,909,937
Financial assets at amortised cost – Due to depositors 45 304,408,686 304,408,686 310,026,892
Financial assets at amortised cost – Due to other borrowers 46 46,847,076 46,847,076 46,847,076
Debt securities in issue 47 17,124,659 17,124,659 16,291,279
Other liabilities 50 4,783,877 4,783,877 4,783,877
Subordinated term debt 51 20,476,257 20,476,257 19,357,497
Total 52,510,853 356,039,639 408,550,492 412,216,558
As at 31 December 2019 Notes Level 1
LKR ’000
Level 2
LKR ’000
Level 3
LKR ’000
Fair value
LKR ’000
Carrying amount
LKR ’000
Assets
Cash and cash equivalents 26 5,450,209 5,450,209 5,450,209
Balances with Central Bank of Sri Lanka 27 8,666,547 8,666,547 8,666,547
Placements with banks 28 165,030 165,030 165,030
Financial assets at amortised cost – Loans to and receivables from banks 31
Financial assets at amortised cost – Loans to and receivables from other customers 32 269,198,869 269,198,869 272,818,311
Financial assets at amortised cost – Debt and other instruments 33 20,531,578 10,127,494 30,659,072 30,147,032
Other assets 42 2,148,567 2,148,567 2,148,567
Total 20,531,578 24,409,280 271,347,436 316,288,294 319,395,696
Liabilities
Due to banks 44 24,594,828 24,594,828 24,594,828
Financial liabilities at amortised cost – Due to depositors 45 248,066,585 248,066,585 247,786,974
Financial liabilities at amortised cost – Due to other borrowers 46 47,307,556 47,307,556 47,307,556
Debt securities in issue 47 14,708,677 14,708,677 14,148,198
Other liabilities 50 3,786,445 3,786,445 3,786,445
Subordinated term debt 51 17,389,799 17,389,799 16,859,914
Total 56,693,304 299,160,586 355,853,890 354,483,915
As at 31 December 2020 Notes Level 1
LKR ’000
Level 2
LKR ’000
Level 3
LKR ’000
Fair value
LKR ’000
Carrying amount
LKR ’000
Group
Assets
Cash and cash equivalents 26 7,728,969 7,728,969 7,728,969
Balances with Central Bank of Sri Lanka 27 4,901,753 4,901,753 4,901,753
Placements with banks 28 15,431,962 15,431,962 15,431,962
Financial assets at amortised cost –
Loans to and receivables from banks
31 4,152,717 4,152,717 4,152,717
Financial assets at amortised cost – Loans to and receivables from other customers 32 295,969,708 295,969,708 301,909,337
Financial assets at amortised cost –
Debt and other instruments
33 18,412,228 13,221,152 31,633,380 31,604,175
Other assets 42 2,066,621 2,066,621 2,066,621
Total 18,412,228 45,436,553 298,036,329 361,885,110 367,795,534
Liabilities
Due to banks 44 14,909,937 14,909,937 14,909,937
Financial liabilities at amortised cost –
Due to depositors
45 303,948,217 303,948,217 309,566,423
Financial liabilities at amortised cost –
Due to other borrowers
46 46,847,076 46,847,076 46,847,076
Debt securities in issue 47 17,124,659 17,124,659 16,291,279
Other liabilities 50 4,900,958 4,900,958 4,900,958
Subordinated term debt 51 20,476,257 20,476,257 19,357,497
Total 52,510,853 355,696,251 408,207,104 411,873,170
As at 31 December 2019 Notes Level 1
LKR ’000
Level 2
LKR ’000
Level 3
LKR ’000
Fair value
LKR ’000
Carrying amount
LKR ’000
Assets
Cash and cash equivalents 26 5,459,359 5,459,359 5,459,359
Balances with Central Bank of Sri Lanka 27 8,666,547 8,666,547 8,666,547
Placements with banks 28 200,441 200,441 200,441
Financial assets at amortised cost - Loans to and receivables from banks 31
Financial assets at amortised cost - Loans to and receivables from other customers 32 269,198,868 269,198,868 272,818,311
Financial assets at amortised cost
Debt and other instruments
33 20,531,578 10,127,494 30,659,072 30,147,032
Other assets 42 2,238,053 2,238,053 2,238,053
Total 20,531,578 24,453,841 271,436,921 316,422,340 319,529,743
Liabilities
Due to banks 44 24,594,828 24,594,828 24,594,828
Financial liabilities at amortised cost –
Due to depositors
45 248,066,585 248,066,585 247,457,696
Financial liabilities at amortised cost –
Due to other borrowers
46 47,307,556 47,307,556 47,307,556
Debt securities in issue 47 14,708,677 14,708,677 14,148,198
Other liabilities 50 3,907,977 3,907,977 3,907,977
Subordinated term debt 51 17,389,799 17,389,799 16,859,914
Total 56,693,304 299,282,118 355,975,422 354,276,169

Given below is the basis adopted by the Bank/Group in order to establish the fair values of the financial instruments:

9.4.1 Cash and cash equivalents and placements with banks

Carrying amounts of cash and cash equivalents and placements with banks approximates their fair value as these balances have a remaining maturity of less than three months from the reporting date.

9.4.2 Loans to and receivables from banks and other customers – Lease rentals receivable

The estimated fair value of lease rentals receivable is the present value of future cash flows expected to be received from such finance lease facilities calculated based on current interest rates for similar type of facilities.

9.4.3 Loans to and receivables from banks and other customers – Other loans

Composition (%)
Floating rate loan portfolio 77
Fixed rate loans
– With remaining maturity less
than one year
9
– Others 14

Since the floating rate loans can be repriced monthly, quarterly and semi-annually in tandem with market rates fair value of these loans is approximately same as the carrying value. Carrying amount of fixed rate loans with a remaining maturity of less than one year approximates the fair value.

Based on the results of the fair value computed on the lease rentals receivable, it is estimated that the fair value of the other loans at fixed interest rates with maturity of more than one year is not materially different to its carrying value as at the reporting date.

9.4.4 Financial assets at amortised cost – Debt and other instruments

Fair value of the fixed rate debentures are based on prices quoted in the Colombo Stock Exchange, where there is an active market for quoted debentures.

Where there is no active market, fair value of the fixed rate debentures has been determined by discounting the future cash flows by the interest rates derived with reference to Government Treasury Bond rates with adjustments to risk premiums at the time of investment.

9.4.5 Due to banks

Carrying value of amounts due to banks approximates their fair value as these balances have a remaining maturity of less than one year from the reporting date.

9.4.6 Due to other customers

The carrying value of deposits with a remaining maturity of less than one year approximates the fair value.

Fair values of deposits with a remaining maturity of more than one year is estimated using discounted cash flows applying current interest rates offered for deposits of similar remaining maturities.

The fair value of a deposit repayable on demand is assumed to be the amount payable on demand at the reporting date and the savings account balances are repriced frequently
to match with the current market rates, therefore the demand and saving deposits carrying amounts are reasonable approximation to the fair values as at the reporting date.

9.4.7 Other borrowing

This consists of borrowings sourced from multilateral and bilateral institutions. 70% of these borrowing are repriced either monthly, quarterly or semi-annually and rates are revised in line with changes in market rates. Hence the carrying value of these borrowings approximates the fair value.

The others at fixed rates which relates to borrowings on credit lines are based on interest rates which are specific to each refinancing arrangement and as such there are no comparable market rates. Hence, the fair value approximates the carrying value.

9.4.8 Debt securities in issue

Debts issued comprise the USD notes issue and LKR debentures. Fair value of the USD notes are determined by reference to the bid and ask price quoted in the Singapore Stock Exchange. The LKR debentures are fair valued by reference to current Government Treasury Bond rates with a risk premium.

BANK GROUP
For the year ended 31 December 2020
LKR ’000
2019
LKR ’000
2020
LKR ’000
2019
LKR ’000
Interest income (Note 11.1.1) 39,089,986 42,060,055 39,095,445 42,062,054
Fee and commission income (Note 12.1.1) 2,193,474 2,165,314 2,192,557 2,162,006
Net gain/(loss) from trading (Note 13) 479,153 (87,116) 479,153 (87,116)
Net loss from financial instruments at
fair value through profit or loss (Note 14)
(497,931) (2,633,183) (497,931) (2,633,183)
Net gains from derecognition of financial assets (Note 15) 510,386 209,890 510,386 209,890
Net other operating income (Note 16) 1,524,732 1,582,055 1,824,837 1,934,636
43,299,800 43,297,015 43,604,447 43,648,287

Accounting Policy

Effective interest rate Interest income and expense are recognised in profit or loss using the effective interest method.

The “effective interest rate” is the rate that exactly discounts estimated future cash payments or receipts through the expected life of the financial instrument to:

  • the gross carrying amount of the financial asset; or
  • the amortised cost of the financial liability.

When calculating the effective interest rate for financial instruments other than purchased or originated creditimpaired assets, the Group estimates future cash flows considering all contractual terms of the financial instrument, but not ECL. For purchased or originated credit impaired financial assets, a credit-adjusted effective interest rate is calculated using estimated future cash flows including ECL.

The calculation of the effective interest rate includes transaction costs and fees and points paid or received that are an integral part of the effective interest rate. Transaction costs include incremental costs that are directly attributable to the acquisition or issue of a financial asset or financial liability.

Amortised cost and gross carrying amount
The “amortised cost” of a financial asset or financial liability is the amount at which the financial asset or financial liability is measured on initial recognition minus the principal repayments, plus or minus the cumulative amortisation using the effective interest method of any difference between that initial amount and the maturity
amount and, for financial assets, adjusted for any expected credit loss allowance. The “gross carrying amount of a financial asset” is the amortised cost of a financial asset before adjusting for any expected credit loss allowance.

Calculation of interest income and expense
The effective interest rate of a financial asset or financial liability is calculated on initial recognition of a financial asset or a financial liability. In calculating interest income and expense, the effective interest rate is applied to the gross carrying amount of the asset (when the asset is not credit impaired) or to the amortised cost of the liability. The effective interest rate is revised as a result of periodic re-estimation of cash flows of floating-rate instruments to reflect movements in market rates of interest. The effective interest rate is also revised for fair value hedge adjustments at the date on which amortisation of the hedge adjustment begins.

As per the internal risk management policies of the Bank, the facilities are considered to be credit impaired when three or more instalments are in arrears and the Bank has estimated that the probability of recoverability of the interest income from such loan facilities are low. Accordingly the Bank discontinues recognition of interest income on such loan facilities and cash flows are assessed based on the amortised cost net of interest. If the asset is no longer credit impaired the calculation of interest income reverts to the gross basis.

11.1 Composition

BANK GROUP
For the year ended 31 December 2020
LKR ’000
2019
LKR ’000
2020
LKR ’000
2019
LKR ’000
Interest income (Note 11.1.1) 39,089,986 42,060,055 39,095,445 42,062,054
Interest expenses (Note 11.1.2) (28,083,159) (29,397,598) (28,052,259) (29,363,105)
Net interest income 11,006,827 12,662,457 11,043,186 12,698,949

11.1.1 Interest income

BANK GROUP
For the year ended 31 December 2020
LKR ’000
2019
LKR ’000
2020
LKR ’000
2019
LKR ’000
Placements with banks 273,321 195,841 278,780 198,193
Financial assets measured at fair value
through profit or loss
2,969 12,105 2,969 12,105
Financial assets at amortised cost –
Loans to and receivables from banks
43,183 89,331 43,183 88,978
Financial assets at amortised cost –
Loans to and receivables from other customers
31,401,629 34,626,817 31,401,629 34,626,817
Financial assets at amortised cost –
Debt and other instruments
2,455,017 2,608,276 2,455,017 2,608,276
Financial assets measured at fair value
through other comprehensive income
4,913,867 4,527,685 4,913,867 4,527,685
Total interest income 39,089,986 42,060,055 39,095,445 42,062,054

Interest Income from Loans to and receivables from other customers includes modifications made to loans due to moratorium/debt concessionary schemes implemented by the Government/Bank as a measure to support the recovery of businesses/customers affected by COVID-19 pandemic.

11.1.2 Interest expenses

BANK GROUP
For the year ended 31 December 2020
LKR ’000
2019
LKR ’000
2020
LKR ’000
2019
LKR ’000
Due to banks 1,962,008 1,557,529 1,962,008 1,557,563
Financial liabilities at amortised cost –
Due to depositors
20,283,204 21,900,545 20,252,304 21,863,289
Financial liabilities at amortised cost –
Due to other borrowers
2,063,873 2,517,519 2,063,873 2,520,248
Debt securities in issued 3,774,074 3,422,005 3,774,074 3,422,005
Total interest expenses 28,083,159 29,397,598 28,052,259 29,363,105

The amounts reported above include interest income and expense, calculated using the effective interest method, that relate to the following financial assets and financial liabilities.

BANK GROUP
As at 31 December 2020
LKR ’000
2019
LKR ’000
2020
LKR ’000
2019
LKR ’000
Financial assets measured at amortised cost (Note 25) 367,706,038 319,395,696 367,795,534 319,529,743
Financial assets measured at FVOCI (Note 25) 88,718,002 72,716,407 88,718,002 72,716,407
Total 456,424,040 392,112,103 456,513,536 392,246,150
Financial liabilities measured at amortised cost (Note 25) 412,216,558 354,483,915 411,873,195 354,276,169

11.1.3 Interest income from Government Securities – Bank/Group

For the year ended 31 December 2020
LKR ’000
2019
LKR ’000
Financial assets measured at fair value through profit or loss 2,969 12,105
Financial assets at amortised cost – Loans to and receivables from banks 43,183 89,331
Financial assets at amortised cost – Debt and other instruments 2,302,655 2,302,523
Financial assets measured at fair value through other comprehensive income 4,913,867 4,527,685
7,262,674 6,931,644

Accounting Policy

Fee and commission income and expense that are integral to the effective interest rate on a financial asset or liability are included in the measurement of the effective interest rate.

Other Fees and commission income are recognised as the related services are performed. When a loan commitment is not expected to result in the draw down of a loan, the related loan commitment fees are recognised on a straight-line basis over the commitment period.

A contract with a customer that results in a recognised financial instrument in the Group’s financial statements may be partially in the scope of SLFRS 9 and partially in the scope of SLFRS 15. If this is the case, then the Group first applies SLFRS 9 to separate and measure the part of the contract that is in the scope of SLFRS 9 and then applies SLFRS 15 to the residual.

Fees for guarantees and trade related commissions are recognised on a straight-line basis over the period of the contract. Fees and commission expense relate mainly to transaction and service fees, which are expensed, as the services are received.

12.1 Composition

BANK GROUP
For the year ended 31 December 2020
LKR ’000
2019
LKR ’000
2020
LKR ’000
2019
LKR ’000
Fee and commission income (Note 12.1.1) 2,193,474 2,165,314 2,192,557 2,162,006
Fee and commission expenses (132,157) (119,603) (132,157) (119,603)
Net fee and commission income 2,061,317 2,045,711 2,060,400 2,042,403

12.1.1 Disaggregation of fee and commission income

In the following table, fee and commission income from contracts with customers in the scope of SLFRS 15 is disaggregated by major type of services.

Major service lines

BANK GROUP
For the year ended 31 December 2020
LKR ’000
2019
LKR ’000
2020
LKR ’000
2019
LKR ’000
Loans and advances 887,024 812,655 887,024 812,655
Credit cards 192,228 115,454 192,228 115,454
Trade and remittances 551,999 544,193 551,999 544,193
Customer accounts 231,336 412,037 231,336 412,037
Guarantees 296,110 268,312 296,110 268,312
Others (Management, consulting, and other fees) 34,777 12,663 33,860 9,355
Fee and commission income 2,193,474 2,165,314 2,192,557 2,162,006

Fee and commission income in 2020 was primarily driven by lower levels of consumer spending resulting from COVID-19, which crystallised in the form of lower interchange income, international payments, foreign exchange and ATM reciprocity.

12.1.2 Performance obligations and revenue recognition policies

Fee and commission income from contracts with customers is measured based on the consideration specified in a contract with a customer. The Group recognises revenue when it transfers control over a service to a customer.

The following table provides information about the nature and timing of the satisfaction of performance obligations in contracts with customers, including significant payment terms, and the related revenue recognition policies.

Type of service Nature and timing of satisfaction of performance obligations,
including significant payment terms
Revenue recognition under SLFRS 15
Retail and corporate banking service The Group provides banking services to retail and corporate customers, including account management, provision of overdraft facilities, foreign currency transactions, credit card, and servicing fees. Revenue from account service and servicing fees is recognised over time as the services are provided.
Fees for ongoing account management are charged to the customer’s account on a monthly basis. The Group sets the rates separately for retail and corporate banking customers in each jurisdiction on an annual basis. Revenue related to transactions is recognised at the point in time when the transaction takes place.
Transaction-based fees for interchange, foreign currency transactions, and overdrafts are charged to the customer’s account when the transaction takes place.
Servicing fees are charged on a monthly basis and are based on fixed rates reviewed annually by the Group.

Accounting Policy

Results arising from trading activities include all gains and losses from realised and unrealised fair value changes, related capital gains and losses, dividend income from trading assets and trading liabilities and foreign exchange differences.

BANK GROUP
For the year ended 31 December 2020
LKR ’000
2019
LKR ’000
2020
LKR ’000
2019
LKR ’000
Foreign exchange from banks 387,113 538,838 387,113 538,838
Government Securities
Net capital gain 8,303 21,072 8,303 21,072
Equities
Net marked to market gain/(loss) 11,069 (919,614) 11,069 (919,614)
Net capital gain 71,153 7,912 71,153 7,912
Dividend income 1,515 264,676 1,515 264,676
479,153 (87,116) 479,153 (87,116)

Accounting Policy

The Bank has non-trading derivatives held for risk management purposes (e.g. forward foreign exchange purchase or sale contracts) that do not form part of qualifying hedge relationship, that are mandatorily fair valued through profit or loss. In respect of such financial instruments, all unrealised fair value changes and foreign exchange differences are included.

14.1 Net loss from financial instruments mandatorily measured at FVTPL other than those included in “net trading income”

BANK GROUP
For the year ended 31 December 2020
LKR ’000
2019
LKR ’000
2020
LKR ’000
2019
LKR ’000
Forward exchange fair value changes
Contracts with commercial banks (543,169) (2,578,178) (543,169) (2,578,178)
Gain/(loss) on financial assets fair value through
profit or loss on equity securities
45,238 (48,042) 45,238 (48,042)
Interest rate swap fair value changes (6,963) (6,963)
(497,931) (2,633,183) (497,931) (2,633,183)

Forward exchange fair value changes on contracts with commercial banks includes the unrealised gain/(loss) on derivatives carried for risk management purposes, after netting off the spot movement arising from the long-term foreign currency liabilities designated as hedge item as per the fair value hedge applied by the Bank (Note 29.2). The Bank has applied the fair value hedge accounting for a part of its foreign currency liabilities using forward contracts.

Accounting Policy

“Net gains from derecognition of financial assets” comprised realised gains less losses related to debt instruments measured at FVOCI and financial assets measured at amortised cost and FVTPL as per SLFRS 9.

BANK GROUP
For the year ended 31 December 2020
LKR ’000
2019
LKR ’000
2020
LKR ’000
2019
LKR ’000
Fair value through profit or loss Gain on sale of equity securities 5,102 99,040 5,102 99,040
Fair value through other comprehensive income Gain on sale of Government Securities 505,284 110,850 505,284 110,850
510,386 209,890 510,386 209,890

Accounting Policy

Net other operating income includes realised gain or loss on sale of fair value through other comprehensive income securities (e.g. Treasury Bills and Bonds, and dividend income from ordinary shares classified as fair value through other comprehensive income financial assets, dividend income from group entities, rental income, gains on disposal of property, plant and equipment and foreign exchange gains and losses.

Rental income

Rental income and expenses are accounted on a straight-line basis over the entire period of the tenancy incorporating predetermined rent escalation during the period of the tenancy.

Dividend income

Dividend income is recognised when the right to receive payment is established. Dividend income are presented in net gain/(loss) from trading and net other income, net based on underlying classification of the equity investment. Where the dividend clearly represents a recovery of part of the cost of the investment, it is presented in other comprehensive income. Dividend income from subsidiaries and joint venture is recognised when the Bank’s right to receive the dividend is established.

Gains and losses on disposal of assets

Net gains and losses of a revenue nature arising from the disposal of property, plant and equipment and other non-current assets including investments in subsidiaries, joint venture and associate are accounted for, in the statement of profit or loss after deducting from the proceeds on disposal, the carrying amount of such assets and the related selling expenses.


Foreign exchange gain/(loss)


Foreign currency positions are revalued at each reporting date. Gains and losses arising from changes in fair value are included in the income statement in the period in which they arise.

BANK GROUP
For the year ended 31 December 2020
LKR ’000
2019
LKR ’000
2020
LKR ’000
2019
LKR ’000
Financial assets measured at fair value through other comprehensive income
Loss on sale of equity securities (17) (17)
Dividend income 742,511 526,276 742,511 526,276
Equities measured at fair value through profit or loss
Dividend income 125 125
Dividend income from subsidiaries, joint venture, and associate 139,277 152,376
Net gain from repurchase transactions 549,618 351,895 549,618 351,895
Premises rental income 23,344 293,668 317,722
Gain on sale of property, plant and equipment 13,708 33,494 23,240 33,494
Foreign exchange gains 23,292 474,203 23,292 474,203
Recovery of loans written-off 42,021 7,601 42,021 9,052
Others 14,322 12,741 150,504 221,869
1,524,732 1,582,055 1,824,837 1,934,636

Accounting Policy

The Group recognises loss allowances for ECL on the following financial instruments that are not measured at FVTPL:

  • financial assets that are debt instruments;
  • lease receivables;
  • financial guarantee contracts issued; and
  • loan commitments issued.

No impairment loss is recognised on equity investments.

The Group measures loss allowances at an amount equal to lifetime ECL, except for the following, for which they are measured as 12-month ECL:

  • debt investment securities that are determined to have low credit risk at the reporting date; and
  • other financial instruments on which credit risk has not increased significantly since their initial recognition.

The Group considers a debt investment security to have low credit risk when its credit risk rating is equivalent to the globally understood definition of “investment grade”. The Group does not apply the low credit risk exemption to any other financial instruments.

Individually assessed loans and advances and held-to-maturity debt instruments

These are exposures, where evidence of impairment exists and those that are individually significant meriting individual assessment for objective evidence of impairment and computation of impairment allowance. The factors considered in determining that the exposures are individually significant include –

  • the size of the loan; and
  • the number of loans in the portfolio.

For all loans and held-to-maturity debt instruments that are considered individually significant, Bank assesses on a case-by-case basis, whether there is any objective evidence of impairment. The criteria used by the Bank to determine that there is such objective evident include –

  • Significant financial difficulty of the borrower or issuer;
  • A breach of contract such as a default or past due event;
  • The restructuring of a loan or advance by the Bank on terms that the Bank would not consider otherwise;
  • It is becoming probable that the borrower will enter bankruptcy or other financial reorganisation; or
  • The disappearance of an active market for a security because of financial difficulties.

A loan that has been renegotiated due to a deterioration in the borrower’s condition is usually considered to be credit-impaired unless there is evidence that the risk of not receiving contractual cash flows has reduced significantly and there are no other indicators of impairment. In addition, a retail loan that is overdue for 90 days or more is considered impaired.

Impairment allowance on loans and advances and other financial instruments measured at amortised cost are calculated as the difference between the carrying amount and the present value of estimated future cash flows discounted at the asset’s original effective interest rate.

Collective assessment

This includes all loans and advances of smaller value where there is no evidence of impairment and those individually assessed for which no evidence of impairment has been specifically identified on an individual basis.

These loans and advances are grouped together as per Basel Guidelines and product level according to their credit risk characteristics for the purpose of calculating an estimated collective impairment.

In making an assessment of whether an investment in debt instrument is credit-impaired, the Bank considers the following factors:

  • The market’s assessment of creditworthiness as reflected in the bond yields.
  • The rating agencies’ assessments of creditworthiness.
  • The country’s ability to access the capital markets for new debt issuance.
  • The probability of debt being restructured, resulting in holders suffering losses through voluntary or mandatory debt forgiveness.
  • The international support mechanisms in place to provide the necessary support as “lender of last resort” to that country, as well as the intention, reflected in public statements, of governments and agencies to use those mechanisms. This includes an assessment of the depth of those mechanisms and, irrespective of the political intent, whether there is the capacity to fulfil the required criteria.

The Bank manages credit quality using a three stage approach which is in line with SLFRS 9.

12-month ECL are the portion of lifetime ECL that result from default events on a financial instrument that are possible within the 12 months after the reporting date. Financial instruments for which 12-month ECL are recognised are referred to as “Stage 1 financial instruments”. Financial instruments allocated to Stage 1 have not undergone a significant increase in credit risk since initial recognition and are not credit-impaired.

Lifetime ECL are the ECL that result from all possible default events over the expected life of the financial instrument or the maximum contractual period of exposure. Financial instruments for which lifetime ECL are recognised but that are not credit-impaired are referred to as “Stage 2 financial instruments”. Financial instruments allocated to Stage 2 are those that have experienced a significant increase in credit risk since initial recognition but are not credit-impaired.

Financial instruments for which lifetime ECL are recognised and that are credit-impaired are referred to as “Stage 3 financial instruments”.

Significant increase in credit risk

When determining whether the risk of default on a financial instrument has increased significantly since initial recognition, the Bank considers reasonable and supportable information that is relevant and available without undue cost or effort. This includes both quantitative and qualitative information and analysis, based on the Bank’s historical experience and expert credit assessment and including forward-looking information.

The objective of the assessment is to identify whether a significant increase in credit risk has occurred for an exposure by comparing:

  • the remaining lifetime probability of default (PD) as at the reporting date; with
  • the remaining lifetime PD for this point in time that was estimated at the time of initial recognition of the exposure (adjusted where appropriate for changes in prepayment expectations).

The Bank uses three criteria for determining whether there has been a significant increase in credit risk:

  • a quantitative test based on movement in PD;
  • qualitative indicators; and
  • a backstop of 30 days past due, except for, which a backstop of 60 days past due is applied.

COVID-19 initiatives

For facilities subject to the COVID-19 repayment deferral arrangements, an assessment of Significant Increase in Credit Risk (SICR) has been determined based on various measures of the customer’s current financial position, future earnings capacity and the sectors in which the customers operate from which the facilities are categorised into risk categories. SICR is then determined based on the resulting risk categorisation. Based on the risk categorisation, facilities have been stress tested and required allowance overlays have been made.

Generating the term structure of PD

The Bank collects performance and default information about its credit risk exposures analysed by jurisdiction or region and by type of product and borrower as well as by credit risk grading. For some portfolios, information purchased from external credit reference agencies is also used.

The Bank employs statistical models to analyse the data collected and generate estimates of the remaining lifetime PD of exposures and how these are expected to change as a result of the passage of time.

Determining whether credit risk has increased significantly

The Bank assesses whether credit risk has increased significantly since initial recognition at each reporting date.

Credit risk may also be deemed to have increased significantly since initial recognition based on qualitative factors linked to the Bank’s credit risk management processes that may not otherwise be fully reflected in its quantitative analysis on a timely basis. This will be the case for exposures that meet certain heightened risk criteria, such as placement on a watch list. Such qualitative factors are based on its expert judgement and relevant historical experiences.

As a backstop, the Bank considers that a significant increase in credit risk occurs no later than when an asset is more than 30 days past due. Days past due are determined by counting the number of days since the earliest elapsed due date in respect of which full payment has not been received. Due dates are determined without considering any grace period that might be available to the borrower.

If there is evidence that there is no longer a significant increase in credit risk relative to initial recognition, then the loss allowance on an instrument returns to being measured at 12-month ECL.

The Bank monitors the effectiveness of the criteria used to identify significant increases in credit risk by regular reviews to confirm that:

  • the criteria are capable of identifying significant increases in credit risk before an exposure is in default;
  • the criteria do not align with the point in time when an asset becomes 30 days past due; except for, for which a backstop of 60 days past due is applied.
  • the average time between the identification of a significant increase in credit risk and default appears reasonable;
  • exposures are not generally transferred directly from 12-month ECL measurement to credit impaired; and
  • there is no unwarranted volatility in loss allowance from transfers between 12-month PD (Stage 1) and lifetime PD (Stage 2).

Definition of default

The Bank considers a financial asset to be in default when:

  • the borrower is unlikely to pay its credit obligations to the Bank in full, without recourse by the Bank to actions such as realising security (if any is held); or
  • the borrower is more than 90 days past due on any material credit obligation to the Bank.
  • the assessment of the external rating agencies indicates a default grading of the borrower; or
  • all credit facilities listed in 1.3 of Annex 1 of the Directive No. 04 of 2018 issued by Central Bank of Sri Lanka on adoption of Sri Lanka Accounting Standard – SLFRS 9 on “Financial Instruments”

In assessing whether a borrower is in default, the Bank considers indicators that are:

  • qualitative – e.g. breaches of covenant;
  • quantitative – e.g. overdue status and non-payment on another obligation of the same issuer to the Bank; and
  • based on data developed internally and obtained from external sources

Inputs into the assessment of whether a financial instrument is in default and their significance may vary over time to reflect changes in circumstances. The definition of default largely aligns with that applied by the Bank for regulatory capital purposes.

Incorporation of forward-looking information

The Bank incorporates forward-looking information into both its assessment of whether the credit risk of an instrument has increased significantly since its initial recognition and its measurement of ECL using a variety of external actual and forecasted information.

The Bank formulates a base case view of the future direction of relevant economic variables as well as a representative range (Best Case and Worst Case) of other possible forecast scenarios.

This process involves developing two or more additional economic scenarios and considering the relative probabilities of each outcome. External information includes economic data and forecasts published by both local and international sources. The base case represents a most-likely outcome. The other scenarios represent more optimistic and more pessimistic outcomes.

The Bank has identified and documented key drivers of credit risk and credit losses for each portfolio of financial instruments and, using an analysis of historical data, has estimated relationships between macroeconomic variables credit risk and credit losses.

The economic variables used by the Bank based on the statistical significance include the followings:

Unemployment rate

Base case scenario along with two other scenarios has been used (Best Case and Worst Case)

Interest rate

GDP growth rate

Inflation rate

Exchange rate

Modified financial assets

The contractual terms of a loan may be modified for a number of reasons, including changing market conditions, customer retention and other factors not related to a current or potential credit deterioration of the customer. An existing loan whose terms have been modified may be derecognised and the renegotiated loan recognised as a new loan at fair value in accordance with the accounting policy set out in Note 5.3.4.

When the terms of a financial asset are modified and the modification does not result in derecognition, the determination of whether the asset’s credit risk has increased significantly reflects comparison of:

  • its remaining lifetime PD at the reporting date based on the modified terms; with
  • the remaining lifetime PD estimated based on data on initial recognition and the original contractual terms.

When modification results in derecognition, a new loan is recognised and allocated to Stage 1 (assuming it is not credit-impaired at that time).

The Bank renegotiates loans to customers in financial difficulties (referred to as “forbearance activities”) to maximise collection opportunities and minimise the risk of default. Under the Bank’s forbearance policy, loan forbearance is granted on a selective basis if the debtor is currently in default on its debt or if there is a high risk of default, there is evidence that the debtor made all reasonable efforts to pay under the original contractual terms and the debtor is expected to be able to meet the revised terms.

The revised terms usually include extending the maturity, changing the timing of interest payments and amending the terms of loan covenants. Both retail and corporate loans are subject to the forbearance policy. The Bank’s Credit Committee regularly reviews reports on forbearance activities.

For financial assets modified as part of the Bank’s forbearance policy, the estimate of PD reflects whether the modification has improved or restored the Bank’s ability to collect interest and principal and the Bank’s previous experience of similar forbearance action. As part of this process, the Bank evaluates the borrower’s payment performance against the modified contractual terms and considers various behavioural indicators.

Generally, forbearance is a qualitative indicator of a significant increase in credit risk and an expectation of forbearance may constitute evidence that an exposure is credit-impaired. A customer needs to demonstrate consistently good payment behaviour over a period of time before the exposure is no longer considered to be credit-impaired/in default or the PD is considered to have decreased such that it falls within the 12-month PD ranges for the asset to be considered Stage 1.

Measurement of ECL

ECL are a probability-weighted estimate of credit losses. They are measured as follows:

  • financial assets that are not credit-impaired at the reporting date: as the present value of all cash shortfalls (i.e. the difference between the cash flows due to the entity in accordance with the contract and the cash flows that the Group expects to receive);
  • financial assets that are credit-impaired at the reporting date: as the difference between the gross carrying amount and the present value of estimated future cash flows;
  • undrawn loan commitments: as the present value of the difference between the contractual cash flows that are due to the Group if the commitment is drawn down and the cash flows that the Group expects to receive; and
  • financial guarantee contracts: the expected payments to reimburse the holder less any amounts that the Group expects to recover.

When discounting future cash flows, the following discount rates are used:

  • financial assets other than purchased or originated credit-impaired (POCI) financial assets and lease receivables: the original effective interest rate or an approximation thereof;
  • POCI assets: a credit-adjusted effective interest rate;
  • lease receivables: the discount rate used in measuring the lease receivable;
  • undrawn loan commitments: the effective interest rate, or an approximation thereof, that will be applied to the financial asset resulting from the loan commitment; and
  • financial guarantee contracts issued: the rate that reflects the current market assessment of the time value of money and the risks that are specific to the cash flows.

The key inputs into the measurement of ECL are the term structure of the following variables:

  • Probability of default (PD);
  • Loss given default (LGD);
  • Exposure at default (EAD).

ECL for exposures in Stage 1 are calculated by multiplying the 12-month PD by LGD and EAD.

Lifetime ECL are calculated by multiplying the lifetime PD by LGD and EAD.

The methodology for estimating PDs is discussed above under the heading “Generating the term structure of PD”.

LGD is the magnitude of the likely loss if there is a default. The Bank estimates LGD parameters based on the history of recovery rates of claims against defaulted counterparties. The LGD models consider the structure, collateral, seniority of the claim, counterparty industry and recovery. Costs of any collateral that is integral to the financial asset. For loans secured by retail property, loan to value (LTV) ratios are a key parameter in determining LGD. LGD estimates are recalibrated for different economic scenarios and, for lending collateralised by property, to reflect possible changes in property prices. They are calculated on a discounted cash flow basis using the effective interest rate as the discounting factor.

EAD represents the expected exposure in the event of a default. The Bank derives the EAD from the current exposure to the counterparty and potential changes to the current amount allowed under the contract and arising from amortisation. The EAD of a financial asset is its gross carrying amount at the time of default. For lending commitments, the EADs are potential future amounts that may be drawn under the contract, which are estimated based on historical observations and forward-looking forecasts. For financial guarantees, the EAD represents the amount of the guaranteed exposure when the financial guarantee becomes payable. For some financial assets, EAD is determined by modelling the range of possible exposure outcomes at various points in time using scenario and statistical techniques.

As described above, and subject to using a maximum of a 12-month PD for Stage 1 financial assets, the Bank measures ECL considering the risk of default over the maximum contractual period (including any borrower’s extension options) over which it is exposed to credit risk, even if, for credit risk management purposes, the Bank considers a longer period. The maximum contractual period extends to the date at which the Bank has the right to require repayment of an advance or terminate a loan commitment or guarantee.

Where modelling of a parameter is carried out on a collective basis, the financial instruments are banked on the basis of shared risk characteristics, which may include:

  • instrument type;
  • credit risk grade;
  • collateral type;
  • LTV ratio for retail mortgages;
  • date of initial recognition;
  • remaining term to maturity;
  • industry; and
  • geographic location of the borrower.

The bankings are subject to regular review to ensure that exposures within a particular bank remain appropriately homogeneous.

Restructured financial assets

If the terms of a financial asset are renegotiated or modified or an existing financial asset is replaced with a new one due to financial difficulties of the borrower, then an assessment is made of whether the financial asset should be derecognised and ECL are measured as follows:

  • If the expected restructuring will not result in derecognition of the existing asset, then the expected cash flows arising from the modified financial asset are included in calculating the cash shortfalls from the existing asset.
  • If the expected restructuring will result in derecognition of the existing asset, then the expected fair value of the new asset is treated as the final cash flow from the existing financial asset at the time of its derecognition. This amount is included in calculating the cash shortfalls from the existing financial asset that are discounted from the expected date of derecognition to the reporting date using the original effective interest rate of the existing financial asset.

Purchase of credit-impaired (POCI) financial assets

POCI financial assets are assets that are credit-impaired on initial recognition. For POCI assets, lifetime ECL are incorporated into the calculation of the effective interest rate on initial recognition.

Consequently, POCI assets do not carry an impairment allowance on initial recognition. The amount recognised as a loss allowance subsequent to initial recognition is equal to the changes in lifetime ECL since initial recognition of the asset.

Write-off

Loans and debt securities are written off (either partially or in full) when there is no reasonable expectation of recovering a financial asset in its entirety or a portion thereof. This is generally the case when the Group determines that the borrower does not have assets or sources of income that could generate sufficient cash flows to repay the amounts subject to the write-off. This assessment is carried out at the individual asset level.

Reversals of impairment

If the amount of an impairment loss decreases in a subsequent period, and the decrease can be related objectively to an event occurring after the impairment was recognised, the excess is written back by reducing the loan impairment allowance accordingly. The write-back is recognised in the income statement.

Renegotiated loans

Loans subject to collective impairment assessment whose terms have been renegotiated are no longer considered past due, but are treated as up-to-date loans for measurement purposes once a minimum number of payments required have been received.

Loans subject to individual impairment assessment, whose terms have been renegotiated, are subject to ongoing review to determine whether they remain impaired. The carrying amounts of loans that have been classified as renegotiated retain this classification until maturity or derecognition.

Financial guarantee contracts held

The Group assesses whether a financial guarantee contract held is an integral element of a financial asset that is accounted for as a component of that instrument or is a contract that is accounted for separately. The factors that the Group considers when making this assessment

  • the guarantee is implicitly part of the contractual terms of the debt instrument;
  • the guarantee is required by laws and regulations that govern the contract of the debt instrument;
  • the guarantee is entered into at the same time as and in contemplation of the debt instrument; and
  • the guarantee is given by the parent of the borrower or another company within the borrower’s group.

If the Group determines that the guarantee is an integral element of the financial asset, then any premium payable in connection with the initial recognition of the financial asset is treated as a transaction cost of acquiring it. The Group considers the effect of the protection when measuring the fair value of the debt instrument and when measuring ECL.

If the Group determines that the guarantee is not an integral element of the debt instrument, then it recognises an asset representing any prepayment of guarantee premium and a right to compensation for credit losses. A prepaid premium asset is recognised only if the guaranteed exposure neither is credit-impaired nor has undergone a significant increase in credit risk when the guarantee is acquired. These assets are recognised in “other assets”. The Group presents gains or losses on a compensation right in profit or loss in the line item “impairment losses on financial instruments”.

Presentation of allowance for ECL in the statement of financial position loss allowances for ECL are presented in the statement of financial position as follows:

  • financial assets measured at amortised cost: as a deduction from the gross carrying amount of the assets;
  • loan commitments and financial guarantee contracts: generally, as a provision;
  • where a financial instrument includes both a drawn and an undrawn component, and the Group cannot identify the ECL on the loan commitment component separately from those on the drawn component: the Group presents a combined loss allowance for both components. The combined amount is presented as a deduction from the gross carrying amount of the drawn component. Any excess of the loss allowance over the gross amount of the drawn component is presented as a provision; and
  • debt instruments measured at FVOCI: no loss allowance is recognised in the statement of financial position because the carrying amount of these assets is their fair value. However, the loss allowance is disclosed and is recognised in fair value reserve.

Regulation issued by Central Bank of Sri Lanka (“CBSL”)

During the year the CBSL issued various circulars after the outbreak of COVID-19 relating to moratorium/debt relief/credit support to customers and industries schemes offered by the Government to support recovery of the economy. These circulars had/expected to hae impact on Recognition of Interest Income, stage-wise classification of facilities and computation of expected credit loss.

Composition

BANK GROUP
For the year ended 31 December 2020
LKR ’000
2019
LKR ’000
2020
LKR ’000
2019
LKR ’000
Financial assets at amortised cost –
Loans to and receivables from other customers
2,940,811 1,590,392 2,940,811 1,590,392
Financial assets at amortised cost –
Debt and other instruments
121,713 37,157 121,713 37,157
Financial assets measured at fair value
through other comprehensive income
73,699 14,384 73,699 14,384
Loan commitments 176,259 (16,950) 176,259 (16,950)
Other debts 11,927 63,483 11,927 63,483
Investment in subsidiaries (30,000) (20,400)
Write-offs – Loans to and receivables from other customers 3,483 847 3,483 847
3,297,892 1,668,913 3,327,892 1,689,313

Impairment charge to the income statement

For the year ended 31 December 2020 Note Stage 1
LKR ’000
Stage 2
LKR ’000
Stage 3
LKR ’000
Total
LKR ’000
Financial assets at amortised cost –
Loans to and receivables from other customers
32.1.4 404,581 (494,452) 3,030,682 2,940,811
Financial assets at amortised cost –
Debt and other instruments
33.3 121,713 121,713
Financial assets measured at fair
value through other comprehensive income
34.7 73,699 73,699
Loan commitments 57.1.1 179,454 (3,195) 176,259
779,447 (497,647) 3,030,682 3,312,482
Other debts 11,927
Investment in subsidiaries 35.1 (30,000)
Write-offs – Loans to and receivables
from other customers
3,483
Total impairment charge – Bank 3,297,892
Adjustment for investment in subsidiaries 30,000
Total impairment charge – Group 3,327,892
For the year ended 31 December 2019 Note Stage 1
LKR ’000
Stage 2
LKR ’000
Stage 3
LKR ’000
Total
LKR ’000
Financial assets at amortised cost –
Loans to and receivables from other customers
32.1.4 116,321 (790,380) 2,264,451 1,590,392
Financial assets at amortised cost –
Debt and other instruments
33.3 37,157 37,157
Financial assets measured at fair value
through other comprehensive income
34.7 14,384 14,384
Contingent liabilities and commitments 57.1.1 1,458 (18,408) (16,950)
169,320 (808,788) 2,264,451 1,624,983
Other debts 63,483
Investment in subsidiaries 35.1 (20,400)
Write-offs – Loans to and receivables
from other customers
847
Total impairment charge – Bank 1,668,913
Adjustment for investment in subsidiaries 20,400
Total impairment charge – Group 1,689,313

Accounting Policy

Accounting Polices in Note 48.

Short-term employee benefits
Short-term employee benefits are expensed as the related service is provided. A liability is recognised for the amount expected to be paid if the Group has a present legal or constructive obligation to pay this amount as a result of past service provided by the employee and the obligation can be estimated reliably.

18.1 Composition

Note BANK GROUP
For the year ended 31 December 2020
LKR ’000
2019
LKR ’000
2020
LKR ’000
2019
LKR ’000
Salaries and other benefits 2,843,658 3,210,136 3,005,722 3,352,556
Contributions to defined benefit plans 18.1.1 199,187 171,890 205,142 178,206
Contributions to defined contribution plans 18.1.2 356,859 342,381 377,308 363,972
3,399,704 3,724,407 3,588,172 3,894,734

18.1.1 Contributions to defined benefit plans

BANK GROUP
For the year ended 31 December 2020
LKR ’000
2019
LKR ’000
2020
LKR ’000
2019
LKR ’000
Funded pension liability
Current service cost
53,864 54,839 53,864 54,839
Interest on obligation 259,439 250,331 259,439 250,331
Expected return on pension assets (248,700) (240,353) (248,700) (240,353)
64,603 64,817 64,603 64,817
Unfunded pension liability
Interest on obligation
5,625 5,678 5,625 5,678
5,625 5,678 5,625 5,678
Unfunded end of service gratuity liability Current service cost 78,850 66,582 82,804 71,027
Interest on obligation 50,109 34,813 52,110 36,684
128,959 101,395 134,914 107,711
Total defined benefit plans 199,187 171,890 205,142 178,206

18.1.2 Contributions to defined contribution plans

BANK GROUP
For the year ended 31 December 2020
LKR ’000
2019
LKR ’000
2020
LKR ’000
2019
LKR ’000
Employer’s contribution to Employees’ Provident Fund 297,383 285,205 313,846 302,613
Employer’s contribution to Employees’ Trust Fund 59,476 57,176 63,462 61,359
Total defined contribution plans 356,859 342,381 377,308 363,972

See accounting policy in Note 39 and 40.

Note BANK GROUP
For the year ended 31 December 2020
LKR ’000
2019
LKR ’000
2020
LKR ’000
2019
LKR ’000
Depreciation
Investment property 38 21,057 28,836
Property, plant and equipment 39 383,461 341,764 407,669 364,112
Right-of-use assets 39 292,457 282,313 292,757 284,113
Amortisation
Intangible assets 40 243,739 219,579 249,475 224,349
919,657 843,656 970,958 901,410

Accounting Policy

Expenses are recognised in the income statement on the basis of a direct association between the cost incurred and the earning of specific items of income. All expenditure incurred in the running of the business and in maintaining the property, plant and equipment in a state of efficiency has been charged to the income statement.

BANK GROUP
For the year ended 31 December 2020
LKR ’000
2019
LKR ’000
2020
LKR ’000
2019
LKR ’000
Directors’ emoluments 17,445 20,595 18,001 21,075
Auditors’ remuneration
Audit fees and expenses 4,700 5,424 5,520 6,231
Audit related fees and expenses 2,737 1,477 2,940 1,697
Fees for non-audit services 520 1,840 612 1,938
Professional and legal expenses 21,455 22,723 21,455 22,723
Premises, equipment and establishment expenses 1,662,756 1,521,317 1,662,756 1,521,317
Other overhead expenses 1,357,616 1,431,735 1,284,062 1,439,520
3,067,229 3,005,111 2,995,346 3,014,501

Directors emoluments include fees paid to Non-Executive Directors Remuneration paid to Executive Directors are included under salaries and other benefits in Note 18.1.

Accounting Policy

Value Added Tax on financial services (VAT)

VAT on financial services is calculated in accordance with Value Added Tax Act No. 14 of 2002 and subsequent amendments thereto.

The value base for computation of VAT is the operating profit before taxes on financial services adjusted for emoluments of employees and depreciation computed as per prescribed rates.

Nation Building Tax on financial services (NBT)

NBT on financial services is calculated in accordance with Nation Building Tax Act No. 09 of 2009 and subsequent amendments thereto. NBT is chargeable on the same base used for calculation of VAT on financial services. NBT has been removed with effect from 1 December 2019.

Debt Repayment Levy on financial services (DRL)

With effect from 1 October 2018, DRL of 7% was introduced on the value addition attributable to the supply of financial services through an amendment to the Finance Act No. 35
of 2018. DRL is chargeable on the same base used for calculation of VAT on financial services before deducting the VAT and NBT on financial services. This levy has been removed with effect from 1 January 2020.

21.1 Composition

BANK GROUP
For the year ended 31 December 2020
LKR ’000
2019
LKR ’000
2020
LKR ’000
2019
LKR ’000
Value Added Tax on financial services (Note 21.1.1) 1,015,574 963,734 1,015,574 963,734
Nation Building Tax on financial services (Note 21.1.2) (11,611) 131,607 (11,611) 131,607
Debt Repayment Levy (Note 21.1.3) (2,401) 453,121 (2,401) 453,121
Total 1,001,562 1,548,462 1,001,562 1,548,462

21.1.1 Value Added Tax on financial services

BANK GROUP
For the year ended 31 December 2020
LKR ’000
2019
LKR ’000
2020
LKR ’000
2019
LKR ’000
Current year 997,315 950,588 997,315 950,588
Under provision in respect of previous year 18,259 13,146 18,259 13,146
1,015,574 963,734 1,015,574 963,734

21.1.2 Nation Building Tax on financial services

BANK GROUP
For the year ended 31 December 2020
LKR ’000
2019
LKR ’000
2020
LKR ’000
2019
LKR ’000
Current year 129,854 129,854
Over provision in respect of previous year (11,611) 1,753 (11,611) 1,753
(11,611) 131,607 (11,611) 131,607

21.1.3 Debt Repayment Levy

BANK GROUP
For the year ended 31 December 2020
LKR ’000
2019
LKR ’000
2020
LKR ’000
2019
LKR ’000
Current year 557,044 557,044
Over provision in respect of previous year (2,401) (103,923) (2,401) (103,923)
(2,401) 453,121 (2,401) 453,121

Accounting Policy

Income tax expense comprises current and deferred tax. It is recognised in profit or loss except to the extent that it relates to a business combination, or items recognised directly in equity or in OCI.

The Group has determined that interest and penalties related to income taxes, including uncertain tax treatments, do not meet the definition of income taxes, and therefore accounted for them under LKAS 37 Provisions, Contingent Liabilities and Contingent Assets.

Current taxation

Current tax comprises the expected tax payable or receivable on the taxable income or loss for the year and any adjustment to the tax payable or receivable in respect of previous years. The amount of current tax payable or receivable is the best estimate of the tax amount expected to be paid or received that reflects uncertainty related to income taxes, if any. It is measured using tax rates enacted or substantively enacted at the reporting date. Current tax also includes any tax arising from dividends.

Taxable profit is determined in accordance with the provisions of Inland Revenue Act No 24 of 2017.

Current tax assets and liabilities are offset only if certain criteria are met.

Deferred taxation

Deferred tax is recognised in respect of temporary differences between the carrying amounts of assets and liabilities for financial reporting purposes and the amounts used for taxation purposes. Deferred tax is not recognised for:

  • temporary differences on the initial recognition of assets or liabilities in a transaction that is not a business combination and that affects neither accounting nor taxable profit or loss;
  • temporary differences related to investments in subsidiaries, associates and joint arrangements to the extent that the Group is able to control the timing of the reversal of the temporary differences and it is probable that they will not reverse in the foreseeable future; and
  • taxable temporary differences arising on the initial recognition of goodwill.

Deferred tax assets are recognised for unused tax losses, unused tax credits and deductible temporary differences to the extent that it is probable that future taxable profits will be available against which they can be used. Future taxable profits are determined based on the reversal of relevant taxable temporary differences. If the amount of taxable temporary differences is insufficient to recognise a deferred tax asset in full, then future taxable profits, adjusted for reversals of existing temporary differences, are considered, based on the business plans for individual subsidiaries in the Group. Deferred tax assets are reviewed at each reporting date and are reduced to the extent that it is no longer probable that the related tax benefit will be realised; such reductions are reversed when the probability of future taxable profits improves.

Unrecognised deferred tax assets are reassessed at each reporting date and recognised to the extent that it has become probable that future taxable profits will be available against which they can be used.

Deferred tax is measured at the tax rates that are expected to be applied to temporary differences when they reverse, using tax rates enacted or substantively enacted at the reporting date, and reflects uncertainty related to income taxes, if any.

The measurement of deferred tax reflects the tax consequences that would follow from the manner in which the Group excepts, at the reporting date, to recover or settle the carrying amount of its assets and liabilities.

Deferred tax assets and liabilities are offset only if certain criteria are met.

22.1 Amount recognised in income statement

BANK GROUP
For the year ended 31 December 2020
LKR ’000
2019
LKR ’000
2020
LKR ’000
2019
LKR ’000
Current tax expense
Current year 1,389,508 1,362,295 1,476,304 1,441,255
Change in estimates related to prior years (127,252) (173,014) (130,612) (174,133)
1,262,256 1,189,281 1,345,692 1,267,122
Dividend tax deducted at source on dividends
received from subsidiaries/equity accounted investments
12,402
Economics service charge write off 257
1,262,256 1,189,281 1,345,692 1,279,781
Deferred tax expense
Reversal of deferred tax liability (Note 41.1) (184,386) (118,076) (181,029) (111,824)
Origination of deferred tax asset (Note 41.2) (67,465) (155,808) (67,562) (159,811)
(251,851) (273,884) (248,591) (271,635)
Tax expense on continuing operations 1,010,405 915,397 1,097,101 1,008,146

The Group has considered the relevant provisions of the Inland Revenue Act No. 24 of 2017 which came into effect from 1 April 2018, when computing the current and deferred tax assets/liabilities.

As per the announcement dated 12 February 2020, income tax rate applicable for the Banking sector has been reduced to 24% with effect from 1 January 2020. However, as the said amendment is yet to be enacted income tax was calculated at the rate of 28% for the year ended 31 December 2020. Had the Bank considered the revised rate of 24%, the income tax charge recognised in the income statement would have been decreased by 181 Mn.

22.2 Amount recognised in OCI

BANK GROUP
For the year ended 31 December 2020
LKR ’000
2019
LKR ’000
2020
LKR ’000
2019
LKR ’000
Items that are or may be reclassified subsequently to
income statement
Movement in fair value reserve [fair value through other
comprehensive income (FVTOCI) debt instruments]
(777,396) (591,758) (777,396) (591,758)
Cash flow hedges – Cross currency swap (503) 111,050 (503) 111,050
(777,899) (480,708) (777,899) (480,708)
Items that will not be reclassified to income statement
Gain on remeasurements of defined benefit liability (26,297) 23,716 (26,322) 23,674
(26,297) 23,716 (26,322) 23,674
Total deferred tax expense recognised in OCI (804,196) (456,992) (804,221) (457,034)

22.3 Reconciliation of effective tax rate with income tax rate

BANK GROUP
For the year ended 31 December 2020 2019 2020 2019
% LKR ’000 % LKR ’000 % LKR ’000 % LKR ’000
Tax using 28% tax rate on
profit before tax (PBT)
28.00 951,563 28.00 836,994 28.00 1,104,288 28.00 926,363
Adjustment in respect of
current income tax of prior periods
(3.74) (127,252) (5.79) (173,014) (3.31) (130,612) (5.26) (174,133)
Non-deductible expenses 80.72 2,743,375 50.57 1,511,553 69.95 2,758,557 45.95 1,520,103
Allowable deductions (69.04) (2,346,260) (35.71) (1,067,439) (59.75) (2,356,333) (32.66) (1,080,626)
Dividend income (7.27) (247,187) (6.24) (186,661) (6.27) (247,187) (5.64) (186,661)
Tax incentives (1.84) (62,465) 4.41 131,832 (1.58) (62,465) 3.98 131,832
Taxable timing difference from
capital allowances on assets
6.77 229,956 4.55 136,016 5.83 229,956 4.11 136,016
Tax losses from prior year (0.08) (3,064) (0.17) (5,772)
Taxed at different rates 3.55 120,526 1.33 52,552
Withholding tax on dividend received 0.37 12,402
Adjustments 0.01 257
Current tax expense 37.15 1,262,256 39.79 1,189,281 34.12 1,345,692 38.69 1,279,781

Accounting Policy

The Group presents basic and diluted EPS data for its ordinary shares. Basic EPS is calculated by dividing the profit or loss that is attributable to ordinary shareholders of the Bank by the weighted average number of ordinary shares outstanding during the period. Diluted EPS is determined by adjusting the profit or loss that is attributable to ordinary shareholders and the weighted-average number of ordinary shares outstanding for the effects of all dilutive potential ordinary shares.

23.1 Basic earnings per share

BANK GROUP
For the year ended 31 December 2020 2019 2020 2019
Profit attributable to equity holders of the Bank (LKR ’000) 2,388,035 2,073,868 2,744,961 2,213,529
Weighted average number of ordinary shares (Note 23.2) 305,130,164 290,373,009 305,130,164 290,373,009
Basic earnings per ordinary share – LKR 7.83 7.14 9.00 7.62

23.2 Weighted average number of ordinary shares for basic earnings per share

Outstanding number of shares Weighted average number of shares
As at 31 December 2020 2019 2020 2019
Number of shares in issue at beginning 304,188,756 265,097,688 304,188,756 265,097,688
Number of shares exercised in the form of Rights Issue 39,091,068 25,275,321
Number of shares satisfied in the form of issue and
allotment of new shares from final dividend for 2019
1,808,494 941,408
Weighted average number of ordinary share
for basic earnings per ordinary share calculation
305,997,250 304,188,756 305,130,164 290,373,009

23.3 Diluted earnings per share

There was no dilution of ordinary shares outstanding. Therefore, diluted earnings per share is the same as basic earnings per share as shown in Note 23.1

The Board of Directors of the Bank has recommended the payment of a first and final dividend of LKR 3.00 per share
which is to be satisfied in the form of allotment of new ordinary shares for the year ended 31 December 2020.
(The Bank approved a final dividend of LKR 3.00 per share for the year ended 31 December 2019 and this was
satisfied in the form of cash and allotment of new ordinary shares).

BANK
For the year ended 31 December 2020 2019
Dividend per share (LKR) 3.00 3.00

Compliance with Section 56 and 57 of Companies Act No. 07 of 2007

As required by Section 56 of the Companies Act No. 07 of 2007 the Board of Directors of the Bank satisfied the
solvency test in accordance with Section 57, subject to relevant regulatory adherence, prior to declaring the final
dividend. A statement of solvency duly completed and signed by the Directors on 17 February 2021 have been audited by Messrs KPMG.

Dividend paid during the year

BANK
For the year ended 31 December 2020 2019
First and final dividend for 2019 – LKR 2.50 per share (2018 – LKR 3.50 per share) 760,472 927,841

See accounting policies in Notes 5.3.

The following table provides a reconciliation between line items in the statement of financial position and categories of financial instruments.

Bank
As at 31 December 2020 Note Fair value
through
profit or loss –
Mandatory
LKR ’000
Fair value
through other
comprehensive
income
LKR ’000
Amortised
cost


LKR ’000
Total


LKR ’000
Financial assets
Cash and cash equivalents 26 7,724,364 7,724,364
Balances with Central Bank of Sri Lanka 27 4,901,753 4,901,753
Placements with banks 28 15,414,287 15,414,287
Derivatives financial assets 29 835,464 835,464
Financial assets measured at fair value through profit or loss 30 609,717 609,717
Financial assets at amortised cost –
Loans to and receivables from banks
31 4,152,717 4,152,717
Financial assets at amortised cost –
Loans to and receivables from other customers
32 301,909,337 301,909,337
Financial assets at amortised cost – Debt and other instruments 33 31,604,175 31,604,175
Financial assets measured at fair value through
other comprehensive income
34 88,718,002 88,718,002
Other assets 42 1,999,405 1,999,405
Total financial assets 1,445,181 88,718,002 367,706,038 457,869,221
Bank
As at 31 December 2020 Note Fair value
through
profit or loss –
Mandatory
LKR ’000
Fair value
through other
comprehensive
income
LKR ’000
Amortised
cost


LKR ’000
Total


LKR ’000
Financial liabilities
Due to banks 44 14,909,937 14,909,937
Derivatives financial liabilities 29 267,883 267,883
Financial liabilities at amortised cost – Due to depositors 45 310,026,892 310,026,892
Financial liabilities at amortised cost – Due to other borrowers 46 46,847,076 46,847,076
Debt securities in issue 47 16,291,279 16,291,279
Other liabilities 50 4,783,877 4,783,877
Subordinated term debt 51 19,357,497 19,357,497
Total financial liabilities 267,883 412,216,558 412,484,441
Bank
As at 31 December 2019 Note Fair value
through
profit or loss –
Mandatory
LKR ’000
Fair value
through other
comprehensive
income
LKR ’000
Amortised
cost


LKR ’000
Total


LKR ’000
Financial assets
Cash and cash equivalents 26 5,450,209 5,450,209
Balances with Central Bank of Sri Lanka 27 8,666,547 8,666,547
Placements with banks 28 165,030 165,030
Derivative financial assets 29 631,438 631,438
Financial assets measured at fair value through profit or loss 30 5,307,066 5,307,066
Financial assets at amortised cost –
Loans to and receivables from other customers
32 272,818,311 272,818,311
Financial assets at amortised cost – Debt and other instruments 33 30,147,032 30,147,032
Financial assets measured at fair value through
other comprehensive income
34 72,716,407 72,716,407
Other assets 42 2,148,567 2,148,567
Total financial assets 5,938,504 72,716,407 319,395,696 398,050,607
Financial liabilities
Due to banks 44 24,594,828 24,594,828
Derivative financial liabilities 29 518,731 518,731
Financial liabilities at amortised cost – Due to depositors 45 247,786,974 247,786,974
Financial liabilities at amortised cost – Due to other borrowers 46 47,307,556 47,307,556
Debt securities in issue 47 14,148,198 14,148,198
Other liabilities 50 3,786,445 3,786,445
Subordinated term debt 51 16,859,914 16,859,914
Total financial liabilities 518,731 354,483,915 355,002,646
Group
As at 31 December 2020 Note Fair value
through
profit or loss –
Mandatory
LKR ’000
Fair value
through other
comprehensive
income
LKR ’000
Amortised
cost


LKR ’000
Total


LKR ’000
Financial assets
Cash and cash equivalents 26 7,728,969 7,728,969
Balances with Central Bank of Sri Lanka 27 4,901,753 4,901,753
Placements with banks 28 15,431,962 15,431,962
Derivative financial assets 29 835,464 835,464
Financial assets measured at fair value through profit or loss 30 609,717 609,717
Financial assets at amortised cost –
Loans to and receivables from banks
31 4,152,717 4,152,717
Financial assets at amortised cost –
Loans to and receivables from other customers
32 301,909,337 301,909,337
Financial assets at amortised cost – Debt and other instruments 33 31,604,175 31,604,175
Financial assets measured at fair value through
other comprehensive income
34 88,718,002 88,718,002
Other assets 42 2,066,621 2,066,621
Total financial assets 1,445,181 88,718,002 367,795,534 457,958,717
Financial liabilities
Due to banks 44 14,909,937 14,909,937
Derivative financial liabilities 29 267,883 267,883
Financial liabilities at amortised cost – Due to depositors 45 309,566,423 309,566,423
Financial liabilities at amortised cost – Due to other borrowers 46 46,847,076 46,847,076
Debt securities in issue 47 16,291,279 16,291,279
Other liabilities 50 4,900,983 4,900,983
Subordinated term debt 51 19,357,497 19,357,497
Total financial liabilities 267,883 411,873,195 412,141,078
Group
As at 31 December 2019 Note Fair value
through
profit or loss –
Mandatory
LKR ’000
Fair value
through other
comprehensive
income
LKR ’000
Amortised
cost


LKR ’000
Total


LKR ’000
Financial assets
Cash and cash equivalents 26 5,459,359 5,459,359
Balances with Central Bank of Sri Lanka 27 8,666,547 8,666,547
Placements with banks 28 200,441 200,441
Derivative financial assets 29 631,438 631,438
Financial assets measured at fair value through profit or loss 30 5,307,066 5,307,066
Financial assets at amortised cost –
Loans to and receivables from other customers
32 272,818,311 272,818,311
Financial assets at amortised cost – Debt and other instruments 33 30,147,032 30,147,032
Financial assets measured at fair value through other
comprehensive income
34 72,716,407 72,716,407
Other assets 42 2,238,053 2,238,053
Total financial assets 5,938,504 72,716,407 319,529,743 398,184,654
Financial liabilities
Due to banks 44 24,594,828 24,594,828
Derivative financial liabilities 29 518,731 518,731
Financial liabilities at amortised cost – Due to depositors 45 247,457,696 247,457,696
Financial liabilities at amortised cost – Due to other borrowers 46 47,307,556 47,307,556
Debt securities in issue 47 14,148,198 14,148,198
Other liabilities 50 3,907,977 3,907,977
Subordinated term debt 51 16,859,914 16,859,914
Total financial liabilities 518,731 354,276,169 354,794,900

Accounting Policy

Cash and cash equivalents include cash in hand, demand placements with banks and highly liquid financial assets with original maturities within three months or less from the date of acquisition that are subject to an insignificant risk of changes in fair value and are used by the Group in the management of its short-term commitments. These items are brought to financial statements at face values or the gross values, where appropriate.

Cash and cash equivalents are carried at amortised cost in the statement of financial position.

Statement of cash flows

The Statement of Cash Flows has been prepared by using the “Direct Method” of preparing cash flows in accordance with the Sri Lanka Accounting Standard – LKAS 7 on “Statement of Cash Flows”. A reconciliation of the profit for the year to net cash flows used in operating activities is also presented for comparability.

BANK GROUP
As at 31 December 2020
LKR ’000
2019
LKR ’000
2020
LKR ’000
2019
LKR ’000
Cash in hand 4,865,815 4,565,648 4,866,081 4,565,932
Balances with banks 2,858,549 884,561 2,862,888 893,427
7,724,364 5,450,209 7,728,969 5,459,359

26.1 Analysis by currency

BANK GROUP
As at 31 December 2020
LKR ’000
2019
LKR ’000
2020
LKR ’000
2019
LKR ’000
Cash in hand 4,865,815 4,565,648 4,866,081 4,565,932
Held in local currency 4,829,247 4,523,367 4,829,513 4,523,651
Held in foreign currency 36,568 42,281 36,568 42,281
Balances with Banks 2,858,549 884,561 2,862,888 893,427
Local Banks 35 3,138 8,901
Foreign Banks 2,858,549 884,526 2,859,750 884,526
7,724,364 5,450,209 7,728,969 5,459,359

Accounting Policy

Balances with Central Banks are carried at amortised cost in the statement of financial position.

BANK GROUP
As at 31 December 2020
LKR ’000
2019
LKR ’000
2020
LKR ’000
2019
LKR ’000
Statutory balances with Central Bank of Sri Lanka 4,901,753 8,666,547 4,901,753 8,666,547

As required by the provisions of Section 93 of Monetary Law Act, a minimum cash balance is maintained with the Central Bank of Sri Lanka, The minimum cash reserve requirement on rupee deposit liabilities is prescribed as a percentage of rupee deposit liabilities. The percentage is varied from time to time. Applicable minimum rate was 4% with effect from 16 March 2020 and 2% with effect from 16 June 2020 (Minimum rate was 5% with effect from 1 March 2019). There are no reserve requirement for deposit liabilities of the Foreign Currency Banking Unit
and foreign currency deposit liabilities in the Domestic Banking Unit.

See accounting policies in Notes 5.3.

BANK GROUP
As at 31 December 2020
LKR ’000
2019
LKR ’000
2020
LKR ’000
2019
LKR ’000
Central Bank of Sri Lanka 13,226,633 165,030 13,226,633 165,030
Bank of Ceylon 2,000,249 2,000,249
Union Bank of Colombo 187,405 187,405
Commercial Bank of Ceylon PLC 17,675 35,411
Total 15,414,287 165,030 15,431,962 200,441

Accounting Policy

Derivative assets held-for-risk management purposes include all derivative assets that are not classified as trading assets and are measured at fair value in the Statement of Financial Position.

Policy applicable generally to hedging relationships

Up to 1 January 2018 the Bank has not designated any derivative held-for-risk management purposes as a qualifying hedge relationship and therefore the Bank has not adopted hedge accounting. However from 1 January 2018 the Bank has applied hedge accounting principles of SLFRS 9 on financial instruments.

The Group designates certain derivatives held-for-risk management as well as certain non derivative financial instruments as hedging instruments in qualifying hedging relationships.

On initial designation of the hedge, the Group formally documents the relationship between the hedging instrument and hedged item, including the risk management objective and strategy in undertaking the hedge, together with the method that will be used to assess the effectiveness of the hedging relationship. The Group makes an assessment, both on inception of the hedging relationship and on an ongoing basis, of whether the hedging instrument is expected to be highly effective in offsetting the changes in the fair value or cash flows of the respective hedged item during the period for which the hedge is designated, and whether the actual results of each hedge are within a range of 80 – 125%. For a cash flow hedge of a forecast transaction, the Group makes an assessment of whether the forecast transaction is highly probable to occur and presents an exposure to variations in cash flows that could ultimately affect profit or loss.

29.1 Cash flow hedge

When a derivative is designated as the hedging instrument in a hedge of the variability in cash flows attributable to a particular risk associated with a recognised asset or liability or highly probable forecast transaction that could affect profit or loss, the effective portion of changes in the fair value of the derivative is recognised in OCI and presented in the hedging reserve within equity. Any ineffective portion of changes in the fair value of the derivative is recognised immediately in profit or loss. The amount recognised in the hedging reserve is reclassified from OCI to profit or loss as a reclassification adjustment in the same period as the hedged cash flows affect profit or loss, and in the same line item in the income statement and OCI.

If the hedging derivative expires or is sold, terminated or exercised, or the hedge no longer meets the criteria for cash flow hedge accounting, or the hedge designation is revoked, then hedge accounting is discontinued prospectively. However, if the derivative is novated to a Central Counterparty (CCP) by both parties as a consequence of laws or regulations without changes in its terms except for those that are necessary for the novation, then the derivative is not considered expired or terminated. If the hedged cash flows are no longer expected to occur, then the Group immediately reclassifies the amount in the hedging reserve from OCI to profit or loss. For terminated hedging relationships, if the hedged cash flows are still expected to occur, then the amount accumulated in the hedging reserve is not reclassified until the hedged cash flows affect profit or loss; if the hedged cash flows are expected to affect profit or loss in multiple reporting periods, then the Group reclassifies the amount in the hedging reserve from OCI to profit or loss on a straight
line basis.

The Bank uses cross currency swaps (CCS) to hedge the interest rate risk and exchange rate risk arising from a floating rate borrowing denominated in foreign currencies. The hedging relationship is designated as cash flow hedge since the Bank is expecting to hedge the variability arise
by the interest rate risk and exchange rate risk, where the USD borrowing can be identified as the hedged item, the CCS can be identified as the hedge instrument and interest rate risk and exchange rate risk can be identified as the hedged risk.

Derivatives are classified as assets, when their fair value is positive or as liabilities, when their fair value is negative. Derivative assets and liabilities arising from different transactions are only offset, if the transactions are with the same counterparty, a legal right of offset exists, and the parties intend to settle the cash flows on a net basis.

29.2 Fair value hedge of foreign exchange risk

The Bank hedge the risk of variation in fair value of foreign currency denominated loans using foreign currency forwards from 1 January 2019. The risk management strategy is to use the foreign currency variability (gains/losses) arising because of revaluation of the foreign currency forwards attributable to change in the spot foreign exchange rates to off-set the variability, due to foreign exchange rate movements, in the value of USD denominated loans.

The hedged risk is the USD/LKR foreign exchange risk in the LKR conversion of USD denominated long-term liabilities. USD denominated long-term liabilities are designated as hedge item and forward contract that maturity match with the tenure considered as hedge instrument.

The Group’s approach to managing market risk, including foreign exchange risk, is discussed in Note 8.4. The Group’s exposure to foreign exchange risk is disclosed in Note 8.4.5.

By using derivative financial instruments to hedge exposures to changes in exchange rates, the Group also exposes itself to credit risk of the derivative counterparty,
which is not offset by the hedged item. The Group minimises counterparty credit risk in derivative instruments by entering into transactions with high-reputed counterparties.

Before fair value hedge accounting is applied by the Group, the Group determines whether an economic relationship between the hedged item and the hedging instrument exists based on an evaluation of the qualitative characteristics of these items and the hedged risk that is supported by quantitative analysis. The Group considers whether the critical terms of the hedged item and hedging instrument closely align when assessing the presence of an economic relationship. The Group evaluates whether the fair value of the hedged item and the hedging instrument respond similarly to similar risks.

Under the Group policy, in order to conclude that a
hedging relationship is effective, all the required criteria should be met

29.3 Other non-trading derivatives

Other non-trading derivatives are recognised on balance sheet at fair value. If a derivative is not held for trading, and is not designated in a qualifying hedging relationship, then all changes in its fair value are recognised immediately in profit or loss as a component of net income from other financial instruments at FVTPL.

29.4 Derivative financial assets/liabilities

The following table describes the fair values of derivatives held-for-risk management purposes by type of instrument:

29.4.1 Assets

BANK GROUP
As at 31 December 2020
LKR ’000
2019
LKR ’000
2020
LKR ’000
2019
LKR ’000
Instrument type
Interest rate and foreign exchange
Cross currency swaps 527,877 510,660 527,877 510,660
Foreign exchange
Forward foreign exchange contracts – Currency swaps 276,665 108,069 276,665 108,069
– Other 30,922 12,709 30,922 12,709
835,464 631,438 835,464 631,438

29.4.2 Liabilities

BANK GROUP
As at 31 December 2020
LKR ’000
2019
LKR ’000
2020
LKR ’000
2019
LKR ’000
Instrument type
Foreign exchange
Forward foreign exchange contracts – Currency swaps 239,805 492,283 239,805 492,283
– Other 28,078 26,448 28,078 26,448
267,883 518,731 267,883 518,731

29.4.3 Fair value hedge

The amount relating to items designated as hedging instruments and hedge effectiveness at 31 December 2020 were
as follow:

Asset

LKR ’000
Line item in the
statement of
financial position
Amount set off in the
income statements
LKR ’000
Foreign currency risk
Hedge of foreign exchange risk arising from foreign currency denominated long term liabilities using FX forwards 17,789,536 Derivative assets (liabilities) held-for-risk management purposes 980,827

The amount relating to items designated as hedging instruments and hedge effectiveness at 31 December 2019 were as follow:

Asset

LKR ’000
Line item in the
statement of
financial position
Amount set off in the
income statements
LKR ’000
Foreign currency risk
Hedge of foreign exchange risk arising from foreign currency denominated long term liabilities using FX forwards 25,004,743 Derivative assets (liabilities) held-for-risk management purposes 212,822

The amount relating to items designated as hedged items at 31 December 2020 were as follow:

Line item in the statement of financial position in which the hedged items is included Carrying
amount of liability
LKR ’000
Amount set off in the
income statement
LKR ’000
Due to other customers 9,039,056 406,528
Due to other borrowings 8,750,480 574,299
17,789,536 980,827

The amount relating to items designated as hedged items at 31 December 2019 were as follow:

Line item in the statement of financial position in which the hedged items is included Carrying
amount of liability
LKR ’000
Amount set off in the
income statement
LKR ’000
Due to other customers 12,299,247 58,631
Due to other borrowings 12,705,496 154,191
25,004,743 212,822

Following table summarises the impact on the line items in income statement.

For the year ended 31 December 2020 Balance before
the hedging
adjustment
LKR ’000
Hedging
adjustment

LKR ’000
Balance after
the hedging
adjustment
LKR ’000
Foreign exchange gain/(loss) (Note 16) (957,535) 980,827 23,292
Forward exchange fair value changes –
Contracts with commercial banks (Note 14)
437,658 (980,827) (543,169)
For the year ended 31 December 2019 Balance before
the hedging
adjustment
LKR ’000
Hedging
adjustment

LKR ’000
Balance after
the hedging
adjustment
LKR ’000
Foreign exchange gain/(loss) (Note 16) 687,025 (212,822) 474,203
Forward exchange fair value changes –
Contracts with commercial banks (Note 14)
(2,791,000) 212,822 (2,578,178)

Accounting Policy

See accounting policies in Notes 5.3.

Financial assets measured at FVTPL are measured initially at fair value and subsequently recorded in the statement of financial position at fair value. Changes in fair value are recognised in income statement.

BANK GROUP
As at 31 December Note 2020
LKR ’000
2019
LKR ’000
2020
LKR ’000
2019
LKR ’000
Quoted equity securities 30.1 44,880 4,777,423 44,880 4,777,423
Quoted units in Unit Trust 30.2 3,740 3,740 3,740 3,740
Unquoted units in Unit Trust 30.3 561,097 525,903 561,097 525,903
609,717 5,307,066 609,717 5,307,066

30.1 Quoted equity securities – Bank/Group

As at 31 December 2020 2019
Number of
ordinary
shares
Cost*

LKR ’000
Fair
value
LKR ’000
Number of
ordinary
shares
Cost*

LKR ’000
Fair
value
LKR ’000
John Keells Holdings PLC 300,000 33,811 44,880
Commercial Bank of Ceylon PLC – voting 47,628,006 1,931,775 4,524,661
Tokyo Cement Company (Lanka) PLC – voting 700,000 26,235 33,600
Tokyo Cement Company (Lanka) PLC – Non-voting 300,000 10,623 11,760
Chevron Lubricants Lanka PLC 400,000 26,137 29,960
Piramal Glass Ceylon PLC 2,015,904 7,540 9,072
Dialog Axiata PLC 1,235,357 13,117 15,195
Access Engineering PLC 330,062 5,908 7,195
Aitken Spence PLC 500,000 24,430 23,250
ACL Cables PLC 655,299 37,252 37,680
Teejay Lanka PLC 1,000,000 44,668 40,800
Royal Ceramics Lanka PLC 500,000 37,276 44,250
33,811 44,880 2,164,961 4,777,423

*Cost is reduced by write-off of diminution in value other than temporary in respect of investments.

The “Guidance Notes on Accounting Consideration of the COVID-19 Outbreak” issued by The Institute of Chartered Accountants of Sri Lanka on 11 May 2020, permited entities to reclassify equity portfolio as an one off option, as a result of COVID-19 if an entity decides to change its business model as at 1 January 2020.

Accordingly, the Bank has reclassified the investment made in the quoted equity securities including the investment of Commercial Bank of Ceylon PLC from fair value through profit or loss to fair value through other comprehensive income with effect from 1 January 2020.

30.2 Quoted units in Unit Trust – Bank/Group

As at 31 December 2020 2019
Number of
units
Cost *

LKR ’000
Fair
value
LKR ’000
Number of
units
Cost *

LKR ’000
Fair
value
LKR ’000
NAMAL Acuity Value Fund 39,102 1,963 3,740 39,102 1,963 3,740
1,963 3,740 1,963 3,740

30.3 Unquoted units in Unit Trust – Bank/Group

As at 31 December 2020 2019
Number of
units
Cost

LKR ’000
Fair
value
LKR ’000
Number of
units
Cost

LKR ’000
Fair
value
LKR ’000
NAMAL Growth Fund 2,125,766 251,539 270,292 2,125,766 251,539 245,608
NAMAL Income Fund 983,621 10,042 15,031
National Equity Fund 250,000 2,657 7,875 250,000 2,657 6,858
Guardian Acuity Equity Fund 9,052,505 150,000 164,069 9,052,505 150,000 157,275
JB Vantage Value Equity Fund 5,224,660 100,000 118,861 5,224,660 100,000 101,131
504,196 561,097 514,238 525,903

Refer Note 9.3.1 for valuation techniques and significant unobservable inputs.

Accounting Policy

See accounting policies in Notes 5.3 and 17.

“Financial assets at amortised cost – Loans and advances to banks” include amounts due from banks.

As per SLFRS 9, Loans and advances to banks are assets that are held within a business model whose objective is to hold the assets in order to collect contractual cash flows and the contractual terms of the assets give rise on specific dates to cash flows that are solely payment of principal and interest on the principal outstanding.

After initial measurement, loans and receivables to banks are subsequently measured at gross carrying amount using the EIR, less provision for impairment, except when the Group designates at fair value through profit or loss. EIR is calculated by taking into account any discount or premium on acquisition and fees and costs. The amortisation is included in “Interest income” while the losses arising from impairment are recognised in “Impairment charges and other losses” in the income statement.

BANK GROUP
As at 31 December 2020
LKR ’000
2019
LKR ’000
2020
LKR ’000
2019
LKR ’000
Gross loans and receivables 4,152,717 4,152,717

31.1 Analysis

31.1.1 By product

BANK/GROUP
As at 31 December 2020
LKR ’000
2019
LKR ’000
Securities purchased under resale agreements 4,152,717
Gross loans and receivables 4,152,717

31.1.2 By currency

BANK/GROUP
As at 31 December 2020
LKR ’000
2019
LKR ’000
Sri Lankan rupee 4,152,717
Gross loans and receivables 4,152,717

Accounting Policy

See accounting policies in Notes 5.3 and 17.

Loans to and receivables from other customers include loans and advances and lease receivables of the Group.

Principal amount of loans and advances (for example, over drawn balances in current account) are recognised when cash is advanced to a borrower. They are derecognised when either the borrower repays its obligations, or the loans are written off, or substantially all the risks and rewards of ownership are transferred. They are initially recorded at fair value plus any directly attributable transaction costs and are subsequently measured at amortised cost using the effective interest method, less any reduction for impairment or uncollectibility.

When the Bank is the lessor in a lease agreement that transfers substantially all of the risk and rewards incidental to the ownership of the asset to the lessee, the arrangement is classified as a finance lease and a receivable equal to the net investment in the lease is recognised and presented within loans and advances.

Loans and receivables from other customers are normally written off, either partially or in full, when there is no realistic prospect of recovery and all possible steps have been executed in recovering dues. Where loans are secured, this is generally after receipt of any proceeds from the realisation of the security. If the write-off is later recovered, the recovery is credited to “Net other operating income”.

BANK GROUP
As at 31 December 2020
LKR ’000
2019
LKR ’000
2020
LKR ’000
2019
LKR ’000
Gross loans and receivables 317,232,613 285,224,793 317,232,613 285,224,793
Allowance for impairment (Note 32.1.4) (15,323,276) (12,406,482) (15,323,276) (12,406,482)
Net loans and receivables 301,909,337 272,818,311 301,909,337 272,818,311
Gross loans and receivables
Stage 1 250,718,437 224,020,849 250,718,437 224,020,849
Stage 2 42,152,186 37,368,923 42,152,186 37,368,923
Stage 3 24,361,990 23,835,021 24,361,990 23,835,021
317,232,613 285,224,793 317,232,613 285,224,793
BANK GROUP
As at 31 December 2020
LKR ’000
2019
LKR ’000
2020
LKR ’000
2019
LKR ’000
Allowance for impairment
Stage 1 1,305,740 901,871 1,305,740 901,871
Stage 2 1,065,570 1,563,877 1,065,570 1,563,877
Stage 3 12,951,966 9,940,734 12,951,966 9,940,734
15,323,276 12,406,482 15,323,276 12,406,482
Net loans and receivables 301,909,337 272,818,311 301,909,337 272,818,311

32.1 Analysis

32.1.1 By product

BANK GROUP
As at 31 December 2020
LKR ’000
2019
LKR ’000
2020
LKR ’000
2019
LKR ’000
Overdrafts 36,812,262 41,691,542 36,812,262 41,691,542
Trade finance 30,342,162 35,637,646 30,342,162 35,637,646
Lease rentals receivable (Note 32.1.1.1) 25,127,338 22,173,952 25,127,338 22,173,952
Credit cards 2,199,543 1,448,853 2,199,543 1,448,853
Pawning 4,565,645 3,620,611 4,565,645 3,620,611
Staff loans 2,491,323 2,096,715 2,491,323 2,096,715
Term loans 213,617,752 176,290,391 213,617,752 176,290,391
Commercial papers and asset back notes 2,076,588 2,227,583 2,076,588 2,227,583
Preference shares unquoted 37,500 37,500
Gross loans and receivables 317,232,613 285,224,793 317,232,613 285,224,793
COVID-19 Repayment deferral packages offered to customers

The Bank has offered various forms of assistance to customers to counteract the impact of COVID-19 on the ability of customers to meet their loan obligations since March 2020, based on the guidelines given by Central Bank of Sri Lanka and Bank’s own initiatives. Refer to Key Judgements and Estimates in this Note for details of the impact of deferrals when determining if there has been a Significant Increase in Credit Risk (SICR).

The loan repayment deferral package/moratorium is considered to be a loan modification under SLFRS 9. In addition the Bank offered working capital loan arrangements under concessionary rates as per the circulars issues by Central Bank of Sri Lanka (CBSL).

32.1.1.1 Lease rentals receivable
BANK GROUP
As at 31 December 2020
LKR ’000
2019
LKR ’000
2020
LKR ’000
2019
LKR ’000
Gross investment in leases:
Lease rentals receivable
– within one year 12,215,465 11,037,691 12,215,465 11,037,691
– within one to five years 18,476,263 16,323,550 18,476,263 16,323,550
30,691,728 27,361,241 30,691,728 27,361,241
Less: Deposit of rentals 11,676 14,057 11,676 14,057
Unearned income on rentals receivable
– within one year 2,675,561 2,579,963 2,675,561 2,579,963
– within one to five years 2,877,153 2,593,269 2,877,153 2,593,269
25,127,338 22,173,952 25,127,338 22,173,952

32.1.2 By currency

BANK GROUP
As at 31 December 2020
LKR ’000
2019
LKR ’000
2020
LKR ’000
2019
LKR ’000
Sri Lankan Rupee 278,775,496 250,669,907 278,775,496 250,669,907
United States Dollar 37,443,007 33,678,971 37,443,007 33,678,971
Great Britain Pound 652,137 662,214 652,137 662,214
Australian Dollar 91,191 36,797 91,191 36,797
Euro 270,782 176,904 270,782 176,904
Gross loans and receivables 317,232,613 285,224,793 317,232,613 285,224,793

32.1.3 By industry

BANK GROUP
As at 31 December 2020
LKR ’000
2019
LKR ’000
2020
LKR ’000
2019
LKR ’000
Agriculture, forestry, and fishing 34,483,557 28,282,969 34,483,557 28,282,969
Manufacturing 55,769,741 54,535,325 55,769,741 54,535,325
Tourism 15,990,359 13,393,587 15,990,359 13,393,587
Transportation and storage 9,108,654 9,434,389 9,108,654 9,434,389
Construction 34,175,044 32,559,866 34,175,044 32,559,866
Infrastructure development 34,465,896 30,024,078 34,465,896 30,024,078
Wholesale and retail trade 41,871,504 44,195,272 41,871,504 44,195,272
Information technology and communication services 1,712,933 1,531,401 1,712,933 1,531,401
Financial services 13,286,037 14,856,831 13,286,037 14,856,831
Professional, scientific, and technical activities 3,203,777 1,709,325 3,203,777 1,709,325
Arts, entertainment, and recreation 756,676 788,364 756,676 788,364
Education 3,751,677 1,471,284 3,751,677 1,471,284
Healthcare, social services, and support services 6,077,955 4,213,504 6,077,955 4,213,504
Consumption 50,166,516 36,783,616 50,166,516 36,783,616
Lending to Ministry of Finance 33,923 164,257 33,923 164,257
Lending to overseas entities 12,378,364 11,280,725 12,378,364 11,280,725
Gross loans and receivables 317,232,613 285,224,793 317,232,613 285,224,793

32.1.4 Movements in impairment during the year

BANK/GROUP
As at 31 December 2020
LKR ’000
2019
LKR ’000
Stage 1
Balance at beginning 901,871 786,161
Charge to income statement 404,581 116,321
Write-off during the year (712) (611)
Balance as at 31 December 1,305,740 901,871
Stage 2
Balance at beginning 1,563,877 2,355,958
Write back to income statement (494,452) (790,380)
Write-off during the year (3,855) (1,701)
Balance as at 31 December 1,065,570 1,563,877
Stage 3
Balance at beginning 9,940,734 8,423,457
Charge to income statement 3,030,682 2,264,451
Effect of foreign currency movement 44,441 9,475
Write-off during the year (27,398) (741,068)
Other movements (36,493) (15,581)
Balance as at 31 December 12,951,966 9,940,734
Total impairment 15,323,276 12,406,482
Key judgements and estimates

In estimating collectively assessed ECL, the Bank makes judgements and assumptions in relation to:

  • the selection of an estimation technique or modelling methodology, noting that the modelling of the Group’s ECL estimates are complex; and
  • the selection of inputs for those models, and the interdependencies between those inputs.

The following table summarises the key judgements and assumptions used by the Bank in relation to the ECL model inputs, the interdependencies between those inputs, and highlights the significant changes during the current year.

The judgements and associated assumptions have been made within the context of the impact of COVID-19, and reflect historical experience and other factors that are considered to be relevant, including expectations of future events that are believed to be reasonable under the circumstances. In relation to COVID-19, judgements and assumptions include the extent and duration of the pandemic, the impacts of actions of governments and other authorities, and the responses of businesses and consumers in different industries, along with the associated impact on the economy. Accordingly, the Bank’s ECL estimates are inherently uncertain and, as a result, actual results may differ from these estimates.

Judgement/Assumption Description Considerations for the year ended 31 December 2020
Determining when a Significant Increase
in Credit Risk (SICR)
has occurred
In the measurement of ECL, judgement is involved in setting the rules and trigger points to determine whether there has been a SICR since initial recognition of a loan, which would result in the financial asset moving from “Stage 1” to “Stage 2”. This is a key area of judgement since transition from Stage 1 to Stage 2 increases the ECL from an allowance based on the probability of default in the next 12 months, to an allowance for lifetime expected credit losses. In response to the impacts of COVID-19, various moratorium/ debt concessionary schemes have been offered to eligible customers. The Bank does not consider that when a customer is first provided assistance it automatically results in a Significant Increase in Credit Risk (SICR) and a consequent impact on ECL when assessing provisions. Subsequent to take-up, assessments have been carried out based on the discussions with the customers on the future business cashflows, financial position, the sectors in which the businesses operate, and ability to recommence loan repayments at the end of the moratorium/debt concessionary period to conclude whether ther is a SICR.
Measuring both 12-month and
lifetime credit
losses
The probability of default (PD), loss given default (LGD) and exposure at default (EAD) credit risk parameters used in determining ECL are point-intime measures reflecting the relevant forward looking information determined by management. Judgement is involved in determining which forward-looking information variables are relevant for particular lending portfolios and for determining each portfolio’s point-in-time sensitivity. The PD, EAD and LGD models are subject to the Bank’s policy on impairment model that stipulates periodic model monitoring, periodic revalidation and the approval procedures and authorities according to model materiality. There were no material changes to the policies during the year ended 31 December 2020. Due to the implications of moratorium/ debt concessionary schemes on PDs and LDGs (due to limited movements to Stage 2 & 3), adjustments have been made as overlays based on stress testing and historic patters to better reflect the adequacy of ECL.
In addition, judgement is required where behavioural characteristics are applied in estimating the lifetime
of a facility to be used in measuring ECL.
There were no material changes to behavioural lifetime estimates during the year ended 31 December 2020.
Base case economic
forecast
The Bank derives a forward-looking “base case” economic scenario which reflects the Bank’s view of the most likely future macro-economic conditions. There have been no changes to the types of forward-looking variables (key economic drivers) used as model inputs in the current year. As at 31 December 2020, the base case assumptions have been updated to reflect the rapidly evolving situation with respect to COVID-19 by using the economic forecast.
Probability weighting
of each economic scenario (base case, best and worst scenarios)
Probability weighting of each economic scenario is determined by management considering the risks and uncertainties surrounding the base case economic scenario at each measurement date. The key consideration for probability weightings in the current period is the continuing impact of COVID-19. In addition to the base case forecast which reflects the negative economic consequences of COVID-19, greater weighting has been applied to the worst scenario given the Bank’s assessment of downside risks. The assigned probability weightings are subject to a high degree of inherent uncertainty and therefore the actual outcomes may be significantly different to those projected.
Management
temporary
adjustments
Management temporary adjustments to the ECL allowance are used in circumstances where it is judged that the existing inputs, assumptions and model techniques do not capture all the risk factors relevant to Group’s lending portfolios. Emerging local or global macroeconomic, microeconomic or political events, and natural disasters that are not incorporated into the current parameters, risk ratings, or forward-looking information are examples of such circumstances. The use of management temporary adjustments may impact the amount of ECL recognised. Management have applied a number of adjustments to the modelled ECL primarily due to the uncertainty associated with COVID-19.
The uncertainty associated with the COVID-19 pandemic, and the extent to which the actions of governments, businesses and consumers mitigate against potentially adverse credit outcomes are not fully incorporated into existing ECL models. Accordingly, management
overlays have been applied to ensure credit provisions
are appropriate.
Management overlays (including COVID-19 overlays) which add to the modelled ECL provision have been made for risks particular for risk elevated sectors identified by the Bank.

Accounting Policy

See accounting policies in Notes 5.3 and 17.

A financial asset is measured at amortised cost if it meets both of the following conditions and is not designated as FVTPL:

  • The asset is held within a business model whose objective is to hold assets to collect contractual cash flows; and
  • The contractual terms of the financial asset give rise on specified dates to cash flows that are solely payments of principal and interest on the principal amount outstanding.
BANK/GROUP
As at 31 December 2020
LKR ’000
2019
LKR ’000
Sri Lanka Government Securities
Treasury Bills – unencumbered 968,754
Treasury Bonds – unencumbered 17,505,660 17,683,437
Sri Lanka developments bonds 7,596,484 8,485,034
Sri Lanka sovereign bonds – unencumbered 6,111,605
Other Investments
Quoted debentures (Note 33.1) 661,941 3,092,378
Accumulated impairment under Stage 1 (Note 33.3) (271,515) (82,571)
Total 31,604,175 30,147,032

33.1 Quoted debentures Bank/Group

As at 31 December 2020 2019
Number of
debentures
Amortised cost
of investment
LKR ’000
Number of
debentures
Cost of
investment
LKR ’000
Access Engineering PLC 2,500,000 252,953
Commercial Credit & Finance PLC 4,500,000 450,000
LB Finance PLC 1,155,200 116,344 1,155,200 116,342
People’s Leasing & Finance PLC 2,500,000 272,217 12,500,000 1,285,231
Senkadagala Finance PLC 3,650,000 371,962
Singer Finance (Lanka) PLC 2,500,000 273,380 2,500,000 256,960
Vallibel Finance PLC 3,500,000 358,930
Total investments in quoted debentures – Bank/Group 661,941 3,092,378

33.2 Quoted debentures – By collateralisation

BANK/GROUP
As at 31 December 2020
LKR ’000
2019
LKR ’000
Pledged as collateral 308,951 43,883
Unencumbered 352,990 3,048,495
661,941 3,092,378

33.3 Movement in impairment during the year

Bank/Group
As at 31 December 2020
LKR ’000
2019
LKR ’000
Stage 1
Balance at beginning 82,571 45,414
Transferred from FVOCI during the year (Note 34.7) 67,231
Charge to income statement 121,713 37,157
Balance as at 31 December 271,515 82,571

Accounting Policy

See accounting policies in Notes 5.3 and 17.

A financial asset is measured at fair value through other comprehensive income (FVOCI) only if it meets both of the following conditions and is not designated as FVTPL:

  • The asset is held within a business model whose objective is achieved by both collecting contractual cash flows and selling financial assets; and
  • The contractual terms of the financial asset give rise on specified dates to cash flows that are solely payments of principal and interest on the principal amount outstanding.
  • On initial recognition of an equity instrument that is not held for trading, the Group may irrevocably elect to present subsequent changes in fair value in OCI. This election is made on an investment by investment basis.
BANK GROUP
As at 31 December 2020
LKR ’000
2019
LKR ’000
2020
LKR ’000
2019
LKR ’000
Government securities*
Treasury Bills (Note 34.5) 13,169,467 4,813,939 13,169,467 4,813,939
Treasury Bonds (Note 34.6) 62,102,967 54,770,406 62,102,967 54,770,406
Sri Lanka development bonds – unencumbered** 1,857,951 1,857,951
Sri Lanka sovereign bonds – unencumbered** 931,706 2,260,552 931,706 2,260,552
76,204,140 63,702,848 76,204,140 63,702,848
Equity securities
Quoted (Note 34.1) 12,299,552 8,812,702 12,299,552 8,812,702
Unquoted (Note 34.2) 213,810 200,357 213,810 200,357
Preference shares (Note 34.3) 500 500 500 500
12,513,862 9,013,559 12,513,862 9,013,559
Total 88,718,002 72,716,407 88,718,002 72,716,407

* Government securities include impairment allowance of LKR 20.85 Mn as at 31 December 2020 (LKR 14.39 Mn as at December 2019) Movement in impairment during the year is given in Note 34.7.

** As per the Guidance Notes on Accounting Consideration of the COVID-19 Outbreak” issued by The Institute of Chartered Accountants of Sri Lanka on 11 May 2020, the Bank has reclassified the investment made in Sovereign Bond and Sri Lanka Development Bond from fair value through other comprehensive income to amortized cost with effect from 1 April 2020.

34.1 Quoted ordinary shares

As at 31 December 2020 2019
Number of
ordinary
shares
Cost*

LKR ’000
Fair
value
LKR ’000
Number of
ordinary
shares
Cost*

LKR ’000
Fair
value
LKR ’000
Banks, Finance and Insurance
Commercial Bank of Ceylon PLC – Voting 133,233,726 8,133,658 10,778,608 82,560,377 3,348,620 7,843,236
Commercial Bank of Ceylon PLC – Non-voting 274,108 22,239 19,215 267,187 21,705 22,177
National Development Bank PLC 3,168,904 480,711 247,491 3,021,280 465,605 302,128
8,636,608 11,045,314 3,835,930 8,167,541
Chemicals and pharmaceuticals
Chemical Industries (Colombo) PLC – Voting 247,900 14,131 45,192 247,900 14,131 14,874
Chemical Industries (Colombo) PLC – Non-voting 389,400 15,577 59,033 389,400 15,577 18,535
29,708 104,225 29,708 33,409
Construction and Engineering
Access Engineering PLC 1,500,000 37,616 36,900 1,134,753 17,826 24,738
Colombo Dockyard PLC 160,000 12,160 13,648 160,000 12,160 9,920
49,776 50,548 29,986 34,658
Diversified Holdings
Carson Cumberbatch PLC 46,967 7,745 8,924
Hayleys PLC 7,333 2,225 3,040 7,333 2,225 1,283
Hemas Holdings PLC 1,427,599 99,383 142,617 927,599 59,946 74,208
John Keells Holdings PLC 601,482 77,245 89,982 521,482 66,947 87,400
Melstacorp PLC 2,069,940 90,053 107,637 2,069,940 90,053 90,042
Richard Pieris & Co. PLC 1,233,948 11,907 14,561
268,906 343,276 238,823 276,418
Healthcare
Asiri Hospital Holdings PLC 1,500,000 31,094 30,000
Hotels and Travels
Dolphin Hotels PLC 93,900 906 2,479 93,900 906 2,301
Investment Trusts
Ceylon Guardian Investment Trust PLC 152,308 5,918 19,389 152,308 5,918 13,906
Ceylon Investment PLC 293,783 9,645 21,828 288,309 9,428 14,848
15,563 41,217 15,346 28,754
Telecommunications
Dialog Axiata PLC 4,000,000 37,482 49,600 4,050,000 38,405 49,815
Manufacturing
ACL Cables PLC 790,000 45,270 60,514 40,000 2,278 2,300
Ceylon Grain Elevators PLC 148,997 9,197 16,539 148,997 9,197 10,205
Chevron Lubricants Lanka PLC 411,628 20,505 44,456 761,628 27,907 57,046
Kelani Tyres PLC 25,000 1,513 2,163 75,000 4,538 3,720
Piramal Glass Ceylon PLC 5,000,000 14,024 22,500
Royal Ceramics Lanka PLC 20,000 1,915 3,542 139,800 16,996 12,372
Teejay Lanka PLC 1,075,000 43,941 40,850 75,000 3,141 3,060
Tokyo Cement Company (Lanka) PLC – Voting 1,570,000 97,985 119,634 120,000 5,734 5,760
Tokyo Cement Company (Lanka) PLC –
Non-voting
2,522,515 88,906 172,035 1,472,515 25,759 57,723
Aitken Spence PLC 500,000 23,250 28,900
Hayleys Fabric PLC 3,500,000 66,404 97,300
Expolanka Holings PLC 2,000,000 53,523 58,000
452,409 643,933 109,574 174,686
Power and Energy
Vallibel Power Erathna PLC 2,400,000 6,400 18,960 2,400,000 6,400 15,120
Total quoted ordinary shares – Bank 9,497,758 12,299,552 4,336,172 8,812,702
Commercial Bank of Ceylon PLC –
Equity adjustment**
1,454,863 1,454,863
Total quoted ordinary shares – Group 10,952,621 12,299,552 5,791,035 8,812,702

Sector classification and fair value per share are based on the list published by Colombo Stock Exchange, as at the reporting date.

* Cost is reduced by write-off of diminution in value other than temporary in respect of Investments.

** During the year 2010, the status of the investment in equity capital of Commercial Bank of Ceylon PLC changed from an associate to investment security. At the time of change, carrying value of the Group including cumulative post-acquisition reserves was considered as the cost of the investment.

34.2 Unquoted ordinary shares Bank/Group

As at 31 December 2020 2019
Number of
ordinary
shares
Cost*

LKR ’000
Fair value

LKR ’000
Number of
ordinary
shares
Cost*

LKR ’000
Fair value

LKR ’000
Credit Information Bureau of Sri Lanka 9,184 918 192,708 9,184 918 181,972
Lanka Clear (Private) Limited 100,000 1,000 17,717 100,000 1,000 15,000
Lanka Financial Services Bureau Limited 200,000 2,000 200,000 2,000
Samson Reclaim Rubber Limited 116,700 116,700
Society for Worldwide Interbank Financial Telecommunication 6 3,385 3,385 6 3,385 3,385
Sun Tan Beach Resorts Limited 9,059,013 9,059,013
The Video Team (Private) Limited 30,000 30,000
Total unquoted ordinary shares 7,303 213,810 7,303 200,357

* Cost is reduced by write-off of diminution in value other than temporary in respect of Investments .

34.3 Unquoted irredeemable preference shares Bank/Group

As at 31 December 2020 2019
Number of
preference
shares
Cost

LKR ’000
Fair
value*
LKR ’000
Number of
preference
shares
Cost

LKR ’000
Fair
value
LKR ’000
Arpico Finance Company PLC 50,000 500 500 50,000 500 500
Total investments in unquoted irredeemable preference shares 500 500 500 500

34.4 Equity securities

34.4.1 Composition*

34.4.1.1 Bank
Ordinary Shares Preference shares Total
As at 31 December Quoted
LKR ’000
Unquoted
LKR ’000
Unquoted
LKR ’000
2020
LKR ’000
2019
LKR ’000
Performing investments 12,299,552 210,425 12,509,977 9,013,059
Non-performing investments 3,385 500 3,885 500
12,299,552 213,810 500 12,513,862 9,013,559
34.4.1.2 Group
Ordinary Shares Preference shares Total
As at 31 December Quoted
LKR ’000
Unquoted
LKR ’000
Unquoted
LKR ’000
2020
LKR ’000
2019
LKR ’000
Performing investments 12,299,552 210,425 12,509,977 9,013,059
Non-performing investments 3,385 500 3,885 500
12,299,552 213,810 500 12,513,862 9,013,559

* Disclosure as per the Direction on the prudential norms for classification, valuation and operation of the Bank’s investment portfolio.

34.5 Government of Sri Lanka Treasury Bills – By collateralisation

Bank Group
As at 31 December 2020
LKR ’000
2019
LKR ’000
2020
LKR ’000
2019
LKR ’000
Pledged as collateral 134,235 530,523 134,235 530,523
Unencumbered 13,035,232 4,283,416 13,035,232 4,283,416
13,169,467 4,813,939 13,169,467 4,813,939

34.6 Government of Sri Lanka Treasury Bonds – By collateralisation

As at 31 December Bank Group
2020
LKR ’000
2019
LKR ’000
2020
LKR ’000
2019
LKR ’000
Pledged as collateral 8,540,121 16,094,852 8,540,121 16,094,852
Unencumbered 53,562,846 38,675,554 53,562,846 38,675,554
62,102,967 54,770,406 62,102,967 54,770,406

34.7 Movement in impairment during the year

As at 31 December Bank/Group
2020
LKR ’000
2019
LKR ’000
Balance at beginning 14,384
Charge for the year 73,699 14,384
Transferred to financial assets at amortised cost (Note 33.3) (67,231)
Balance as at 31 December 20,852 14,384

Accounting Policy

“Subsidiaries” are entities controlled by the Group.
The Group “controls” an entity if it is exposed to, or has rights to, variable returns from its involvement with the entity and has the ability to affect those returns through its power over the entity. The Group reassesses whether it has control if there are changes to one or more of the elements of control. This includes circumstances in which protective rights held (e.g. those resulting from a lending relationship) become substantive and lead to the Group having power over an investee.

The financial statements of subsidiaries are included in the consolidated financial statements from the date on which control commences until the date on which control ceases.

Bank’s investments in subsidiaries are stated at cost less impairment losses. Reversals of impairment losses are recognised in the income statement, if there has been a change in the estimates used to determine the recoverable amount of the investment.

As at 31 December 2020 2019
Holdings
%
Number
of shares
Cost
LKR ‘000
Market value*/
Directors'
valuation
LKR ‘000
Cost
LKR '000
Market value/
Directors'
valuation
LKR '000
Unquoted
DFCC Consulting (Pvt) Limited 100 500,000 5,000 61,255 5,000 52,731
Lanka Industrial Estates Limited 51.16 8,169,205 97,036 578,549 97,036 538,375
Synapsys Limited 100 31,216,649 135,000 121,866 135,000 113,735
237,036 761,670 237,036 704,841
Less: Allowance for impairment
(Note 35.1)
19,600 19,600 49,600
217,436 742,070 187,436 704,841

35.1 Movements in impairment allowance

As at 31 December 2020
LKR ’000
2019
LKR ’000
Balance at beginning 49,600 70,000
Reversal to income statement (30,000) (20,400)
Balance as at 31 December** 19,600 49,600

*Market value is arrived by using the audited/reviewed financial statements as at the reporting date.

**Based on the internal assessment carried out, the Board was of the view that the impairment as at 31 December 2020 is adequate..

Accounting Policy

Associates are those entities in which the Group has significant influence, but not control or joint control, over the financial and operating policies.

Interest in associates are accounted for using the equity method. They are initially recognised at cost, which includes transaction costs and attributable goodwill. Subsequent to initial recognition, the consolidated financial statements include the Group’s share of the profit or loss and OCI of equity-accounted investees, until the date on which significant influence ceases.

BANK GROUP
As at 31 December 2020
LKR ’000
2019
LKR ’000
2020
LKR ’000
2019
LKR ’000
National Asset Management Limited (ownership 30%)
Balance at beginning 35,270 35,270 31,293 31,107
Share of profit after tax 571 1,262
Share of other comprehensive expenses (165) (330)
Impact on transition to SLFRS 16 (746)
Balance on 31 December 35,270 35,270 31,699 31,293

36.1 Summarised financial information of associate

As at 31 December 2020
LKR ’000
2019
LKR ’000
Percentage ownership interest (%) 30 30
Non-current assets 49,504 56,708
Current assets 81,345 67,472
Non-current liabilities (4,319) (10,458)
Current liabilities (20,917) (9,463)
Net assets (100%) 105,613 104,259
Group’s share of net assets (30%) 31,684 31,278
Goodwill on acquisition 15 15
Adjusted Group’s share of net assets (30%) 31,699 31,293
For the year ended 31 December 2020
LKR ’000
2019
LKR ’000
Revenue 67,440 74,631
Profit after tax (100%) 1,902 4,207
Other comprehensive expenses (100%) (548) (1,102)
Total comprehensive income/(100%) 1,354 3,105
Group's share in profit 571 1,262
Group's share in other comprehensive expenses (165) (330)
Group's share in total comprehensive income 406 932
Contingent liabilities of equity-accounted investee Nil Nil
Capital and other commitments of equity-accounted investee Nil Nil

There are no restrictions on the ability of the associate to transfer funds to the investor in the form of cash dividends, or repayment of loans or advances.

The Company has neither contingent liabilities nor capital and other commitments towards its associate company.

Accounting Policy

A joint venture is an arrangement in which the Group has joint control, whereby the Group has rights to the net assets of the arrangement, rather than rights to its assets and obligations for its liabilities.

Interest in the joint venture is accounted for using the equity method. They are initially recognised at cost, which includes transaction costs and attributable goodwill. Subsequent to initial recognition, the consolidated financial statements include the Group’s share of the profit or loss and OCI of equity-accounted investees, until the date on which joint control ceases.

37.1 Investments in joint venture – Bank

As at 31 December 2020
Cost of
investment
LKR ’000
2019
Cost of
investment
LKR ’000
Acuity Partners (Pvt) Limited (ownership 50%) 755,000 755,000
755,000 755,000

37.2 Investment in joint venture – Group

As at 31 December 2020
LKR ’000
2019
LKR ’000
Share of identifiable asset and liabilities of joint venture as at the beginning of the year 2,249,804 2,142,143
Share of unrealised profit on disposal of investments (184,688) (184,688)
Balance at beginning 2,065,116 1,957,455
Adjustment on initial application of SLFRS 16 net of tax (5,972)
Share of profit net of tax 407,214 190,019
Share of other comprehensive income/(expenses) 26,932 (920)
Change in holding – through subsidiary of joint venture 34
Dividend received during the year (50,000) (75,500)
Group’s share of net assets – 50% 2,449,262 2,065,116

The following table summarises the financial information of Acuity Partners (Pvt) Limited as included in its own financial statements, adjusted for fair value adjustments at acquisition and differences in accounting policies. The table also reconciles the summarised financial information to the carrying amount of the Group’s interest in Acuity Partners (Pvt) Limited.

For the year ended 31 December 2020
LKR ’000
2019
LKR ’000
Percentage ownership interest (%) 50 50
Revenue 1,091,335 1,006,027
Expenses (775,257) (712,503)
Share of profit of equity-accounted investees 794,186 493,522
Income tax reversal/(expense) 91,969 (181,219)
Profit after tax (100%) 1,202,233 605,827
Other comprehensive income/(expenses) (100%) 107,548 (12,700)
Total comprehensive income (100%) 1,309,781 593,127
Profit attributable to equity holders 814,428 380,037
Other comprehensive income/(expenses) attributable to equity holders 53,862 (1,839)
Total comprehensive income attributable to equity holders 868,290 378,199
Group's share in profit (50%) 407,214 190,019
Group's share in other comprehensive income/(expenses) (50%) 26,931 (920)
Group's share in total comprehensive income (50%) 434,145 189,099
Current assets 7,671,324 6,225,285
Non-current assets 19,132,447 11,648,835
Current liabilities (15,881,343) (8,259,697)
Non-current liabilities (2,854,630) (2,606,618)
Net assets attributable to equity holders 5,267,899 4,499,608
As at 31 December 2020
LKR ’000
2019
LKR ’000
Group's share of net assets (50%) – before consolidation adjustment 2,633,950 2,249,804
Share of unrealised profit on disposal investment* (184,688) (184,688)
Groups share of net assets 50% 2,449,262 2,065,116
Contingent liabilities of equity-accounted investee Nil Nil
Capital and other commitments of equity-accounted investee Nil Nil

There are no restrictions on the ability of the joint venture to transfer funds to the investor in the form of cash dividends,
or repayment of loans or advances.

The Bank has neither contingent liabilities nor capital and other commitments towards its joint venture company.

*This to elimination of 50% of the profits on disposal of subsidiary to joint venture company during the year 2010.

Investment property of the Bank/Group is held either to earn rental income or for capital appreciation or for both, but not for sale in the ordinary course of business. The Bank/Group has chosen the cost model instead of fair
value model and therefore investment property is measured at cost. Cost includes expenditure that is directly attributable to the acquisition of the investment property.

Any gain or loss on disposal of an investment property (calculated as the difference between the net proceeds from disposal and the carrying amount of the item) is recognised in the income statement.

Depreciation is provided on a straight-line basis over the estimated life of the class of asset from the date of purchase up to the date of disposal. The useful life for the current and comparative periods of significant items of investment property are as follow:

Building – 20-40 years

Land are not depreciated.

Rental income from investment property is recognised as other revenue on a straight-line basis over the term of the lease. Lease incentives granted are recognised as an integral part of the total rental income, over the term
of the lease.

BANK GROUP
As at 31 December 2020
LKR ’000
2019
LKR ’000
2020
LKR ’000
2019
LKR ’000
Cost
Balance at beginning 9,879 9,879 664,773 665,519
Acquisition 4,489
Transferred to property, plant and equipment (109,543)
Written off during the year (5,235)
Cost as at 31 December 9,879 9,879 555,230 664,773
Less: Accumulated depreciation
Balance at beginning 197,796 168,960
Charge for the year 21,057 28,836
Transferred to property, plant and equipment (9,480)
Accumulated depreciation as at 31 December 209,373 197,796
Carrying amount as at 31 December 9,879 9,879 345,857 466,977

38.1 Details of investment properties

As at 31 December 2020 Buildings sq. ft. Extent of land perches* Number of buildings Cost LKR ’000 Accumulated depreciation/ impairment LKR ’000 Net Book value LKR ’000 Fair value LKR ’000 Date of valuation
4 A,4th Cross Lane,
Borupana, Ratmalana
20.0 2,600 2,600 25,000 31 December 2020
259/30, Kandy Road, Bambarakelle, Nuwara-Eliya 93.5 7,279 7,279 88,800 20 May 2018
Bank 9,879 9,879 113,800
Pattiwila Road,
Sapugaskanda, Makola
482,150 21,920 18 545,351 209,373 335,978 5,413,750 31 March 2019
Group 555,230 209,373 345,857 5,527,550

*1 perch – 25.2929 m2; 1 Sq.ft = 0.0929 m2

The fair value of investment property as at 31 December 2020 situated at Pattiwela Road, Sapugaskanda, Makola was based on market valuations carried out on 31 March 2019 by
Mr Koralege Dayananda Tissera, Chartered Valuation Surveyor (UK) a professional valuer.

The fair value of investment properties situated at Borupana, Ratmalana and Bambarakelle, Nuwara-Eliya valued by Mr A A M Fathihu – Former Government Chief Valuer and Mr J S M I B Karunatilaka. Associate Member
of the Institute of Valuers of Sri Lanka.

38.2 Amounts recognised in profit or loss

Rental income from investment property of Group for 2020, LKR 293 Mn (2019 – LKR 227 Mn).

Operating expenses on investment property of Group for 2020 – LKR 52 Mn (2019 – LKR 43 Mn).

Recognition and measurement

Items of property, plant and equipment are measured at cost less accumulated depreciation and any accumulated impairment losses.

Cost includes expenditure that is directly attributable to the acquisition of the asset.

Any gain or loss on disposal of an item of property, plant and equipment (calculated as the difference between the net proceeds from disposal and the carrying amount of the item)
is recognised in the income statement.

Subsequent costs

Subsequent expenditure is capitalised only when its probable that the future economic benefits of the expenditure will flow to the Group. Ongoing repairs and maintenance costs are expensed as incurred.

Capital work-in-progress

There are expenses of a capital nature directly incurred in the construction of buildings, major plant and machinery and system development, awaiting capitalisation. These are stated in the statement of financial position at cost. Capital work-in-progress would be transferred to the relevant asset when it is available for use i.e. When it is in the location and condition necessary for it to be capable of operating in the manner intended by the Management. Capital work-in-progress is stated at cost less any accumulated impairment losses.

Depreciation

Items of property, plant and equipment are depreciated from the month they are available for use up to the month of disposal. Depreciation is calculated to write-off the cost of items of property, plant and equipment less their estimated residual values using the straight-line basis over their estimated useful lives. Land is not depreciated.

The estimated useful lives for the current and comparative periods of significant items of property, plant and
equipment are as follows:

Years
Buildings 20 – 40
Office equipment and motor vehicles 3 – 5
Fixtures and fittings 10

Derecognition

The carrying amount of property and equipment is derecognised on disposal or when non-future economic benefits are expected from its use of the gain or loss arising from the de-recognition (calculated as the difference between the net proceeds from disposal and the carrying amount of the item) is recognised in the income statement.

Reclassification to investment property

When the use of a property changes from owner-occupied to investment property, the property is remeasured to fair value and reclassified accordingly. Any gain arising on this remeasurement is recognised in profit or loss to the extent that it reverses a previous impairment loss on the specific property, with any remaining gain recognised in OCI and presented in the revaluation reserve. Any loss is recognised in income statement.

39.1 Reconciliation of carrying amount – Bank

Land and buildings LKR ’000 Right-of-use asset LKR ’000 Office equipment LKR ’000 Furniture and fittings LKR ’000 Motor vehicles LKR ’000 Work- in-progress LKR ’000 Total 31 December 2020
LKR ’000
Total 31 December 2019
LKR ’000
Cost at beginning 668,985 1,659,887 2,432,048 1,180,130 302,393 178,582 6,422,025 4,348,831
Recongnistion of
right-of-use asset an initial application of SLFRS 16
1,248,463
Adjusted balance at beginning 668,985 1,659,887 2,432,048 1,180,130 302,393 178,582 6,422,025 5,597,294
Acquisitions 27,310 315,128 161,169 146,180 239,120 888,907 1,001,506
Transfer from work in progress 356,505 45,635 (402,140)
Less: Disposals 110,759 85 3,080 113,924 176,775
Cost as at 31 December 1,052,800 1,864,256 2,638,767 1,323,230 302,393 15,562 7,197,008 6,422,025
Accumulated depreciation
at beginning
256,148 273,620 1,726,636 720,578 214,199 3,191,182 2,728,456
Depreciation for the year 8,316 292,457 266,601 82,988 25,556 675,918 624,077
Less: Accumulated depreciation on disposals 74,085 2,607 76,692 161,351
Accumulated depreciation as at 31 December 264,464 491,992 1,993,237 800,959 239,755 3,790,408 3,191,182
Carrying value as at 31 December 788,336 1,372,264 645,530 522,271 62,638 15,562 3,406,600
Carrying value as at 31 December 412,837 1,386,267 705,411 459,552 88,194 178,582 3,230,843

39.1.1 List of freehold lands and buildings

Number of buildings in land holdings Buildings Sq. ft. Extent of land Perches* Cost LKR ’000 Accumulated depreciation LKR ’000 Carrying amount LKR ’000
73/5, Galle Road, Colombo 3 1 57,190 106.61 85,518 79,613 5,905
5, Deva Veediya, Kandy 1 4,600 12.54 16,195 7,933 8,262
73, W A D Ramanayake Mawatha, Colombo 2 1 37,538 45.00 197,268 139,351 57,917
No. 454, Main Street, Negombo 1 19,087 29.00 170,325 36,297 134,028
No. 77, Colombo Road, Kurunegala 1 31,459 30.00 583,494 1,270 582,224
1,052,800 264,464 788,336

* 1 perch = 25.2929 m2; 1 Sq.ft = 0.0929 m2

39.1.2 Market value of properties

LKR Mn Date of valuation
73/5, Galle Road, Colombo 3 1,905 31 December 2020
5, Deva Veediya, Kandy 140 31 December 2020
73, W A D Ramanayake Mawatha, Colombo 2 878 31 December 2020
No. 454, Main Street, Negombo 275 18 May 2019
No. 77, Colombo Road, Kurunegala 600 31 December 2020

Valued by Mr A A M Fathihu – Former Government Chief Valuer and Mr R W M S B Rajapakse. Fellow Member of the Institute of Valuers of Sri Lanka.

39.1.3 Fully depreciated property, plant and equipment – Bank

The initial cost of fully depreciated property, plant and equipment, which are still in use as at the reporting date is as follows:

As at 31 December 2020
LKR ’000
2019
LKR ’000
Land and buildings 206,835 199,702
Office equipment 1,326,555 1,195,006
Furniture and fittings 462,616 392,578
Motor vehicles 156,447 174,611
2,152,453 1,961,897

39.2 Reconciliation of carrying amount – Group

Land and building LKR ’000 Right-of-use asset LKR ’000 Office equipment LKR ’000 Furniture and fittings LKR ’000 Motor vehicles LKR ’000 Work-in- progress LKR ’000 Total 31 December 2020 LKR ’000 Total 31 December 2019
LKR ’000
Cost at beginning 922,386 1,661,987 2,479,420 1,194,828 353,720 178,582 6,790,923 4,716,745
Recongnistion of right-of-use asset an initial application of SLFRS 16 1,250,563
Adjusted balance at beginning 922,386 1,661,987 2,479,420 1,194,828 353,720 178,582 6,790,923 5,967,308
Acquisitions 29,408 315,128 163,726 146,308 258,480 913,050 1,006,824
Transfer from work in progress 356,505 45,635 (402,140)
Transfer from
Investment property
109,543 109,543
Less: Disposals 4,314 110,759 599 3,328 12,447 131,447 183,209
Cost as at 31 December 1,413,528 1,866,356 2,688,182 1,337,808 341,273 34,922 7,682,069 6,790,923
Accumulated depreciation
at beginning
433,420 275,420 1,766,276 739,538 263,628 3,478,282 2,997,841
Depreciation for the year 25,526 292,757 271,148 83,594 27,401 700,426 648,225
Less: Accumulated depreciation on disposals 4,085 74,085 536 2,607 11,825 93,138 167,784
Transfer from Investment property 9,480 9,480
Accumulated depreciation
as at 31 December
464,341 494,092 2,036,888 820,525 279,204 4,095,050 3,478,282
Carrying amount
as at 31 Decemb
er
949,187 1,372,264 651,294 517,283 62,069 34,922 3,587,019
Carrying amount
as at 31 December
488,966 1,386,567 713,144 455,290 90,092 178,582 3,312,641

39.3 Title restriction on property, plant and equipment

There are no restrictions that existed on the title of property, plant and equipment of the Bank/Group as at the reporting date.

39.4 Acquisition of property, plant and equipment during the year

During the financial year, the Bank and the Group acquired property, plant and equipment to the aggregate value of LKR 889 Mn and LKR 913 Mn respectively (2019 – LKR 1,002 Mn and LKR 1,007 Mn respectively). Cash payments amounting to LKR 843 Mn and LKR 867 Mn respectively (2019 – LKR 567 Mn and LKR 573 Mn respectively) were made during the year for purchase of property plant and equipment by the Bank and the Group.

39.5 Disposal of property, plant and equipment during the year

During the financial year, the Bank and the Group disposed property, plant and equipment to the aggregate value of LKR 114 Mn and LKR 131 Mn respectively (2019 – LKR 177 Mn and LKR 183 Mn respectively). Gain/(loss) on disposal of property, plant and equipment is disclosed in Note 16 to the financial statements.

39.6 Capitalisation of borrowing costs

There were no capitalised borrowing costs relating to the acquisition of property, plant and equipment during the year (2019 – Nil).

39.7 Amount of contractual commitments for the acquisition of property, plant and equipment

The contractual commitments for the acquisition of property, plant and equipment as at the reporting date is LKR 408 Mn.

39.8 Impairment of property, plant and equipment

Impairment exists when the carrying value of an asset or cash-generating unit exceeds its recoverable amount, which is the higher of its fair value less costs to sell and its value in use (VIU). The fair value less costs to sell calculation is based on available data from an active market, in an arm’s length transaction, of similar assets or observable market prices less incremental costs for disposing of the asset. The value in use calculation is based on a discounted cash flow model. The cash flows are derived from the budget for the next five years and do not include restructuring activities that the Group is not yet committed to or significant future investments that will enhance the asset’s performance of the cash-generating unit being tested. The recoverable amount is most sensitive to the discount rate used for the discounted cash flow model as well as the expected future cash inflows and the growth rate used for extrapolation purposes.

The Management has assessed the potential impairment loss of property, plant and equipment as at 31 December 2020. Based on the assessment, no impairment provision is required to be made in the Financial Statements as at the reporting date in respect of property, plant and equipment.

39.9 Property, plant and equipment pledged as security

None of the property, plant or equipment have been pledged as security as at the reporting date.

39.10 Permanent fall in value of property, plant and equipment

There has been no permanent fall in value of PPE which require an impairment provision in the financial statements.

39.11 Temporarily idle property, plant and equipment

There are no temporarily idle property, plant or equipment as at the reporting date.

39.12 Compensation from third parties for items of property, plant and equipment

There were no compensation received/receivable from third parties for items of property, plant or equipment that were impaired, lost or given up.

Accounting Policy

Recognition and measurement

Goodwill

Goodwill arising on the acquisition of subsidiaries is measured at cost less accumulated impairment losses.

Other intangible assets

Other intangible assets, including customer relationships, patents and trademarks, that are acquired by the Group and have finite useful lives are measured at cost less accumulated amortisation and any accumulated impairment losses.

Subsequent expenditure

Subsequent expenditure is capitalised only when it increases the future economic benefits embodied in the specific asset to which it relates. All other expenditure, including expenditure on internally generated goodwill and brands, is recognised in profit or loss as incurred.

Amortisation

Amortisation is calculated to write-off the cost of intangible assets less their estimated residual values using the straight-line method over their estimated useful lives,
and is generally recognised in profit or loss. Goodwill is not amortised.

The estimated useful lives for current and comparative periods are as follows:

Computer software 3 – 15 years

Amortisation methods, useful lives and residual values are reviewed at each reporting date and adjusted if appropriate.

Derecognition

An intangible asset is derecognised on disposal or when no future economic benefits are expected from its use and subsequent disposal.

BANK GROUP
As at 31 December Note 2020
LKR ’000
2019
LKR ’000
2020
LKR ’000
2019
LKR ’000
Computer software 40.1 809,947 838,472 825,475 859,736
Software under development 40.2 903,105 346,187 903,105 346,187
Goodwill on consolidation 40.3 156,226 156,226
Total 1,713,052 1,184,659 1,884,806 1,362,149

40.1 Computer software

BANK GROUP
As at 31 December 2020
LKR ’000
2019
LKR ’000
2020
LKR ’000
2019
LKR ’000
Cost at beginning 2,137,421 1,722,199 2,168,731 1,730,041
Acquisitions 315,082 316,962 315,082 325,543
Disposals (112,478) (112,478)
Transfer from prepayments 98,260 113,147
Cost as at 31 December 2,340,025 2,137,421 2,371,335 2,168,731
Accumulated amortisation at beginning 1,298,949 1,079,370 1,308,995 1,084,646
Amortisation for the year 243,739 219,579 249,475 224,349
Less: Accumulated deprecation on disposal (12,610) (12,610)
Accumulated amortisation as at 31 December 1,530,078 1,298,949 1,545,860 1,308,995
Carrying amount as at 31 December 809,947 838,472 825,475 859,736

40.2 Software under development

BANK GROUP
As at 31 December 2020
LKR ’000
2019
LKR ’000
2020
LKR ’000
2019
LKR ’000
As at beginning 346,187 26,005 346,187 40,893
Addition to work in progress 556,918 418,442 556,918 418,442
Transfers/adjustments (98,260) (113,148)
Cost as at 31 December 903,105 346,187 903,105 346,187

40.3 Goodwill on consolidation

GROUP
As at 31 December 2020
LKR ’000
2019
LKR ’000
DFCC Vardhana Bank PLC 146,603 146,603
Lanka Industrial Estates Limited 9,623 9,623
156,226 156,226

In accordance with the provisions of part VIII of the Companies Act, DFCC Vardhana Bank PLC (DVB) has been amalgamated with DFCC Bank PLC with effect from 1 October 2015. The amalgamation between two entities is considered as a common control transaction, as DFCC Bank continues to control the operations of DVB after amalgamation. Thus the results of amalgamation of two entities are economically the same before and after the amalgamation as the entity will have identical net assets. Therefore DFCC will continue to record carrying values including the remaining goodwill that resulted from the original acquisition of DVB in the consolidated financial statements.

There were no impairment losses recognised in goodwill as at 31 December 2020.

40.4 Assessment of impairment of intangible assets

The Board of Directors has assessed the potential impairment loss of intangible assets as at 31 December 2020. Based on the assessment, no impairment provision is required to be made in the Financial Statements as at the reporting date.

40.5 Title restriction on intangible assets

There are no restrictions that existed on the title of the intangible assets of the Group as at the reporting date.

40.6 Intangible assets pledged as security

None of the Intangible assets have been pledged as security as at the reporting date.

40.7 Acquisition of intangible assets during the year

During the financial year, the Bank and the Group acquired intangible assets to the aggregate value of LKR 872 Mn and LKR 872 Mn respectively (2019 – LKR 735 Mn and LKR 743 Mn respectively). Cash payments amounting to LKR 839 Mn and LKR 839 Mn respectively (2019 – LKR 700 Mn and LKR 705 Mn) were made for purchase intangible assets by the Bank and the Group respectively, during the year.

40.8 Amount of contractual commitments for the acquisition of intangible assets

The contractual commitments for the acquisition of intangible assets as at the reporting date is LKR 348 Mn.

Accounting policy in Note 22.

BANK GROUP
As at 31 December 2020
LKR ’000
2019
LKR ’000
2020
LKR ’000
2019
LKR ’000
Deferred tax asset/liability
Deferred tax liability (Note 41.1) 243,949 341,691 96,714
Deferred tax asset (Note 41.2) 308,853 2,919 314,029
Net deferred tax liability/asset 243,949 308,853 338,772 217,315

41.1 Deferred tax liability

BANK GROUP
As at 31 December 2020
LKR ’000
2019
LKR ’000
2020
LKR ’000
2019
LKR ’000
Balance at beginning 1,183,340 927,029 1,282,125 1,019,562
Recognised in income statement (184,386) (118,076) (181,029) (111,824)
Recognised in other comprehensive income 777,396 374,387 777,396 374,387
1,776,350 1,183,340 1,878,492 1,282,125
Transferred from deferred tax asset (1,532,401) (1,183,340) (1,536,801) (1,185,411)
243,949 341,691 96,714

41.2 Deferred tax asset

BANK GROUP
As at 31 December 2020
LKR ’000
2019
LKR ’000
2020
LKR ’000
2019
LKR ’000
Balance at beginning 1,492,193 1,418,552 1,499,440 1,421,838
Effect of foreign currency movement (457) 438 (457) 438
Recognised in income statement 67,465 155,808 67,562 159,811
Recognised in other comprehensive income (26,800) (82,605) (26,825) (82,647)
1,532,401 1,492,193 1,539,720 1,499,440
Offset against deferred tax liability (1,532,401) (1,183,340) (1,536,801) (1,185,411)
308,853 2,919 314,029

41.3 Recognised deferred tax assets and liabilities

BANK GROUP
2020 2019 2020 2019
As at 31 December Temporary
difference
LKR ’000
Tax effect

LKR ’000
Temporary
difference
LKR ’000
Tax effect

LKR ’000
Temporary
difference
LKR ’000
Tax effect

LKR ’000
Temporary
difference
LKR ’000
Tax effect

LKR ’000
Assets
Gratuity liability and actuarial
losses on defined benefit plans
519,314 145,408 501,086 140,304 536,437 150,202 516,125 144,515
Unutilised tax losses 262 73 10,843 3,036
Cross currency swap 311,242 87,148 313,039 87,651 311,242 87,148 313,039 87,651
Expected credit loss –
Loans to and receivables from banks and other customers
4,642,304 1,299,845 4,515,136 1,264,238 4,651,060 1,302,297 4,515,136 1,264,238
5,472,860 1,532,401 5,329,261 1,492,193 5,499,001 1,539,720 5,355,143 1,499,440
Liabilities
Property, equipment and software 777,494 217,698 718,068 201,059 1,000,884 280,247 953,626 267,015
Finance leases 1,331,982 372,955 2,004,804 561,345 1,331,982 372,955 2,004,804 561,345
Fair value through other comprehensive income
financial assets
4,197,085 1,175,184 1,420,672 397,788 4,197,085 1,175,184 1,420,672 397,788
Right of use asset 37,547 10,513 82,672 23,148 37,547 10,513 82,672 23,148
Undistributed profits of the Group 141,404 39,593 117,247 32,829
6,344,108 1,776,350 4,226,216 1,183,340 6,708,902 1,878,492 4,579,021 1,282,125

41.4 Impact due to corporate income tax rate change

The Government has announced a reduction of the income tax rate to 24% from 28% with effect from 1 January 2020 except for Synapsys Limited, where the tax will be abolished from 14%.

As provided in LKAS 12 on “Income taxes”, deferred tax assets and liabilities should be measured at the tax rate that are expected to be applied in the period in which the asset will be realised or the liability will be settled, based on the tax rate (and tax laws) that have been enacted or substantively enacted by the reporting date. As the said amendment to tax rates is yet to be approved by the Parliament and cannot be considered to be legislated, the proposed changes to the tax rates have not been considered to be substantially enacted as at the reporting date. Accordingly, the prevailing income tax rate of 28% has been used for current tax and deferred tax computation as at 31 December 2020.

The Bank has a cumulative net deferred tax asset of LKR 252 Mn recognised through the income statement and net deferred tax liability of LKR 804 Mn recognised through OCI.

Had the Bank applied the reduced income tax rate of 24% to calculate deferred tax assets/liabilities as at 31 December 2020, the net deferred tax liability would have been decreased by LKR 35 Mn and the resulting charge to income statement and the reversal to other comprehensive income for the year would have been LKR 120 Mn and LKR 155 Mn respectively.

See accounting policy in Note 5.3.2.

BANK GROUP
As at 31 December 2020
LKR ’000
2019
LKR ’000
2020
LKR ’000
2019
LKR ’000
Financial assets
Refundable deposits 16,104 15,729 22,384 21,659
Other receivables (Note 42.1) 818,087 885,952 879,152 971,017
Clearing account balances 1,165,085 1,245,377 1,165,085 1,245,377
Due from subsidiaries (Note 42.2) 129 1,509
1,999,405 2,148,567 2,066,621 2,238,053
Non-financial assets
Advances and prepayments (Note 42.3) 1,070,829 1,003,548 1,086,656 1,003,548
Defined benefit asset (Note 48.1) 131,185 131,185
1,070,829 1,134,733 1,086,656 1,134,733
3,070,234 3,283,300 3,153,277 3,372,786

42.1 Includes receivable form Government of Sri Lanka in respect of reimbursement of additional interest paid on Special Deposit Accounts (SDA) interest differential on Special Senior Citizen fixed deposit and interest subsidy on credit lines amounting to LKR 686 Mn as at 31 December 2020. (LKR 275 Mn as at 31 December 2019).

42.2 Due from subsidiaries

BANK
As at 31 December 2020
LKR ’000
2019
LKR ’000
DFCC Consulting (Pvt) Limited 129 1,509
129 1,509

42.3 Advances and prepayments includes LKR 79 Mn incurred by the Bank to acquire computer software, and LKR 34 Mn related to Synapsys Limited.

The maturity analysis of other assets is given in Note 8.3.3.

Accounting Policy

Non-current assets, or disposal groups comprising assets and liabilities, are classified as held for sale if it is highly probable that they will be recovered primarily through sale rather than through continuing use.

Such assets, or disposal groups, are generally measured at the lower of their carrying amount and fair value less costs to sell. Any impairment loss on a disposal group is allocated first to goodwill, and then to the remaining assets and liabilities on a pro rata basis, except that no loss is allocated to inventories, financial assets, deferred tax assets, employee benefit assets, investment property or biological assets, which continue to be measured in accordance with the Group’s other accounting policies. Impairment losses on initial classification as held for sale or held for distribution and subsequent gains and losses on remeasurement are recognised in profit or loss.

Once classified as held for sale, intangible assets and property, plant and equipment are no longer amortised or depreciated, and any equity-accounted investee is no longer equity accounted.

GROUP
As at 31 December 2020
LKR ’000
2019
LKR ’000
Balance at beginning 40,000
Investment in subsidiary classified as held for sale during the year 40,000
Proceeds from disposal (20,400)
Balance as at 31 December 19,600 40,000

The Company transferred it’s internally developed intangible asset named, “Tea Integrated Payment System (TIPS)” to Company’s subsidiary “Agrithmics (Pvt) Ltd.” on 18 December 2019 for LKR 40 Mn.

Synapsys incorporated “Agrithmics Private Limited” a fully-owned subsidiary on 8 February 2018 with the expectation of transferring companies’ Agribusiness section (TIPS) to this subsidiary. On 18 December 2019, Company has transferred Companie’s internally developed intangible asset “(TIPS)” to Agrithmics (Pvt) Ltd. for fair value of LKR 40 Mn and in return Agrithmics (Pvt) Ltd. has issued four million equity shares for total consideration of LKR 40 Mn to the Company, granting it control of Agrithmics (Pvt) Ltd. The Company has recognised the gain on transferring the intangible asset under other income in the financials as explained in Note 7 to these financials.

Further, the Company entered into an agreement to transfer up to 90% of the equity interest of Agrithmics (Pvt) Ltd. to Dialog Axiata Digital Innovation Fund (Pvt) Ltd. (“DIF”) on 31 December 2019. Accordingly, as the first phase, 51% equity interest was transferred and transaction has been completed on 26 March 2020. Second phase to sell the 39% for the consideration of LKR 15,600,000 by next year. As per the signed agreement, as the second phase, balance 1,560,000 shares (39% holding) will be transferred to DIF no later than 1 year from first completion date, which falls on 26 March 2021. Therefore the Company has classified the investment in Agrithmics (Pvt) Ltd. as a disposal group in the financial statements in accordance with SLFRS 5.

The Group has not consolidated the financial results of Agrithmics in these financial statements since the said investment in Agrithmics has been classified as asset held for sale as at the reporting date.

43.1 Impairment losses relating to disposal group

There was no impairment losses to be recognised in the financial statements for the year ended 31 December 2020, in respect of the asset held for sale as its carrying value was based on the third party offer made for the software.

43.2 Cumulative income or expenses included in OCI

There are no cumulative income or expenses included in OCI relating to the asset held for sale.

43.3 Measurement of fair values

Fair value hierarchy

The non-recurring fair value measurement for the asset held for sale of LKR 19.6 Mn (after costs to sell) has been categorised as a Level 3 fair value based on the inputs to the valuation technique used.

See accounting policy in Note 5.3.2.

These represent call money borrowings, credit balances in nostro accounts and borrowings from banks. Subsequent to initial recognition, these are measured at amortised cost using the EIR method. Interest paid/payable on these borrowings are recognised in income statement.

BANK GROUP
As at 31 December 2020
LKR ’000
2019
LKR ’000
2020
LKR ’000
2019
LKR ’000
Borrowings – Foreign banks 7,725,972 6,343,513 7,725,972 6,343,513
– Local banks 7,183,965 14,648,882 7,183,965 14,648,882
Securities sold under repurchase (Repo) agreements 3,602,433 3,602,433
14,909,937 24,594,828 14,909,937 24,594,828

The maturity analysis of due to banks is given in Note 8.3.3.

See accounting policy in Note 5.3.2.2.1.

BANK GROUP
As at 31 December 2020
LKR ’000
2019
LKR ’000
2020
LKR ’000
2019
LKR ’000
Total amount due to depositors 310,026,892 247,786,974 309,566,423 247,457,696

45.1 Analysis

45.1.1 By product

BANK GROUP
As at 31 December 2020
LKR ’000
2019
LKR ’000
2020
LKR ’000
2019
LKR ’000
Demand deposits (current accounts) 8,016,789 5,021,910 8,016,724 5,021,860
Savings deposits 65,048,922 50,847,818 65,004,141 50,816,178
Fixed deposits 232,153,438 190,178,094 231,737,815 189,880,506
Certificate of deposits 2,473,374 838,979 2,473,374 838,979
Other deposits 2,334,369 900,173 2,334,369 900,173
310,026,892 247,786,974 309,566,423 247,457,696

45.1.2 By currency

BANK GROUP
As at 31 December 2020
LKR ’000
2019
LKR ’000
2020
LKR ’000
2019
LKR ’000
Sri Lanka Rupee 266,794,993 200,933,935 266,352,671 200,614,380
United States Dollar (USD) 36,948,552 44,140,636 36,930,405 44,130,913
Great Britain Pound (GBP) 2,989,372 1,023,696 2,989,372 1,023,696
Others 3,293,975 1,688,707 3,293,975 1,688,707
310,026,892 247,786,974 309,566,423 247,457,696

45.1.3 By institution/customers

BANK GROUP
As at 31 December 2020
LKR ’000
2019
LKR ’000
2020
LKR ’000
2019
LKR ’000
Deposits from banks 1,959,565 2,342,417 1,959,565 2,342,417
Deposits from finance companies 2,383,009 1,738,402 2,383,009 1,738,402
Deposits from other customers 305,684,318 243,706,155 305,223,849 243,376,877
310,026,892 247,786,974 309,566,423 247,457,696

The maturity analysis of deposits from customers is given in Note 8.3.3.

See accounting policy in Note 5.3.2.2.1.

BANK GROUP
As at 31 December 2020
LKR ’000
2019
LKR ’000
2020
LKR ’000
2019
LKR ’000
Repayable in foreign currency
Borrowing sourced from
Multilateral institutions 1,764,889 2,281,613 1,764,889 2,281,613
Bilateral institutions 11,200,561 14,725,462 11,200,561 14,725,462
12,965,450 17,007,075 12,965,450 17,007,075
Repayable in Rupees
Borrowing sourced from
Multilateral institutions 16,977,899 17,862,168 16,977,899 17,862,168
Bilateral institutions 1,144,446 1,465,330 1,144,446 1,465,330
Central Bank of Sri Lanka – Refinance loans (secured) 8,601,350 129,897 8,601,350 129,897
Securities sold under repurchase (Repo) agreements 7,157,931 10,843,086 7,157,931 10,843,086
33,881,626 30,300,481 33,881,626 30,300,481
46,847,076 47,307,556 46,847,076 47,307,556

46.1 Assets pledged as security

Nature 31 December 2020
LKR ’000
31 December 2019
LKR ’000
Assignment in terms of Section 88 A of the Monetary Law
of Loans refinanced by Central Bank
8,601,350 129,897

See accounting policy in Note 5.3.2.2.1.

47.1 Debt securities at amortised cost issued by Bank

BANK/GROUP
Face value LKR ’000 Interest rate % Repayment terms Issue date Maturity date 31 December 2020
LKR ’000
31 December 2019
LKR ’000
Debenture issue –(LKR)
- Listed
3,804,760 13.50 5 years 28 March 19 28 March 24 4,182,678 4,179,217
1,784,070 13.75 7 years 28 March 19 28 March 26 1,963,980 1,962,734
4,411,170 13.90 10 years 28 March 19 28 March 29 4,859,525 4,856,986
3,000,000 9.10 5 years 10 June15 10 June 20 3,149,261
- Unlisted
5,000,000 11.00 5 years 12 June 20 12 June 25 5,285,096
18,000,000 16,291,279 14,148,198
Due within one year 3,149,261
Due after one year 16,291,279 10,998,937
16,291,279 14,148,198

47.2 Carrying values are the discounted amounts of principal and interest.

47.3 There were no debt securities in issue designated as FVTPL.

47.4 The Bank/Group did not have any defaults of principle or interest or other breaches with respect to its debt securities during the years ended 31 December 2020.

47.5 Debt securities issued – Listed debentures

Debenture category Interest
payable
frequency
Applicable
interest
rate
%
Interest
rate of
comparative
Government
Securities
p.a %
Balance as at
31.12.2020
LKR ’000
Market price Yield last
traded
%
Highest Lowest Last traded
Fixed Rate
Listed
2019/2024 Annually 13.50 6.22 4,182,678 N/T N/T N/T N/T
2019/2026 Annually 13.75 6.73 1,963,980 N/T N/T N/T N/T
2019/2029 Annually 13.90 7.26 4,859,525 N/T N/T N/T N/T
Unlisted
2020/2025 Annually 11.00 6.62 5,285,096 N/T N/T N/T N/T

N/T – Not traded

Other ratios 31 December 2020 31 December 2019
Debt to equity ratio 2.06 2.03
Interest cover 1.52 1.44
Liquid asset ratio (%) 34.99 26.89

47.6 Disclosures regarding the utilisation of funds as per the objectives stated in the debenture prospectus

Objective as per prospectus Amount allocated as per prospectus (LKR) Proposed date of allocation as per prospectus Amount allocated from proceeds (LKR) (A) % of
total proceeds
Amount utilised
as at 31 December 2020 (LKR) (B)
% of utilisation against
allocation
(B/A)
Clarification if not fully utilised including where the funds are invested (e.g. whether lent to related party/ieas etc.)
To support the Bank’s balance sheet growth Intial issue of
LKR 5 Bn. and a maximum issue
of LKR 7 Bn.
Upon the allotment of the Debentures LKR 4.523 Bn 100% LKR 4.523 Bn 100% N/A
To improve the capital adequacy ratio Over the period of twelve (12) months from the date of Allotment LKR 4.523 Bn 100% LKR 4.523 Bn 100% N/A

Accounting Policy

A. Defined contribution plans

Obligations for contributions to defined contribution plans are expensed as the related service is provided and recognised as personnel expenses in profit or loss. Prepaid contributions are recognised as an asset to the extent that a cash refund or a reduction in future payments is available.

This provides for a lump sum payment on termination of employment by resignation, retirement at the age of 55 years or death while in service. Lump sum payment is by an outside agency to which contributions are made.

All employees of the Bank are members of the Mercantile Service Provident Society and the Employees’ Trust Fund Board to which the Bank contributes 15% and 3% respectively of such employee’s consolidated salary.

Other subsidiary companies of the Group contribute to the Employees’ Provident Fund and Employees’ Trust Fund in the range of 12% – 15% and 3% respectively.

Contributions to defined contribution plans are recognised as an expense in the income statement as incurred.

B. Defined benefit plans (DBPs)

A defined benefit plan is a post-employment benefit plan other than a defined contribution plan as defined in the Sri Lanka Accounting Standard – LKAS 19 on “Employee Benefits”.

Pension liability arising from defined benefit obligations

Description of the plan and employee groups covered

The Bank established a trust fund in May 1989, for payment of pension which operates the pension scheme approved by the Commissioner General of Inland Revenue. The fund of the scheme is managed by trustees appointed by the Bank and is separate from the Bank. The scheme provides for payment of pension to retirees, spouse and minor children of deceased retirees based on pre-retirement salary. All members of the permanent staff who joined prior to 1 May 2004 are covered by this funded pension scheme subject to fulfilment of eligibility conditions prescribed by the Bank.

The scheme was amended on 31 August 1998 and the amended plan will apply to all members of the permanent staff who joined the Bank on or after this date and prior to 1 May 2004. The amendment reduced the scope of the benefit in the interest of long-term sustainability of the pension plan as advised by the independent actuary.

The defined benefit pension plan does not permit any post-retirement increases in pension nor any other benefit (e.g. medical expenses reimbursement).

Funding arrangement

The Bank’s contributions to the Trust Fund are made annually based on the recommendation of an independent actuary. The employees make no contributions to qualify for the basic pension, which is therefore a non-contributory benefit to the employees.

Eligible employees who desire to provide for the payment of pension to spouse and minor children, who survive them are however, required to contribute monthly, an amount based on a percentage of gross emoluments, excluding bonus, if they joined the Bank on or after 31 August 1998 and prior to 1 May 2004.

Recognition of actuarial gains and losses

The net actuarial gains or losses arising in a financial year is due to increases or decreases in either the present value of the promised pension benefit obligation or the fair value of pension assets.

The causes for such gains or losses include changes in the discount rate, differences between the actual return, and the expected return on pension assets and changes in the estimates of actual employee turnover, mortality rates, and increases in salary.

The Group recognises the total actuarial gains and losses that arise in calculating the Group’s obligation in respect of the plan in other comprehensive income and the expense under personnel expenses in the income statement during the period in which it occurs.

Recognition of past service cost

Past service cost arises when a defined benefit plan is introduced for the first time or subsequent changes are made to the benefits payable under an existing defined benefit plan. Group will recognise past service cost as an expense on a straight-line basis over the average period until the benefits become vested. To the extent the benefits are already vested following the introduction of or changes to a defined benefit plan, the Group will recognise past service cost immediately.

Provision for end of service gratuity liability under a defined benefit plan

Description of the plan and employee groups covered

The Group provides for the gratuity payable under the Payment of Gratuity Act No. 12 of 1983 as amended for all employees who do not qualify under the pension scheme. Therefore, this applies to employees recruited to the permanent cadre on or after 1 May 2004 on tenured or fixed term contract employment in the Bank. The subsidiary companies, which do not have a non-contributory pension scheme provide for the gratuity payable under the Payment of Gratuity Act No. 12 of 1983 for all employees. The promised benefit is half a month pre-termination salary for each completed year of service, provided a minimum qualifying period of five years is served prior to termination of employment.


The Group however, recognises the liability by way of a provision for all employees in tenured employment from the date they joined the permanent cadre, while fixed term employees liability is recognised only if the fixed term contract of service provides for unbroken service of five years or more either singly or together with consecutive contracts.

Funding arrangement

The Bank and the subsidiaries adopt a pay-as-you-go method whereby the employer makes a lump-sum payment only on termination of employment by resignation, retirement at the age of 55 years or death while in service.

Recognition of actuarial gains and losses

The Group recognises the total actuarial gains and losses in the other comprehensive income during the period in which it occurs.

Recognition of past service cost

Since end of service gratuity defined benefit is a statutory benefit, the recognition of past service cost will arise only if the Payment of Gratuity Act No. 12 of 1983 is amended in future to increase the promised benefit on termination of employment. In such event, the Bank will adopt the accounting policy currently used for defined benefit pension plan.

48.1 Composition

BANK GROUP
As at 31 December 2020
LKR ’000
2019
LKR ’000
2020
LKR ’000
2019
LKR ’000
Liability
Unfunded defined benefit plans (Note 48.1.1) 582,869 561,104 610,792 586,351
Funded defined benefit plan (Note 48.1.2) 60,249 60,249
643,118 561,104 671,041 586,351
Assets
Funded defined benefit plan (Note 48.1.2) 131,185 131,185

48.1.1 Unfunded defined benefit plans

BANK GROUP
As at 31 December 2020
LKR ’000
2019
LKR ’000
2020
LKR ’000
2019
LKR ’000
Defined benefit
– unfunded pension liability (Note 48.1.1.1)
63,556 60,013 63,556 60,013
– unfunded end of service gratuity (Note 48.1.1.2) 519,313 501,091 547,236 526,338
582,869 561,104 610,792 586,351
48.1.1.1 Unfunded pension liability
BANK/Group
As at 31 December 2020
LKR ’000
2019
LKR ’000
Balance at beginning 60,013 60,573
Interest on obligation 5,625 5,678
Benefits paid (6,935) (6,995)
Actuarial experience loss 771 757
Loss due to changes in assumptions 4,082
Present value of defined benefit pension obligations 63,556 60,013

This relates to pension liability of an ex-employee, not funded through the DFCC Bank PLC Pension Fund. The liability covers the pension benefit to retiree and survivor.

48.1.1.2 Unfunded end of service gratuity
BANK GROUP
As at 31 December 2020
LKR ’000
2019
LKR ’000
2020
LKR ’000
2019
LKR ’000
Balance at beginning 501,091 348,131 526,338 372,742
Current service cost 78,850 66,582 82,804 71,027
Interest on obligation 50,109 34,813 52,110 36,684
Benefits paid (16,819) (33,135) (19,070) (38,158)
Actuarial experience loss/(gain) (47,834) 84,700 (48,862) 84,043
Gain due to changes in assumptions (46,084) (46,084)
Present value of unfunded end of service gratuity 519,313 501,091 547,236 526,338

48.1.2 Funded defined benefit plan – Pension liability

BANK/Group
As at 31 December 2020
LKR ’000
2019
LKR ’000
Present value of defined benefit pension obligations (Note 48.1.2.1) 2,827,321 2,594,387
Fair value of pension assets (Note 48.1.2.2) (2,767,072) (2,725,572)
Defined benefit liability/(asset) 60,249 (131,185)
48.1.2.1 Movement in defined pension obligation
BANK/Group
As at 31 December 2020
LKR ’000
2019
LKR ’000
Present value of defined benefit pension obligations at the beginning 2,594,387 2,503,310
Current service cost 53,864 54,839
Interest on obligation 259,439 250,331
Benefits paid (198,251) (184,183)
Actuarial experience gain (62,533) (29,910)
Loss due to changes in assumptions 180,415
Present value of defined benefit pension obligations 2,827,321 2,594,387
48.1.2.2 Movement in pension assets
BANK/Group
As at 31 December 2020
LKR ’000
2019
LKR ’000
Fair value of pension assets at the beginning 2,725,572 2,646,527
Expected return on pension assets 248,700 240,353
Benefits paid (198,251) (184,183)
Actuarial experience (loss)/gain (8,949) 22,875
Fair value of pension assets 2,767,072 2,725,572
48.1.2.3 Plan assets consist of the following
BANK/Group
As at 31 December 2020
LKR ’000
2019
LKR ’000
Debentures 195,563 195,563
Fixed deposits 2,594,632 2,564,247
Others (23,123) (34,238)
2,767,072 2,725,572
48.1.2.4 The expected benefit pay out in the future years to the employee retirement
benefits – Bank
As at 31 December 2020 Unfunded
pension liability*
LKR ’000
Unfunded end of
service gratuity *
LKR ’000
Funded
pension liability*
LKR ’000
Within next 12 months 6,934 32,016 216,867
Between 2 and 5 years 27,736 224,787 1,023,639
Beyond 5 years 34,670 467,653 1,531,833

* Based on expected benefits pay-out in next 10 years

48.2 Actuarial valuation

Actuarial valuation was carried out by Mr Piyal S Goonetilleke, Fellow of the Society of Actuaries USA of Piyal S Goonetilleke & Associates, on 31 December 2020.

48.2.1 Actuarial valuation method

Projected unit credit method was used to allocate the actuarial present value of the projected benefits earned by employees to date of valuation.

48.2.2 Principal actuarial assumptions

As at 31 December 2020 31 December 2019
Pension
benefit
(%)
End of service
gratuity
(%)
Pension
benefit
(%)
End of service
gratuity
(%)
Discount rate per annum
Pre-retirement 9 9 10 10
Post-retirement 9 Not applicable 10 Not applicable
Future salary increases per annum 8.5 8.5 10.5 10.5
Expected rate of return
on pension assets
9 10
Actual rate of return
on pension assets
9.2 10.8
Mortality UP 1984 mortality table RP-2000 mortality table UP 1984 mortality table RP-2000 mortality table
Retirement age 55 years 55 years 55 years 55 years
Normal form of payment: Lump sum commuted pension payment followed by reduced pension for 10 years (25% reduction) (for new entrants recovery period is 15 years) Lump sum Lump sum commuted pension payment followed by reduced pension for 10 years (25% reduction) (for new entrants recovery period is 15 years) Lump sum
Turnover rate –
Age
20 10.0 10.0 10.0 10.0
25 10.0 10.0 10.0 10.0
30 10.0 10.0 10.0 10.0
35 7.5 7.5 7.5 7.5
40 5.0 5.0 5.0 5.0
45 2.5 2.5 2.5 2.5
50/55 1.0 1.0 1.0 1.0

The principle actuarial assumptions in the current year has changed from previous year as presented in the Note 48.2.2. The discount rate is the yield rate on 31 December 2020 with a term equaling the estimated period for which all benefit payments will continue. This period is approximately 19.83 years for pension and 10.6 years for end of service gratuity. The differences in the discount rates for pension and end of service gratuity reflect the differences in the estimated period for benefit payments will continue.

Principal Actuarial Assumptions – Group

The subsidiaries have used discount rates of 9% and the salary increment rate ranging 3% – 8.5%.

The differences in the rate of future annual salary increases reflect the remaining working life of participants for each plan.

48.2.3 Sensitivity of assumptions used in the actuarial valuation

The Following table demonstrates the sensitivity to a reasonably possible change in the key assumptions used with all other variables held constant in the employment benefit liability measurement. The effect in the income statement and the statement of financial position with the assumed changes in the discount rates and salary increment rate is given below:

Effect on other comprehensive income
increase/(decrease)

LKR ’000
Effect on defined
benefit obligation
increase/(decrease)
LKR ’000
Funded pension liability
Discount rate
1% 243,256 (243,256)
-1% (238,602) 238,602
Salary increment rate
1% (14,008) 14,008
-1% 53,895 (53,895)
Unfunded pension liability
Discount rate
1% 4,082 (4,082)
-1% (4,615) 4,615
Unfunded end of service gratuity*
Discount rate
1% 42,159 (42,159)
-1% (48,774) 48,774
Salary increment rate
1% (47,417) 47,417
-1% 41,820 (41,820)

* Salary increment not applicable for ex-employees.

48.3 Historical information

As at 31 December 2019
LKR ’000
31 December 2018
LKR ’000
31 December 2017
LKR ’000
31 March 2016
LKR ’000
31 December 2015
LKR ’000
Present value of the defined
benefit obligation
2,594,387 2,503,310 2,372,248 2,280,943 2,296,454
Fair value of plan assets (2,725,572) (2,646,527) (2,554,068) (2,446,306) (2,237,646)
(Surplus)/deficit in the plan (131,185) (143,217) (181,820) (165,363) 58,808

Accounting policy in Note 22.

BANK GROUP
As at 31 December 2020
LKR ’000
2019
LKR ’000
2020
LKR ’000
2019
LKR ’000
Balance at beginning 581,269 1,221,117 648,178 1,294,540
Provision for the year (Note 22.1) 1,389,508 1,362,295 1,476,304 1,441,255
Reversal of over provision (Note 22.1) (127,252) (173,014) (130,612) (174,133)
Self-assessment payments (765,851) (1,559,324) (826,899) (1,615,790)
Withholding tax/other credits (65,029) (269,805) (85,107) (297,694)
Balance as at 31 December 1,012,645 581,269 1,081,864 648,178

Accounting Policy

Provisions are recognised when it is probable that an outflow of economic benefit will be required to settle a current legal or constructive obligation which has arisen as a result of past events, and for which a reliable estimate can be made of the amount of the obligation.

BANK GROUP
As at 31 December 2020
LKR ’000
2019
LKR ’000
2020
LKR ’000
2019
LKR ’000
Financial liabilities
Prior year’s dividends 44,409 46,981 44,409 46,981
Security deposit for leases 108,598 101,849
Lease liability (Note 59.2) 1,333,069 1,302,528 1,333,069 1,302,701
Account payables 3,394,350 2,430,801 3,414,882 2,456,446
Due to subsidiaries (Note 50.2) 12,049 6,135
4,783,877 3,786,445 4,900,958 3,907,977
Non-financial liabilities
Accruals 614,474 552,874 654,549 571,153
Prepaid loan and lease rentals 23,963 44,298 70,047 112,234
Provision for undrawn commitments (Note 57.1.1) 356,890 180,631 356,890 180,631
Other provisions (Note 50.1) 340,650 494,939 340,650 494,939
1,335,977 1,272,742 1,422,136 1,358,957
6,119,854 5,059,187 6,323,094 5,266,934

50.1 Other provisions

Other provisions includes benefit payable to employees.

BANK GROUP
As at 31 December 2020
LKR ’000
2019
LKR ’000
2020
LKR ’000
2019
LKR ’000
Balance at beginning 494,939 449,007 494,939 449,007
Provisions for the financial year 340,650 449,939 340,650 449,939
Provisions used during the year (214,690) (367,336) (214,690) (367,336)
Provisions reversed during the year (280,249) (36,671) (280,249) (36,671)
Balance as at 31 December 340,650 494,939 340,650 494,939

50.2 Due to subsidiaries

BANK
As at 31 December 2020
LKR ’000
2019
LKR ’000
Synapsys Limited 12,049 6,135
12,049 6,135

Accounting policy in Note 5.3.

These represent the funds borrowed by the Bank/Group for long-term funding requirements. Subsequent to initial recognition these are measured at their amortised cost using the EIR method, except where the Bank/Group
designates them at fair value through profit or loss. Interest paid/payable is recognised in Income Statement.

BANK/GROUP
Face value

LKR ’000
Interest
rate
%
Repayment
terms
Issued
date
Maturity
date
31 December
2020
LKR ’000
31 December
2019
LKR ’000
Listed debentures
Issued by Bank 6,043,140 12.75 7 Years 9 November 16 9 November 23 6,138,994 6,134,277
956,860 12.15 5 Years 9 November 16 9 November 21 976,423 971,190
4,086,530 13.00 7 Years 29 March 18 29 March 25 4,474,581 4,471,362
2,913,470 12.60 5 Years 29 March 18 29 March 23 3,183,389 3,180,325
4,318,000 9.00 5 Years 23 October 20 23 October 25 4,376,259
205,000 9.25 7 Years 23 October 20 25 October 27 207,851
Transferred on amalgamation 2,000,000 9.40 5 Years 10 June 15 10 June 20 2,102,760
20,523,000 19,357,497 16,859,914

51.1 Subordinated term debt – Listed debentures

Debenture category Interest rate
frequency
Applicable
interest
rate %
Interest rate of
comparative
Government
Securities (Gross)
p.a. %
Balance as at
31 December
2020
LKR ’000
Market price
Highest Lowest Last traded
Fixed rate
2016-2021 Annually 12.15 5.05 976,423 N/T N/T N/T
2016-2023 Annually 12.75 6.03 6,138,994 N/T N/T N/T
2018-2025 Annually 13.00 6.55 4,474,581 N/T N/T N/T
2018-2023 Annually 12.60 5.82 3,183,389 N/T N/T N/T
2020-2025 Annually 9.00 6.64 4,376,259 N/T N/T N/T
2020-2027 Annually 9.25 7.02 207,851 N/T N/T N/T
19,357,497

N/T – Not traded.

Debt equity ratio, interest cover and liquid asset ratio is given in Note 47.5.

51.2 Subordinated liabilities by maturity

BANK/GROUP
As at 31 December 2020
LKR ’000
2019
LKR ’000
Payable within one year 976,423 2,102,760
Payable after one year 18,381,074 14,757,154
Total 19,357,497 16,859,914

In the event of the winding-up of the issuer, the above liabilities would be subordinated to the claims of depositors and all other creditors of the issuer. The Bank has not had any defaults of principal, interest or other breaches with respect to its subordinated liabilities during the year ended 31 December 2020.

The maturity analysis of subordinated liabilities is given in Note 8.3.3.

Accounting Policy

Shares are classified as equity when there is no contractual obligation to transfer cash or other financial assets.

Number of ordinary voting shares BANK/Group
As at 31 December 2020 2019 2020
LKR ’000
2019
LKR ’000
Balance at beginning 304,188,756 265,097,688 7,530,371 4,715,814
Rights issue of ordinary voting shares 39,091,068 2,814,557
Issue of ordinary shares as part of the final dividend
satisfied in the form of issue and allotment new shares
1,808,494 152,094
Balance as at 31 December 305,997,250 304,188,756 7,682,465 7,530,371

Ordinary shares in the Bank are recognised at the amount paid per ordinary share. The shares of the Bank quoted on the Colombo Stock Exchange.

The holders of ordinary shares are entitled to receive dividends declared from time to time and are entitled to one vote per share at General Meetings of the Bank.

52.1 The Bank issued ordinary shares during the year 2019 by way of a Rights Issue to the existing shareholders of the Bank in the proportion of two (2) ordinary shares for every five (5) ordinary shares held as at end of trading on 28 March 2019 at an issue price of LKR 72 per share.

Reserve fund

BANK/GROUP
As at 31 December 2020
LKR ’000
2019
LKR ’000
Balance at beginning 2,461,968 2,358,275
Transfers 122,000 103,693
Balance as at 31 December 2,583,968 2,461,968

Five per cent of profit after tax is transferred to the reserve fund as per Direction issued by Central Bank of Sri Lanka under Section 76 (j) (1) of the Banking Act No. 30 of 1988 as amended by Banking (Amendment) Act No. 33 of 1995.

BANK GROUP
As at 31 December 2020
LKR ’000
2019
LKR ’000
2020
LKR ’000
2019
LKR ’000
Balance at beginning 18,228,086 17,187,262 21,278,288 20,107,150
Adjustment on initial application of SLFRS 16, net of tax (6,717)
Restated balance 18,228,086 17,187,262 21,278,288 20,100,433
Profit for the year 2,388,035 2,073,868 2,744,961 2,213,529
Other comprehensive (expense) net of tax (64,063) (8,956) (62,276) (7,249)
Transfers to statutory reserves (122,000) (103,693) (122,000) (103,693)
Dividends (912,566) (927,841) (912,566) (927,841)
Forfeiture of unclaimed dividends 6,664 6,474 6,664 6,474
Disposal of equity investments 128,013 10,222 128,013 5,852
Rights issue expenses (9,250) (9,250)
Change in holding through joint venture 33
Balance as at 31 December 19,652,169 18,228,086 23,061,084 21,278,288

This represents cumulative net earnings, inclusive of final dividend approved amounting to LKR 918 Mn.

The balance is retained and reinvested in the business of the Bank.

BANK
As at 31 December 2020 Fair value
reserve
LKR ’000
Hedging
reserve
LKR ’000
General
reserve
LKR ’000
Total

LKR ’000
Balance at beginning 5,704,644 (225,389) 13,779,839 19,259,094
Movements/transfers 178,167 1,294 179,461
Balance as at 31 December 5,882,811 (224,095) 13,779,839 19,438,555
BANK
As at 31 December 2019 Fair value
reserve
LKR ’000
Hedging
reserve
LKR ’000
General
reserve
LKR ’000
Total

LKR ’000
Balance at beginning 5,745,025 60,168 13,779,839 19,585,032
Movements/transfers (40,381) (285,557) (325,938)
Balance as at 31 December 5,704,644 (225,389) 13,779,839 19,259,094
Group
As at 31 December 2020 Fair value
reserve

LKR ’000
Exchange
equalisation
reserve
LKR ’000
Hedging
reserve

LKR ’000
General
reserve

LKR ’000
Total


LKR ’000
Balance at beginning 4,260,073 78,377 (225,389) 13,779,839 17,892,900
Movements/transfers 179,773 24,677 1,294 205,744
Balance as at 31 December 4,439,846 103,054 (224,095) 13,779,839 18,098,644
Group
As at 31 December 2019 Fair value
reserve

LKR ’000
Exchange
equalisation
reserve
LKR ’000
Hedging
reserve

LKR ’000
General
reserve

LKR ’000
Total


LKR ’000
Balance at beginning 4,293,847 82,835 60,168 13,779,839 18,216,689
Movements/transfers (33,774) (4,458) (285,557) (323,789)
Balance as at 31 December 4,260,073 78,377 (225,389) 13,779,839 17,892,900

55.1 Fair value reserve

The fair value reserve comprises the cumulative net change in fair value of financial assets measured at fair value through other comprehensive income until such investments are derecognised or impaired.

55.2 Hedging reserve

The hedging reserve comprises the effective portion of the cumulative net change in the fair value of hedging instruments used in cash flow hedges pending subsequent recognition in Income Statement as the hedge cash flows affect profit or loss.

55.3 General reserve

The Bank transfers the surplus retained earnings to the general reserve time to time. The purpose of setting up the general reserve is to meet potential future unknown liabilities.

Accounting Policy

Non-controlling interests (NCI) are measured initially at their proportionate share of the acquiree’s identifiable net assets at the date of acquisition.

Changes in the Group’s interest in a subsidiary that do not result in a loss of control are accounted for as equity transactions.

The following table summarises the information relating to each of the Group’s subsidiaries that has material NCI, before any intra-group eliminations:

Lanka Industrial Estates Limited
As at 31 December 2020
LKR ’000
2019
LKR ’000
Non-current assets 509,148 527,777
Current assets 397,075 329,236
Non-current liabilities (98,956) (104,282)
Current liabilities (228,712) (214,358)
Net assets* 578,555 538,373
Net assets attributable to NCI – 48.84% 282,589 262,965
Revenue 350,788 343,200
Profit 208,467 177,640
Other comprehensive expense (615) (254)
Total comprehensive income 207,852 177,386
Profit allocated to NCI – 48.84% 101,824 86,765
Other comprehensive expense allocated to NCI – 48.84% (300) (124)
Cash flows from operating activities 185,848 193,394
Cash flows from investment activities 36,096 6,419
Cash flows from financing activities (167,677) (167,676)
Net increase in cash and cash equivalents 54,267 32,137

*See Note 35

Accounting Policy

Commitments and contingencies

Contingent liabilities, which include guarantees are possible obligations that arise from past events whose existence will be confirmed only by the occurrence, or non-occurrence, of one or more uncertain future events not wholly within the control of the Bank; or are present obligations that have arisen from past events but are not recognised because it is not probable that settlement will require the outflow of economic benefits, or because the amount of the obligations cannot be reliably measured. Contingent liabilities are not recognised in the financial statements but are disclosed unless the probability of settlement is remote.

Even though these obligations may not be recognised on the Statement of Financial Position they do contain credit risk and are there for part of the overall risk of the Bank as disclosed in Note 57.1 below:

Financial guarantees

Liabilities under financial guarantee contracts are recorded initially at their fair value, which is generally the fee received or receivable. Subsequently, financial guarantee liabilities are measured at the higher of the initial fair value, less cumulative amortisation, and the best estimate of the expenditure required to settle the obligations.

57.1 Commitments and contingencies

BANK GROUP
As at 31 December 2020
LKR ’000
2019
LKR ’000
2020
LKR ’000
2019
LKR ’000
Guarantees issued to –
Banks in respect of indebtedness of customers of the Bank 492,690 422,500 492,690 422,500
Companies in respect of indebtedness of
customers of the Bank
8,344,637 9,181,978 8,344,637 9,181,978
Principal collector of customs (duty guarantees) 217,620 344,629 217,620 344,629
Shipping guarantees 2,409,711 1,170,860 2,409,711 1,170,860
Documentary credit 21,340,301 12,958,343 21,340,301 12,958,343
Bills for collection 3,922,026 3,131,185 3,922,026 3,131,185
Performance bonds 4,487,667 5,122,213 4,487,667 5,122,213
Forward exchange contracts 1,187,241 17,089,574 1,187,241 17,089,574
Commitments in ordinary course of business –
Commitments for unutilised credit facilities
87,320,270 78,944,548 87,320,270 78,944,548
Capital expenditure approved by the Board of Directors
Contracted 613,548 567,644 613,548 567,644
Not contracted 428,436 1,656,926 428,436 1,656,926
130,764,147 130,590,400 130,764,147 130,590,400

57.1.1 Movement in impairment during the year

BANK/GROUP
As at 31 December 2020
LKR ’000
2019
LKR ’000
Stage 1
Balance at beginning 164,144 162,686
Charge to income statement 179,454 1,458
Balance as at 31 December 343,598 164,144
Stage 2
Balance at beginning 16,487 34,895
Reversal to income statement (3,195) (18,408)
Balance as at 31 December 13,292 16,487
Total 356,890 180,631

Classified under other liabilities in Note 50.

57.2 Litigation against the Bank

Litigation against the Bank

57.2.1 A client has filed action against five defendants including the Bank in the District Court of Kurunegala, claiming that a property mortgaged by him to the Bank had been unlawfully transferred to a third party under the parate process to be set aside, and also claiming LKR 6 Mn as damages from the Bank. The Bank is defending the case before the District Court.

57.2.2 There are four cases filed in the District Court of Kandy and one case filed in the District Court of Negombo and another case in the District Court of Moratuwa, where third parties are claiming ownership of properties acquired by the Bank under recovery action. The Bank is defending the cases before the respective District Courts.

57.2.3 There is one case filed in the District Court of Bandarawela, where a third party is claiming ownership of a property mortgaged to the Bank. The Bank is defending the case before the District Court.

57.2.4 There is one case filed in the District Court of Teldeniya, where a third party is claiming ownership of a property mortgaged to the Bank. The Bank is defending the case before the District Court of Teldeniya.

57.2.5 A client has filed a case in the District Court of Matara claiming damages from the Bank claiming that as the loan was not disbursed in a lump sum but in instalments based on the client’s progress as such his business went into decline and he suffered losses. The Bank is defending the case before the District Court of Matara.

57.2.6 A Case is filed in the District Court of Galle claiming damages from the Bank and four others.

There are no material litigations that are pending against the Group

57.3 Tax assessments against the Bank/Group

There are no assessments against the Bank/Group on substantive matters by the Department of Inland Revenue which requires disclosures in the financial statements. The Bank/Group is of the view that, tax assessments against the Bank/Group will not have any significant impact on the financial statements.

The Group’s related parties include associate, subsidiaries, trust established by the Bank for post-employment retirement plan, joint venture, Entities which are controlled, or jointly controlled by Key Management Personnel or their close family members.

The Bank carried out transactions in the ordinary course of business on an arm’s length basis at commercial rates with parties who are defined as related parties as per the Sri Lanka Accounting Standard – LKAS 24 on “Related Party Disclosures”, other than, transactions that the Key Management Personnel (KMP) have availed under schemes uniformly applicable to all staff at concessionary rates.

58.1 Parent and ultimate controlling party

The Bank does not have an identifiable parent of its own.

58.2 Transaction with key Management Personnel

58.2.1 Key Management Personnel

Key Management Personnel are the Board of Directors of the Bank including Chief Executive, Deputy Chief Executive, Vice President – Strategic Planning and subsidiaries, Chief Risk Officer, Chief Financial Officer, Chief Operating Officer, and Senior Vice President – Treasury and Resource Mobilisation for the purpose of Sri Lanka Accounting Standard – LKAS 24 on “Related Party Disclosures”.

58.2.2 Compensation of Directors and other Key Management Personnel

BANK GROUP
For the year ended 31 December 2020
LKR ’000
2019
LKR ’000
2020
LKR ’000
2019
LKR ’000
Number of persons 15 15 17 17
Short-term employment benefits 122,884 131,371 142,081 149,315
Post-employment benefits – Pension 2,208 1,976 2,208 1,976
– Others 19,413 19,028 19,930 19,521
144,505 152,375 164,219 170,812

58.2.3 Other transactions with Key Management Personnel and their close family members

Statement of financial position – Bank
As at 31 December 2020 2019
Number of KMPs LKR ’000 Number of KMPs LKR ’000
Assets
Financial assets at amortised cost – Loans to and receivables from other customers 14 27,939 12 29,579
27,939 29,579
Liabilities
Financial liabilities at amortised cost – Due to depositors 27 511,854 26 382,601
Debt securities in issue 1 7,293 1 2,206
519,147 384,807
Contingent liabilities and commitments 18,915 10,963
Income statement – Bank
For the year ended 31 December 2020
LKR ’000
2019
LKR ’000
Interest income 2,236 2,335
Interest expenses 36,534 38,042
Fee and commission income 12 19

58.3 Transaction with entities in which Directors of the Bank have significant influence

Statement of financial position – Bank
As at 31 December 2020
LKR ’000
2019
LKR ’000
Liabilities
Financial liabilities at amortised cost – Due to depositors 486,247 326,428
Debt securities in issue 118,239
486,247 444,667
Contingent liabilities and commitments 1,429 10,000
Income statement – Bank
For the year ended 31 December 2020
LKR ’000
2019
LKR ’000
Interest income 6,554 4,565
Interest expenses 35,708 16,139
Fee and commission income 66 497
Other operating expenses 454 1,134

58.4 Transaction with Group entities

The Group entities include the subsidiaries, associate and joint venture of the Bank.

58.4.1 Transactions with subsidiaries

Statement of financial position – Bank
As at 31 December 2020
LKR ’000
2019
LKR ’000
Assets
Other assets 33,968 33,404
33,968 33,404
Liabilities
Financial liabilities at amortised cost – Due to depositors 461,855 341,179
Other liabilities 12,049 6,135
473,904 347,314
Contingent liabilities and commitments 650 450
Income Statement – Bank
For the year ended 31 December 2020
LKR ’000
2019
LKR ’000
Interest income 5
Interest expenses 34,112 36,117
Fee and commission income 213 38
Other income – Net 89,566 77,166
Other operating expenses net of reimbursements 160,891 116,024
Other transactions – Bank
For the year ended 31 December 2020
LKR ’000
2019
LKR ’000
Payments made for purchase of computer software 23,436 31,961

58.4.2 Transactions with joint venture

Statement of financial position – Bank
As at 31 December 2020
LKR ’000
2019
LKR ’000
Assets
Financial assets at amortised cost – Loans to and receivables from other customers 32,962 41,861
32,962 41,861
Liabilities
Financial liabilities at amortised cost – Due to depositors 493 3,414
493 3,414
Income statement – Bank
For the year ended 31 December 2020
LKR ’000
2019
LKR ’000
Interest income 3,793 12,631
Fee and commission income 2 1,005
Net other operating income 50,000 75,500
Other operating expenses 7,065 17,907

58.4.3 Transactions with associate

Statement of financial position – Bank
As at 31 December 2020
LKR ’000
2019
LKR ’000
Liabilities
Financial liabilities at amortised cost – Due to depositors 27 26
27 26
Income statement – Bank
For the year ended 31 December 2020
LKR ’000
2019
LKR ’000
Fee and commission income 2 18

58.5 Transactions with DFCC Bank Pension Fund – Trust

DFCC Bank Pension Fund constituted as a trust was established by the DFCC Bank to discharge defined benefit pension liability of eligible employees of the Bank.

As at 31 December 2020
LKR ’000
2019
LKR ’000
Contribution prepaid as at beginning 131,185 143,217
Contribution due for the financial year recognised as expense in income statement (64,603) (64,817)
Recognition of actuarial (loss)/gains in the other comprehensive income (126,831) 52,785
Contribution (payable)/prepaid (Note 48.1.2) (60,249) 131,185

58.6 Transactions with Government of Sri Lanka (GOSL) and its related entities

Entities related to the Government of Sri Lanka (GOSL) by virtue of their aggregate shareholdings has the power to participate in the financial and operating policy decision of the Bank and by extension to participate in the financial and operating policy decisions of the Bank. However, in fact this power was not exercised.

Paragraph 25 of Sri Lanka Accounting Standard Related Party Disclosure – LKAS 24 has exempted DFCC Bank from the normally applicable disclosure requirements on transactions with GOSL-related entities. In making use of this exemption the Board has determined that the limited disclosure required under paragraph 26 of LKAS 24 is only required to be made for transaction that are individually significant because of their size although these transactions were undertaken on normal market terms in the ordinary course of business and there was no requirement to disclose the transactions to regulatory or supervisory authorities or require shareholder approval.

58.6.1 Individually significant transactions included in the statement of financial position

Statement of financial position – Bank
As at 31 December 2020
LKR ’000
2019
LKR ’000
Assets
Balances with Central Bank of Sri Lanka 4,901,753 8,666,547
Placements with banks 15,226,885 165,030
Financial assets at amortised cost – Loans to and receivables from banks 1,000,125
Financial assets at amortised cost – Loans to and receivables from
other customers
15,666,984 15,517,585
Financial assets at amortised cost – Debt and other instruments 31,096,296 27,137,225
Financial assets measured at fair value through other comprehensive income 76,204,140 63,702,848
144,096,183 115,189,235
Liabilities
Due to Banks 5,189,468 9,284,419
Financial liabilities at amortised cost – Due to depositors 999,248 2,626,954
Financial liabilities at amortised cost – Due to other borrowers 31,795,422 21,768,994
Debt securities in issue 7,326,159 4,612,231
Subordinated term debt 6,834,973 6,154,314
52,145,270 44,446,912
Commitments
Undrawn credit facilities 624,435 7,438,628
Income statement – Bank
For the year ended 31 December 2020
LKR ’000
2019
LKR ’000
Interest income 9,267,703 8,936,036
Interest expenses 4,069,080 3,852,541
Fee and commission income 511 1,050
Net gain from trading 162 1,532
Net gains from derecognition of financial assets 14,176 7,185

There are no other transactions that are collectively significant with Government-related entities.

58.7 Disclosure requirement under Section 9.3.2 (a) and 9.3.2 (b) of the
CSE Listing Rules

As per Rule No. 9.3.2 (a) the Bank does not have any non-recurrent related party transactions carried out during the financial year under review with a value exceeding 10% of the equity or 5% of the total assets whichever is lower, as per the audited financial statements of the Bank.

As per Rule No. 9.3.2 (b) the Bank does not have any recurrent related party transactions carried out during the financial year under review with value exceeding 10% of the gross revenue/income, as per the latest audited financial statements of the Bank.

58.8 Pricing policy and terms for transactions with related parties

Bank enters into transactions with related parties in the ordinary course of business on terms similar to comparable transactions with an unrelated comparable counterparty with the exception of accommodation granted to Key Management Personnel under approved schemes uniformly applicable to all or specific categories of employees. The terms include pricing for loans, deposits, and services, collateral obtained for loans where appropriate.

Accounting Policy

At inception of a contract, the Group assesses whether a contract is, or contains, a lease. A contract is, or contains, a lease if the contract conveys the right to control the use of an identified asset for a period of time in exchange for consideration. To assess whether a contract conveys the right to control the use of an identified asset, the Group uses the definition of a lease in SLFRS 16.

As a lessee

At commencement or on modification of a contract that contains a lease component, the Group allocates the consideration in the contract to each lease component on the basis of its relative stand-alone prices. However, for the leases of property the Group has elected not to separate non-lease components and account for the lease and non-lease components as a single lease component.

The Group recognises a right-of-use asset and a lease liability at the lease commencement date. The right-of-use asset is initially measured at cost, which comprises the initial amount of the lease liability adjusted for any lease payments made or payable at or before the commencement date, plus any initial direct costs incurred and an estimate of costs to dismantle and
remove the underlying asset or to restore the underlying asset or the site on which it is located, less any lease incentives received.

The right-of-use asset is subsequently depreciated using the straight-line method from the commencement date to the end of the lease term, unless the lease transfers ownership of the underlying asset to the Group by the end of the lease term or the cost of the right-of-use asset reflects that the Group will exercise a purchase option. In that case the right-of-use asset will be depreciated over the useful life of the underlying asset, which is determined on the same basis as those of property, plant and equipment. In addition, the right-of-use asset is periodically reduced by impairment losses, if any, and adjusted for certain remeasurements of the lease liability.

The lease liability is initially measured at the present value of the lease payments that are not paid at the commencement date, discounted using the interest rate implicit in the lease or, if that rate cannot be readily determined, the Group’s incremental borrowing rate. Generally, the Group uses its incremental borrowing rate as the discount rate.

The Group determines its incremental borrowing rate by obtaining interest rates from the Bank’s internal records (weighted average cost of funds) to reflect the terms of the lease and type of the asset leased.

Lease payments included in the measurement of the lease liability comprise the following:

– fixed payments, including in-substance fixed payments;

– variable lease payments that depend on an index or a rate, initially measured using the index or rate as at the commencement date;

– amounts expected to be payable under a residual value guarantee; and

– the exercise price under a purchase option that the Group is reasonably certain to exercise, lease payments in an optional renewal period if the Group is reasonably certain to exercise an extension option, and penalties for early termination of a lease unless the Group is reasonably certain not to terminate early.

The lease liability is measured at amortised cost using the effective interest method. It is remeasured when there is a change in future lease payments arising from a change in an index or rate, if there is a change in the Group’s estimate of the amount expected to be payable under a residual value guarantee, if the Group changes its assessment of whether it will exercise a purchase, extension or termination option or if there is a revised in-substance fixed lease payment.

When the lease liability is remeasured in this way, a corresponding adjustment is made to the carrying amount of the right-of-use asset, or is recorded in profit or loss if the carrying amount of the right-of-use asset has been reduced to zero.

Short-term leases and leases of low-value assets

The Group has elected not to recognise the right-of-use assets and lease liabilities for leases of low-value assets and short-term leases. The Group recognises the lease payments associated with these leases as an expense on a straight-line basis over the lease term.

As a lessor

At inception or on modification of a contract that contains a lease component, the Group allocates the consideration in the contract to each lease component on the basis of their relative standalone prices.

When the Group acts as a lessor, it determines at lease inception whether each lease is a finance lease or an operating lease.

To classify each lease, the Group makes an overall assessment of whether the lease transfers substantially all of the risks and rewards incidental to ownership of the underlying asset. If this is the case, then the lease is a finance lease; if not, then it is an operating lease. As part of this assessment, the Group considers certain indicators such as whether the lease is for the major part of the economic life of the asset.

When the Group is an intermediate lessor, it accounts for its interests in the head lease and the sublease separately. It assesses the lease classification of a sublease with reference to the right-of-use asset arising from the head lease, not with reference to the underlying asset. If a head lease is a short-term lease to which the Group applies the exemption described above, then it classifies the sublease as an operating lease.

If an arrangement contains lease and non-lease components, then the Group applies SLFRS 15 to allocate the consideration in the contract.

The Group applies the derecognition and impairment requirements in SLFRS 9 to the net investment in the lease. The Group further regularly reviews estimated unguaranteed residual values used in calculating the gross investment in the lease.

59.1 Leases as lessee (SLFRS 16)

The Bank leases a number of branch and office premises. The leases typically run for a period of 5-12 years, with an option to renew the lease after that date. For some leases, payments are renegotiated to reflect market rentals. Some leases provide for additional rent payments that are based on changes in local price indices.

There were no identifiable assets that were sublet by the Bank to its subsidiary during the year.

Information about leases for which the Bank is a lessee is presented below:

59.2 Right-of-use assets

Right-of-use assets related to leased properties that do not meet the definition of investment property are presented as property, plant and equipment (see Note 39).

BANK
Branch
and office
premises
2020
LKR ’000
Branch
and office
premises
2019
LKR ’000
Balance at beginning 1,386,267 1,248,463
Depreciation charge
for the year
(292,457) (282,313)
Additions to right-of-use assets 315,128 434,075
Derecognition of
right-of-use assets
(36,674) (13,958)
Balance at 31 December 1,372,264 1,386,267

See Note 8.3.3 for maturity analysis of lease liabilities as at 31 December 2020.

The future minimum lease payments under non-cancellable operating leases were payable as follows:

BANK
At 31 December 2020
LKR ’000
2019
LKR ’000
Maturity analysis – Contractual undiscounted cash flows
Less than one year 274,550 241,248
Between one and five years 1,049,125 1,007,904
More than five years 560,720 317,090
Total undiscounted lease liabilities at 31 December 1,884,395 1,566,242
Total discounted lease liabilities at 31 December 1,333,069 1,302,528

Refer Note 50.

59.3 Amounts recognised in income statement

For the year ended 31 December 2020
LKR ’000
2019
LKR ’000
Leases under SLFRS 16
Interest on lease liabilities 140,657 130,694
Expenses relating to
short-term leases
1,500 1,725
Depreciation charge for the year 292,457 282,313
434,614 414,732

59.4 Amounts recognised in statement of cash flows

For the year ended 31 December 2020
LKR’ 000
2019
LKR’ 000
Total cash outflow for leases 303,627 278,496

59.5 Extension options

Some property leases contain extension options exercisable by the Bank. Where practicable, the Bank seeks to include extension options in new leases to provide operational flexibility. The extension options held are exercisable only by the Bank and not by the lessors. The Bank assesses at lease commencement date whether it is reasonably certain to exercise the extension options. The Bank reassesses whether it is reasonably certain to exercise the options if there is a significant event or significant changes in circumstances within its control.

The Bank has estimated that the potential future lease payments, should it exercise the extension option, would result in no material increase in lease liability.

Accounting Policy

An operating segment is a component of the Group that engages in business activities from which it may earn revenues and incur expenses, including revenues and expenses relating to transactions with any of the Group’s other components, whose operating results are regularly reviewed by the Group’s chief operating decision maker (CODM) to make decisions about resources to be allocated to the segment and assess its performance, and for which discrete financial information is available.

Segment results that are reported to the Group’s CEO (being the CODM) include items that are directly attributable to a segment as well as those that can be allocated on a reasonable basis. Unallocated items comprise mainly corporate assets (primarily the Bank’s headquarters), expenses, tax assets and liabilities.

60.1 Basis for segmentation

The Group has the following four strategic divisions, which are reportable segments. These divisions offer different products and services, and are managed separately based on the Group’s management and internal reporting structure.

Corporate banking Loans, deposits and other transactions and balances with corporate customers.
Retail banking Loans, deposits and other transactions and balances with retail customers.
Treasury Funding and centralised risk management activities through borrowings, issues of debt securities, use of derivatives for risk management purposes and investing in liquid assets such as short-term placements and corporate and government debt securities.
Other Revenue and expenses attributable to the incorporated business segments of industrial estate management, unit trust management, stock brokering and consultancy services are included in the column for others.

Segment performance is evaluated based on operating profits or losses which are measured differently from operating profits or losses in the consolidated financial statements. Income taxes are managed on a group basis and are not allocated to operating segments.

The Group’s Management Committee reviews internal management reports from each division at least monthly.

60.2 Information about reportable segments

Information related to each reportable segment is set out below. Segment profit before tax, as included in internal management reports reviewed by the Group’s Management Committee, is used to measure performance because Management believes that this information is the most relevant in evaluating the results of the respective segments relative to other entities that operate within the same industries. Intersegment pricing is determined on an arm’s length basis. Eliminations are the consolidation adjustments for inter-company transactions, dividend and dividend payable attributable to minority shareholders.

For the year ended 31 December 2020 31 December 2019
Corporate banking
LKR ’000
Banking
LKR ’000
Treasury
LKR ’000
Other
LKR ’000
Total
LKR ’000
Corporate banking
LKR ’000
Banking
LKR ’000
Treasury
LKR ’000
Other
LKR ’000
Total
LKR ’000
External revenue
Interest income 11,148,133 19,023,235 7,689,521 40,790 37,901,679 13,281,469 21,896,086 6,709,512 39,255 41,926,322
Net fees and commission income 519,265 1,404,888 269,321 2,193,474 487,260 1,459,649 1,946,909
Net gain/(loss) from trading 479,152 479,152 (87,116) (87,116)
Net loss from financial instruments
at fair value through profit or loss
(497,931) (497,931) (2,633,183) (2,633,183)
Net gain from derecognition of financial assets 510,386 510,386 209,890 209,890
Net other operating income 16,532 39,907 960,023 652,979 1,669,441 4,927 19,291 1,508,269 665,818 2,198,305
Income from external customers 11,683,930 20,468,030 9,410,472 693,769 42,256,201 13,773,656 23,375,026 5,707,372 705,073 43,561,127
Inter segment revenue (389,122) (389,122) (391,054) (391,054)
Total segment revenue 11,683,930 20,468,030 9,410,472 304,647 41,867,079 13,773,656 23,375,026 5,707,372 314,019 43,170,073
Other material non-cash items:
– Impairment losses on financial assets (3,327,892) (1,689,313)
– Depreciation and amortisation (970,958) (901,410)
Other expenses (33,624,343) (37,270,910)
Segment profit before tax 3,943,886 3,308,440
Segment assets 126,752,290 170,095,200 153,778,921 815,960 451,442,371 120,581,116 150,810,122 116,520,149 1,946,190 389,857,577
Segment liabilities 83,083,022 214,097,277 110,059,796 398,124 407,638,219 69,159,387 155,296,677 103,429,227 50,803 327,936,094
Information on cash flows
Cash flows from operating activities 31,937,036 (15,475,980)
Cash flows from investing activities (7,426,353) (5,468,127)
Cash flows from financing activities (7,009,552) 21,114,357
Net cash flows generated during the year 17,501,131 170,250
Capital expenditure:
Property, plant and equipment 763,977 133 764,110 335 332,672 2,683 9,808 345,498
Intangible assets 315,082 315,082 401,407 8,578 409,985

60.3 Reconciliations of information on reportable segments to the amounts reported in the financial statements

For the year ended 2020
LKR ’000
2019
LKR ’000
Revenues
Total revenue for reportable segments 42,256,201 43,561,127
Unallocated amounts 1,737,368 478,214
Elimination of inter segment revenue (389,122) (391,054)
Consolidated revenue 43,604,447 43,648,287
As at 31 December 2020
LKR ’000
2019
LKR ’000
Assets
Total assets for reportable segments 451,442,371 389,857,577
Other unallocated amounts 15,924,164 17,054,015
Consolidated total assets 467,366,535 406,911,592
Liabilities
Total liabilities for reportable segments 407,638,219 327,936,094
Other unallocated amounts 8,019,566 29,549,006
Consolidated total liabilities 415,657,785 357,485,100

Accounting Policy

Events after the reporting period are those events, favourable and unfavourable, that occur between the reporting date and the date when the financial statements are authorised for issue.

All material events after the reporting date have been considered and where appropriate, adjustments or disclosures have been made in the respective Notes to the financial statements.

There have been no events subsequent to the reporting date, which would have any material effect on the Company, other than the following;

61.1  First and final dividend

The Directors have approved the payment of a first and final dividend of LKR 3.00 per share in the form of scrip dividend for the financial year ended 31 December 2020. The Board of Directors confirm that the Bank has satisfied the solvency test in accordance with Section 57 of the Companies Act No. 07 of 2007 and has obtained the certificate from the Auditor.

The information has been reclassified with the current year’s classification in order to provide a better presentation.

Current presentation As disclosed previously
As at 31 December Bank
LKR ’000
Group
LKR ’000
Bank
LKR ’000
Group
LKR ’000
Statement of Financial Position
Financial assets at amortised cost –
Loans to and receivables from banks
8,403,175 8,403,175
Financial assets at amortised cost –
Debt and other instruments
30,147,032 30,147,032 21,743,857 21,743,857

The Board of Directors of the Bank is responsible for the preparation and presentation of these financial statements. Please refer for the Statement of Directors’ Responsibility.

Disclosure Requirements Description Page No.
1. Information about the Significance of Financial Instruments for Financial Position and Performance
1.1 Statement of Financial Position
1.1.1 Disclosures on categories of financial assets and financial liabilities. Notes to the financial statements: Note 25 – Analysis of financial instruments by measurement basis 228-231
1.1.2 Other Disclosures
i. Special disclosures about financial assets and financial liabilities designated to be measured at fair value through profit or loss, including disclosures about credit risk and market risk, changes in fair values attributable to these risks and the methods of measurement. Not designated Principal accounting policies: Note 5.3.9 – Designation at fair value through profit or loss Notes to the financial statements: Note 08 – Financial risk review 172 174-196
ii. Reclassifications of financial instruments from one category to another. Principal accounting policies: Note 5.3.3 – Reclassification of financial assets 170
iii. Information about financial assets pledged as collateral and about financial or non-financial assets
held as collateral.
Notes to the financial statements: Note 46.1 – Assets pledged as security 268
iv. Reconciliation of the allowance account for credit losses by class of financial assets. Note the financial statements: Note 32.1.4 – Movement in impairment during the year 243
v. Information about compound financial instruments with multiple embedded derivatives. The Bank does not have compound financial instruments with multiple embedded derivatives
vi. Breaches of terms of loan agreements. None
1.2 Statement of Comprehensive Income
1.2.1 Disclosures on items of income, expense, gains and losses. Notes to the financial statements: Notes 10 to 23 206-227
1.2.2 Other Disclosures
i. Total interest income and total interest expense for those financial instruments that are not measured
at fair value through profit and loss.
Notes to the financial statements: Note 11 – Net interest income 207-209
ii. Fee income and expense. Notes to the financial statements: Note 12 – Net fee and commission income 209-210
iii. Amount of impairment losses by class of financial assets. Notes to the financial statements: Note 17 – Impairment for loans and other losses 213-220
iv. Interest income on impaired financial assets. The Bank has discontinued the recognition of interest income on impaired financial assets as given in
Note 11 – Net interest income
207-209
1.3 Other Disclosures Principal accounting policies:
1.3.1 Accounting policies for financial instruments. Note 5.3 – Financial assets and Financial liabilities 169-172
1.3.2 Information on hedge accounting. Notes to the financial statements: Note 29 – Derivate financial assets/liabilities 233-236
1.3.3 Information about the fair values of each class of financial asset and financial liability, along with:
i. Comparable carrying amounts. Notes the financial statements: Notes 9.1 to 9.4.8 – Fair value of financial instruments 199-206
ii. Description of how fair value was determined. Notes to the financial statements: Note 9 – Fair value of financial instruments 199-206
iii. The level of inputs used in determining fair value. Notes to the financial statements: Notes 9 – Valuation models 199
iv. a. Reconciliations of movements between levels of fair value measurement hierarchy. b. Additional disclosures for financial instruments that fair value is determined using level 3 inputs. There were no movements between level s of fair value hierarchy during the year under review
  v. Information if fair value cannot be reliably measured. Notes to the financial statements: Notes 9.4.1 to 9.4.8 205-206
2. Information about the Nature and Extent of Risks Arising from Financial Instruments
2.1 Qualitative Disclosures
2.1.1 Risk exposures for each type of financial instrument. Notes to the financial statements: Note 8 – Financial risk review 174-196
2.1.2 Management’s objectives, policies, and processes for managing those risks. Notes to the financial statements: Note 8 – Financial risk review 174-196
2.1.3 Changes from the prior period. Notes to the financial statements: Note 62 – Comparative figures 296
2.2 Quantitative Disclosures
2.2.1 Summary of quantitative data about exposure to each
risk at the reporting date.
Notes to the financial statements: Note 8 – Financial risk review 174-196
2.2.2 Disclosures about credit risk, liquidity risk, market risk, operational risk, interest rate risk and how these risks are managed.
i. Credit Risk
  a. Maximum amount of exposure (before deducting the value of collateral), description of collateral, information about credit quality of financial assets that are neither past due nor impaired and information about credit quality of financial assets. Notes to financial statements: Note 8.2.3 – Credit quality analysis Note 8.2.4 – Collateral held and other credit enhancement 176-177 177-179
  b. For financial assets that are past due or impaired, disclosures on age, factors considered in determining as impaired and the description of collateral on each class of financial asset. Notes to the financial statements: Note 8.2.3 – Credit quality analysis Note 8.2.4 – Collateral held and other credit enhancement Note 8.2.5 – Amounts arising from ECL 176-177 177-179 179-181
  c. Information about collateral or other credit enhancements obtained or called. Notes to the financial statements: Note 8.2.4 – Collateral held and other credit enhancement 177-179
  d. For other disclosures, please refer Banking Act Direction No. 7 of 2011 on Integrated Risk Management Framework for Licensed Banks (Section H). Notes to the financial statements: Note 8.2 – Credit risk (Financial risk review) 175-182
ii. Liquidity Risk
  a. A maturity analysis of financial liabilities. Notes to the financial statements: Notes 8.3.3 – Maturity analysis of financial liabilities
and financial assets
184-188
  b. Description of approach to risk management. Notes to the financial statements: Note 8.3 – Financial risk review 183-189
  c. For other disclosures, please refer Banking Act Direction No. 7 of 2011 on Integrated Risk Management Framework for Licensed Banks (Section H). Notes to the financial statements: Note 8.3 – Liquidity risk (Financial risk review) 183-189
iii. Market Risk
  a. A sensitivity analysis of each type of market risk to which the entity is exposed. Notes to the financial statement: Note 8.4 – Market risk (Financial risk review) 190-195
  b. Additional information, if the sensitivity analysis is not representative of the entity’s risk exposure. None
  c. For other disclosures, please refer Banking Act Direction No. 7 of 2011 on Integrated Risk Management Framework for Licensed Banks (Section H). Notes to the financial statement: Note 8.4 – Market risk (Financial risk review) 190-195
iv. Operational Risk Notes to the financial statements: Note 8.5 – Operational risk (Financial risk review) 195-198
  Please refer Banking Act Direction No. 7 of 2011 on Integrated Risk Management Framework for Licensed Banks (Section H).
v. Equity Risk in the Banking Book
  a. Qualitative Disclosures
 
  • Differentiation between holdings on which capital gains are expected and those taken under other objectives including for relationship and strategic reasons.
Notes to the financial statements: Note 8.4.2.1 – Equity price risk 192
 
  • Discussion of important policies covering the valuation and accounting of equity holdings in
    the banking book.
Note 5.1.1 to 5.1.7 – Basis of consolidation Note 35 – Investments in subsidiaries Note 36 – Investments in associates Note 37 – Investments in joint venture 167-168 251 252-253 253-255
  b. Quantitative Disclosures
 
  • Value disclosed in the statement of financial position of investments, as well as the fair value of those investments; for quoted securities, a comparison to publicly quoted share values where the share price is materially different from fair value.
Notes to the financial statements: Note 30 – Financial assets measured at fair value through profit or loss Note 34 – Financial assets measured at fair value through other comprehensive income 237-238 246-250
 
  • The types and nature of investments. The cumulative realised gains/(losses) arising from sales and liquidations in the reporting period.
Notes to the financial statements: Note 13 – Net (loss)/gain from trading Note 15 – Net gains from derecognition of financial assets Note 16 – Net other operating income 211 212 212-213
  vi. Interest Rate Risk in the Banking Book
  a. Qualitative Disclosures Notes to the financial statements: Note 8 – Financial risk review 174-196
 
  • Nature of interest rate risk in the banking book (IRRBB) and key assumptions.
  b. Quantitative Disclosures Notes to the financial statements: Note 8 – Financial risk review Note 8.4.4.1 – Potential impact on NII due to change in market interest rates 174-196 193-194
 
  • The increase/(decline) in earnings or economic value (or relevant measure used by management) for upward and downward rate shocks according to management’s method for measuring IRRBB, broken down by currency (as relevant).
2.2.3 Information on concentrations of risk. Notes to the financial statements: Note 8 – Financial risk review 174-196
3. Other Disclosures
3.1 Capital
3.1.1 Capital Structure
i. Qualitative Disclosures. Notes to the financial statements: Note 8.5.1.1 – Key regulatory ratios – capital adequacy 196-198
  Summary information on the terms and conditions of the main features of all capital instruments, especially in the case of innovative, complex or hybrid capital instruments.
ii. Quantitative Disclosure Notes to the financial statements: Note 8.5.1.1 – Key regulatory ratios – capital adequacy 196-198
 

a. The amount of Tier 1 capital, with separate disclosure of:

  • Paid-up share capital/common stock
  • Reserves
  • Non-controlling interests in the equity of subsidiaries
  • Innovative instruments
  • Other capital instruments
  • Deductions from Tier 1 capital

b. The total amount of Tier 2 and Tier 3 capital c. Other deductions from capital d. Total eligible capital

3.1.2   Capital adequacy
i. Qualitative Disclosures Notes to the financial statements: Note 8.5.1 – Qualitative disclosures (capital management) 195-196
  A summary discussion of the Bank’s approach to ssessing the adequacy of its capital to support current and future activities.
ii. Quantitative Disclosures
  a. Capital requirements for credit risk, market risk and operational risk Notes to the financial statements: Note 8.5.1 – Capital management 195-196
  b. Total and Tier 1 capital ratio Notes to the financial statements: Note 8.5.1.1 – Key regulatory ratios – capital adequacy 196

Other Disclosure Requirements Under the Prescribed Format Issued by the Central Bank of Sri Lanka for Preparation of Annual Financial Statements of Licensed Commercial Banks

TOP
Close