Annual Report 2019


Management Discussion and Analysis
Investor Capital
Investors are a key stakeholder in our value creation process and one of our primary objectives is to maximise our investor wealth by providing sustainable, long-term returns. We regularly engage with our investors through various means and they play an active role in shaping our corporate behaviour.
We have gained the trust of our investors by maintaining sustainable growth over the past years.
Shareholder profile
The Bank had 9,011 shareholders on 31 December 2019 (corresponding to a figure of 8,880 as at 31 December 2018), with the total number of shares in issue increasing during the year to 304,188,756 ordinary shares. Institutions account for approximately 85% of the Bank’s share capital. 72% of the Bank’s share capital is held by local shareholders, both institutional and individual.
Share information
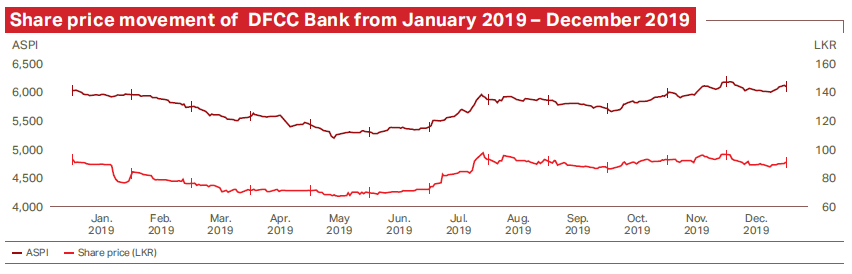
DFCC Bank share price information for the period 1 January 2019 – 31 December 2019.
|
1 January to 31 December 2019 |
1 January to 31 December 2018 |
|
| Price Indices | ||
| ASPI | 6,129.21 | 6,052.37 |
| S&P SL20 | 2,936.96 | 3,135.18 |
| Share Price | ||
| Lowest Price (LKR) | 67.00 | 87.00 |
| Highest Price (LKR) | 99.30 | 124.70 |
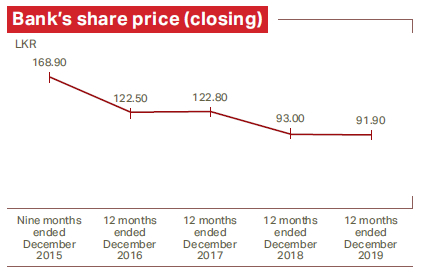
| Closing Price (LKR) | 91.90 | 93.00 |
| Market Capitalisation | ||
| Value (LKR Mn) | 27,955 | 24,654 |
| Percentage of total market cap | 0.98 | 0.87 |
| Rank | 22 | 24 |
| Value of Shares Traded | ||
| Value (LKR Mn) | 429 | 365 |
| Percentage of total market turnover | 0.25 | 0.18 |
| Rank | 61 | 59 |
| Days Traded | ||
| Number of days traded | 240 | 239 |
| Total number of market days | 241 | 240 |
| Percentage of market days traded | 99.58 | 99.58 |
| Frequency of Shares Traded | ||
| Number of transactions | 7,675 | 5,191 |
| Percentage of total frequency | 0.64 | 0.59 |
| Rank | 41 | 46 |


Distribution of shareholding
Categories of shareholders
| As at | 31 December 2019 | 31 December 2018 | ||||
| Shareholding, % | Foreign | Local | Total | Foreign | Local | Total |
| Individual | 7.67 | 6.85 | 14.52 | 8.09 | 7.79 | 15.88 |
| Institutional | 20.42 | 65.06 | 85.48 | 15.82 | 68.30 | 84.12 |
| 28.09 | 71.91 | 100.00 | 23.91 | 76.09 | 100.00 | |
Distribution of shareholding by size
| Share range | 31 December 2019 | 31 December 2018 | ||||||
|
Number of Shareholders |
Total holding | % |
Number of Shareholders |
Total holding | % | |||
| 1 | – | 1,000 | 5,892 | 1,789,102 | 0.59 | 5,812 | 1,802,814 | 0.68 |
| 1,001 | – | 5,000 | 2,363 | 4,906,129 | 1.62 | 2,352 | 4,902,295 | 1.84 |
| 5,001 | – | 10,000 | 321 | 2,308,487 | 0.76 | 308 | 2,221,277 | 0.88 |
| 10,001 | – | 50,000 | 322 | 7,012,828 | 2.30 | 294 | 6,427,117 | 2.43 |
| 50,001 | – | 100,000 | 45 | 3,324,099 | 1.09 | 46 | 3,243,705 | 1.12 |
| 100,001 | – | 500,000 | 40 | 7,316,408 | 2.41 | 43 | 8,845,370 | 3.45 |
| 500,001 | – | 1,000,000 | 4 | 2,605,646 | 0.85 | 3 | 1,987,718 | 0.75 |
| 1,000,000 and above | 24 | 274,926,057 | 90.38 | 22 | 235,667,392 | 88.85 | ||
| 9,011 | 304,188,756 | 100.00 | 8,880 | 265,097,688 | 100.00 | |||
Public holding as at 31 December 2019
| 31 December 2019 | 31 December 2018 | |
| Public holding percentage (%) | 62.6 | 63.4 |
| Number of public shareholders | 8,996 | 8,867 |
| Float adjusted market capitalisation (LKR Mn) | 17,488 | 15,631 |
| Applicable option as per CSE Listing Rule 7.13.1 (a) | Option 1 | Option 1 |
Twenty major shareholders of the Bank as at 31 December 2019
| Name of shareholder/company | 31 December 2019 | 31 December 2018* | ||
| No. of shares | % | No. of shares | % | |
| Hatton National Bank PLC A/c No. 1 | 45,354,596 | 14.91 | 32,396,140 | 12.22 |
| Bank of Ceylon No. 2 A/C | 38,039,994 | 12.51 | 38,039,994 | 14.35 |
| M A Yaseen | 30,418,875 | 10.00 | 26,506,750 | 10.00 |
| Sri Lanka Insurance Corporation Ltd – Life Fund | 26,509,832 | 8.71 | 26,509,832 | 10.00 |
| Employees Provident Fund | 24,368,995 | 8.01 | 24,368,995 | 9.19 |
| Melstacorp PLC | 22,383,614 | 7.36 | 22,175,280 | 8.36 |
| Seafeld International Limited | 17,716,794 | 5.82 | 15,286,794 | 5.77 |
| BPSS Lux-Aberdeen Standard SICAV I – Asia Pacific Equity Fund | 13,018,323 | 4.28 | 9,842,898 | 3.71 |
| Citi Bank New York S/A Norges Bank Account 2 | 9,049,301 | 2.97 | – | – |
| CB London S/A Aberdeen Asia Pacific Equity Fund | 7,356,792 | 2.42 | 5,438,669 | 2.05 |
| Renuka City Hotels PLC | 6,926,870 | 2.28 | 6,926,870 | 2.61 |
| BP2S London-Edinburgh Dragon Trust PLC | 6,339,659 | 2.08 | 4,528,328 | 1.71 |
| BP2S London-Aberdeen Standard Asia Focus PLC | 5,214,933 | 1.71 | 3,866,936 | 1.46 |
| Renuka Hotels PLC | 4,073,360 | 1.34 | 4,073,360 | 1.54 |
| Employees Trust Fund Board | 3,987,952 | 1.31 | 3,987,952 | 1.50 |
| Akbar Brothers (Pvt) Ltd A/c No. 1 | 2,578,688 | 0.85 | 2,578,688 | 0.97 |
| Cargo Boat Development Company PLC | 2,498,200 | 0.82 | 2,498,200 | 0.94 |
| BP2S London-Aberdeen New Dawn Investment Trust XCC6 | 1,898,290 | 0.62 | 1,450,311 | 0.55 |
| Stassen Exports (Pvt) Limited | 1,896,791 | 0.62 | 362,788 | 0.14 |
| Anverally International (Pvt) Ltd. | 1,682,148 | 0.55 | 1,579,345 | 0.60 |
| Total of the 20 major shareholders | 271,314,007 | 89.17 | ||
| Other shareholders | 32,874,749 | 10.83 | ||
| Total | 304,188,756 | 100.00 | ||
* Shareholding as at 31 December 2018 of the twenty largest shareholders as at 31 December 2019.

We have gained the trust of our investors by maintaining sustainable growth over the past years.
Return to shareholders – Bank
| Description | 2019 | 2018 |
| Profit for the year (LKR Mn) | 2,074 | 2,768 |
| Return on total assets (%)* | 0.78 | 0.80 |
| Net assets per share (LKR) | 156.09 | 165.40 |
| Earnings per share (LKR) | 7.14 | 10.44 |
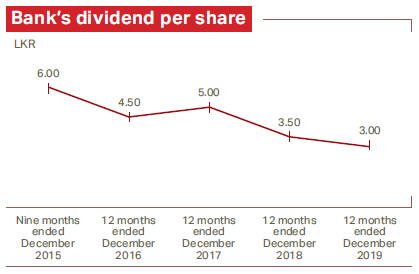
| Dividend per share (LKR) | 3.00 | 3.50 |
* After eliminating fair value reserve
Financial return
The Bank aims to regularly provide high shareholder returns through profitable and sustainable performance. The Directors recommended a first and final dividend of LKR 3.00 per share for the year ended 31 December 2019. Dividends are based on growth in profits, while taking into account future cash requirements and the maintenance of prudent ratios.