Financial Statements
Notes to the Financial Statements
1. Reporting entity
1.1. Corporate information
Commercial Bank of Ceylon PLC (the “Bank”) is a public limited liability company listed on the Colombo Stock Exchange (CSE), incorporated on June 25, 1969 under
the Companies Ordinance
No. 51 of 1938, and domiciled in Sri Lanka. It is a licensed commercial bank regulated under the Banking Act No. 30 of 1988 and amendments thereto (Banking Act). The Bank was
re-registered under the Companies Act No. 07 of 2007 on January 23, 2008, under the Company Registration No. PQ 116. The registered office of the Bank is situated at “Commercial House”,
No. 21, Sir Razik Fareed Mawatha, Colombo 01, Sri Lanka.
The ordinary shares of the Bank (both Ordinary Voting and Non-Voting shares) have a primary listing on the CSE. The unsecured subordinated debentures of the Bank are also listed on the CSE.
The staff strength of the Group and the Bank was as follows:
| As at December 31, | 2022 | 2021 |
| Group | 5,749 | 5,660 |
| Bank | 5,121 | 5,072 |
Corporate information is presented in the inner back cover of this Annual Report.
1.2 Consolidated Financial Statements
The Consolidated Financial Statements as at and for the year ended December 31, 2022, comprise the Bank (Parent Company) and its Subsidiaries (together referred to as the “Group” and individually as “Group entities”) and the Group’s interest in its Associate.
The Bank does not have an identifiable parent of its own. The Bank is the Ultimate Parent of the Group.
1.3 Principal business activities, nature of operations of the Group and ownership by the Bank in its subsidiaries and associate
Figure 30: Group structure

Table – 60: Principal business activities and nature of business operations of the Group
| Entity | Principal business activities |
| Commercial Bank of Ceylon PLC | Banking and related activities such as accepting deposits, personal banking, trade financing, offshore banking, RFC and NRFC operations, travel-related services, corporate and retail credit, syndicated financing, project financing, investment banking, development banking, lease and hire purchase, rural credit, issuing of local and international debit and credit cards, internet banking, mobile banking, money remittance facilities, dealing in Government Securities and treasury-related products, salary remittance package, bullion trading, export and domestic factoring, pawning, margin trading, digital banking services, bancassurance and Islamic banking products and services etc. |
| Local subsidiaries | |
| Commercial Development Company PLC (CDC) | Property development, related ancillary services and providing manpower needs for various support services which are unrelated to providing core banking services to the customers of the Bank (Parent). |
| CBC Tech Solutions Limited | Providing Information and Communication Technology (ICT) related products, services and solutions to the corporate sector. |
| CBC Finance Limited | Granting of lease facilities, hire purchase, mortgage loans and other credit facilities and accepting deposits. |
| Commercial Insurance Brokers (Pvt) Limited (CIB) | Providing professional service and handling all insurance portfolios of individuals as well as many leading and reputed organisations in Sri Lanka engaged in diverse business activities. |
| Foreign subsidiaries | |
| Commercial Bank of Maldives Private Limited (CBM) | Offering of an extensive range of banking and related financial services such as accepting deposits, retail banking, trade financing, corporate and retail credit, project financing, development banking, tele-banking, internet banking, mobile banking, money remittance facilities, dealing in Government Securities and treasury-related products etc. |
| CBC Myanmar Microfinance Company Limited |
Operating as a non-deposit taking microfinance institution throughout Myanmar providing micro financial services to the lower segment of the market, and to engage in all activities reasonably allowed by the Microfinance Supervisory Authority of Myanmar. |
| Commex Sri Lanka S.R.L-Italy (Commex) | Operated as an agent to the Bank (Parent) for opening accounts, providing money transfer services, issuance and encashment of foreign currencies and travellers cheques, collecting applications for credit facilities and handling of ATM cards etc. (The Company is under voluntary liquidation and the Bank has made an announcement to the CSE to that effect) |
| Local associate | |
| Equity Investments Lanka Limited | Project financing in the form of equity, quasi equity and other corporate debt instruments of new and existing ventures in Sri Lanka. |
2. Basis of Accounting
2.1 Statement of compliance
The Consolidated Financial Statements of the Group and the separate Financial Statements of the Bank, have been prepared and presented in accordance with the Sri Lanka Accounting Standards (SLFRSs and LKASs), laid down by The Institute of Chartered Accountants of Sri Lanka (CA Sri Lanka) and in compliance with the requirements of the Companies Act No. 07 of 2007 and amendments thereto (Companies Act) and the Banking Act and provide appropriate disclosures as required by the Listing Rules of the CSE. These Financial Statements, except for information on cash flows have been prepared following the accrual basis of accounting.
These SLFRSs and LKASs are available at the website of CA Sri Lanka – www.casrilanka.com.
The Group did not adopt any inappropriate accounting treatments, which are not in compliance with the requirements of the SLFRSs and LKASs, regulations governing the preparation and presentation of the Financial Statements.
Details of the Group’s Significant Accounting Policies followed during the year are given in Notes 6 to 10.
The formats used in the preparation and presentation of the Financial Statements and the disclosures made therein also comply with the specified formats prescribed by the CBSL in the Circular No. 02 of 2019 dated January 18, 2019, on “Publication of Annual and Quarterly Financial Statements and Other Disclosures by Licensed Banks”. The Bank also published annual and quarterly financial information and other disclosures in the Annual Report, Press and the Website in compliance with Section 4.2 of the aforementioned Circular.
2.2 Responsibility for Financial Statements
The Board of Directors of the Bank is responsible for the preparation and presentation of the Financial Statements of the Group and the Bank as per the provisions of the Companies Act and Sri Lanka Accounting Standards.
The Board of Directors acknowledges their responsibility for Financial Statements as set out in the “Annual Report of the Board of Directors”, “Statement of Directors’ Responsibility for Financial Reporting” and the certification on the Statement of Financial Position. These Financial Statements include the following components:
- Income Statement and a Statement of Profit or Loss and Other Comprehensive Income (OCI) – which provides the information on the financial performance of the Group and the Bank for the year under review.
 Refer Income Statement and Statement of Profit or Lossand Other Comprehensive Income;
 - Statement of Financial Position (SOFP) – which provides the information on the financial position of the Group and the Bank as at the year end.
 Refer Statement of Financial Position;
 - Statement of Changes in Equity – which depicts all changes in shareholders’ funds during the year under review of the Group and the Bank. Refer Statement of Changes in Equity – Group;
- Statement of Cash Flows – which provides the information to the users, on the ability of the Group and the Bank to generate cash and cash equivalents and utilisation of those cash flows. Refer Statement of Cash Flows;
- Notes to the Financial Statements comprising Significant Accounting Policies and other explanatory information.
Refer Notes to the Financial Statements.
2.3 Approval of Financial Statements by the Board of Directors
The Financial Statements of the Group and the Bank for the year ended December 31, 2022 (including comparatives for 2021), were approved and authorised for issue by the Board of Directors in accordance with Resolution of the Directors on February 24, 2023 (The Financial Statements of the Group and the Bank for the year ended December 31, 2021, were approved and authorised for issue by the Board of Directors on February 25, 2022).
2.4 Basis of measurement
The Financial Statements of the Group have been prepared on the historical cost basis except for the following material items stated in the SOFP.
Table – 61: Basis of measurement
| Items | Basis of measurement | Note Number/s |
| Financial instruments measured at fair value through profit or loss including derivative financial instruments | Fair value | 31, 32 and 44 |
| Financial assets measured at fair value through other comprehensive income | Fair value | 35 |
| Land and buildings | Measured at cost at the time of acquisition and subsequently at revalued amounts which are the fair values at the date of revaluation | 38 |
| Investment property | Measured at cost at the time of acquisition and subsequently at Fair value. | 39 |
| Defined benefit obligation | Net liability for defined benefit obligations are recognised as the present value of the defined benefit obligation, less net total of the plan assets, plus unrecognised actuarial gains, less unrecognised past service cost, and unrecognised actuarial losses | 48 |
| Equity settled share-based payment arrangements |
Fair value on grant date | 52 |
2.5 Going concern basis of accounting
The Management has made an assessment of its ability to continue as a going concern and is satisfied that it has the resources to continue in business for the foreseeable future. In making this assessment, the Bank has considered the impact of climate-related matters on their going concern assessment.
Furthermore, the Management is not aware of any material uncertainties that may cast significant doubt upon the Group’s ability to continue as a going concern. Therefore, the Financial Statements of the Group continue to be prepared on a going concern basis.
Given the continued unpredictability of the impact of the COVID-19 outbreak, the management took into consideration the existing and anticipated effects of the pandemic on the Group’s activities based on all available information about the future that was obtained after the reporting date, up until the date on which the financial statements are issued. Subsequent to the outbreak of COVID-19, the Group has strictly adhered to the guidelines and directions issued by both the Governments and Central Banks in the countries that we operate when conducting its business operations. Further, the Group has provided reliefs for the affected businesses and individuals in line with the directions issued by the Governments and Central Banks in the countries that we operate. These relief measures include deferment of repayment terms of credit facilities, offering concessionary rates of interest to eligible loan products (debt moratorium) and waiving off certain fees and charges. Considering a wide range of factors including history of profitable operations, strong liquidity positions and the availability of stable external funding sources, diversified lending profile and the initiatives taken to strengthen risk monitoring at borrower level, the Management is satisfied that the going concern basis is appropriate.
2.6 Functional and presentation currency
Items included in these Financial Statements are measured using the currency of the primary economic environment in which the Bank operates (the functional currency).
Each entity in the Group determines its own functional currency and items included in the Financial Statements of these entities are measured using that functional currency. There was no change in the Group’s presentation and functional currency during the year under review.
These Financial Statements are presented in Sri Lankan Rupees, the Group’s functional and presentation currency.
The information presented in US Dollars in Annex 8 in the section on “Supplementary Information” does not form part of the Financial Statements and is made available solely for the information of stakeholders.
2.7 Presentation of Financial Statements
The assets and liabilities of the Group presented in the SOFP are grouped by nature and listed in an order that reflects their relative liquidity and maturity pattern.
No adjustments have been made for inflationary factors affecting the Financial Statements.
An analysis on recovery or settlement within 12 months and more than 12 months from the reporting date is presented in Note 60.
2.8 Rounding
The amounts in the Financial Statements have been rounded-off to the nearest rupees thousands, except where otherwise indicated as permitted by the Sri Lanka Accounting Standard – LKAS 1 on “Presentation of Financial Statements” (LKAS 1).
2.9 Offsetting
Financial assets and financial liabilities are offset and the net amount reported in the SOFP, only when there is a legally enforceable right to offset the recognised amounts and there is an intention to settle on a net basis or to realise the assets and settle the liabilities simultaneously. Income and expenses are not offset in the Income Statement, unless required or permitted by an Accounting Standard or Interpretation (issued by the IFRS Interpretations Committee and Standard Interpretations Committee) and as specifically disclosed in the Significant Accounting Policies of the Bank.
2.10 Materiality and aggregation
Each material class of similar items is presented separately in the Financial Statements. Items of dissimilar nature or function are presented separately, unless they are immaterial as permitted by the LKAS 1 and amendments to the LKAS 1 on “Disclosure Initiative” which was effective from January 01, 2016.
Notes to the Financial Statements are presented in a systematic manner which ensures the understandability and comparability of Financial Statements of the Group and the Bank. Understandability of the Financial Statements is not compromised by obscuring material information with immaterial information or by aggregating material items that have different natures or functions.
2.11 Comparative information
Comparative information including quantitative, narrative and descriptive information is disclosed in respect of the previous period in the Financial Statements in order to enhance the understanding of the current period’s Financial Statements and to enhance the inter period comparability. The presentation and classification of the Financial Statements of the previous year are amended, where relevant for better presentation and to be comparable with those of the current year.
2.12 Use of significant accounting judgements and assumptions and estimates
In preparing the Financial Statements of the Group in conformity with SLFRSs and LKASs, the Management has made judgements, estimates and assumptions which affect the application of Accounting Policies and the reported amounts of assets, liabilities, income and expenses. Actual results may differ from these estimates. Estimates and underlying assumptions are reviewed on an ongoing basis. Revisions to accounting estimates are recognised prospectively.
The Group considered the impact of COVID-19 in preparing the Financial Statements in line with the circulars and guidelines issued by the CBSL and CA Sri Lanka. While the specific areas of judgement may not change, continued uncertainty surrounding economic activities, and the limited experience of the economic and financial impacts of such events, application of further judgements and changes to estimates in the measurement of Group’s assets were made where applicable.
Significant areas of critical judgements, assumptions and estimation uncertainty, in applying the Accounting Policies that have most significant effects on the amounts recognised in the Financial Statements of the Group are as follows:
A. Significant Accounting Judgements
Information about judgements made in applying the Accounting Policies that have most significant effects on the amounts recognised in these Financial Statements is included in Notes 2.12.1 to 2.12.3 below.
2.12.1 Determination of control over investees
Management applies its judgement to determine whether the control indicators set out in Note 36 indicates that the Group controls the investees.
2.12.2 Classification of financial assets and liabilities
The Significant Accounting Policies of the Group provides scope for financial assets to be classified and subsequently measured into different categories, namely, at Amortised Cost (AC), Fair Value through Other Comprehensive Income (FVOCI) and Fair Value through Profit or Loss (FVTPL) based on the following criteria;
- The entity’s business model for managing the financial assets as set out in Note 7.1.3.1.
- The contractual cash flow characteristics of the financial assets as set out in Note 7.1.3.2.
2.12.3 Classification of investment property
Management uses its judgement to determine whether a property qualifies as an investment property. A property that is held either to earn rental income or for capital appreciation or both and thus generates cash flows largely independently of the other assets held by the Group are classified as Investment Property. On the other hand, a property used in the production or supply of goods and services or for administrative purposes and thus generates cash flows that are attributable not only to that property but also to other assets used in the production or supply process are classified as property, plant and equipment. The Group assesses on an annual basis, the accounting classification of its investment properties, taking into consideration the current use of such properties.
B. Assumptions and estimation uncertainties
Information about assumptions and estimation uncertainties that have a significant risk of resulting in material adjustments are included in Notes 2.12.4 to 2.12.13 below.
2.12.4 Fair value of financial instruments
The fair values of financial assets and financial liabilities recognised on the SOFP, for which there is no observable market price are determined using a variety of valuation techniques that include the use of mathematical models. The Group measures fair value using the fair value hierarchy that reflects the significance of input used in making measurements. Methodologies used for valuation of financial instruments and fair value hierarchy are stated in Note 27.
2.12.5 Impairment losses on financial assets
The measurement of impairment losses across the categories of financial assets under Sri Lanka Accounting Standard – SLFRS 9 on “Financial Instruments” (SLFRS 9) requires judgement, in particular, the estimation of the amount and timing of future cash flows and collateral values when determining impairment losses.
Accordingly, the Group reviews its individually significant loans and advances portfolio at each reporting date to assess whether an impairment loss should be recognised in the Income Statement. In particular, the Management’s judgement is required in the estimation of the amount and timing of future cash flows when determining the impairment loss. In estimating these cash flows, Management makes judgements about a borrower’s financial situation and the net realisable value of any underlying collateral. Each impaired asset is assessed on its merits, and the workout strategy and estimate of cash flows considered recoverable. These estimates are based on assumptions about a number of factors and hence actual results may differ, resulting in future changes to the impairment allowance made.
A collective impairment provision is established for:
- groups of homogeneous loans and advances that are not considered individually significant; and
- groups of assets that are individually significant but that were not found to be individually impaired.
As per SLFRS 9, the Group’s Expected Credit Loss (ECL) calculations are outputs of complex models with a number of underlying assumptions regarding the choice of variable inputs and their interdependencies. Elements of the Group’s ECL models that are considered accounting judgements and estimates include:
- Criteria for qualitatively assessing whether there has been a significant increase in credit risk (SICR) and if so allowances for financial assets measured on a Life Time Expected Credit Loss (LTECL) basis.
- Segmentation of financial assets when their ECL is assessed on a collective basis.
- Various statistical formulas and the choice of inputs used in the development of ECL models,
- Associations between macroeconomic inputs, such as GDP growth, inflation, interest rates, exchange rates and unemployment and the effect of these inputs on Probability of Default (PDs), Loss Given Default (LGD) and Exposure At Default (EAD).
- Forward-looking macroeconomic scenarios and their probability weightings.
As such, the accuracy of the impairment provision depends on the model assumptions and parameters used in determining the ECL calculations.
The Bank has provided reliefs such as deferment of repayment terms of credit facilities, for the affected businesses and individuals due to the COVID-19 pandemic in line with the directions issued by the CBSL. Utilisation of a payment deferral programme does not, all else being equal, automatically trigger a SICR. As such, key issue will be to distinguish between cases where the payment holidays provide relief from short-term liquidity constraints impacting the borrower that do not amount to a SICR. Given the high degree of uncertainty and unprecedented circumstances in the short-term economic outlook, the Management exercised judgements in the assessment of the impact of the COVID-19 outbreak on the loans and advances portfolio of the Group, relying more on the long-term outlook as evidenced by past experience and taking into consideration various relief measures including concessionary financing and payment moratorium. The impact of the outbreak has been assessed and adjusted in these Financial Statements based on the available information and assumptions made as at reporting date in line with the guidelines issued by the CBSL and CA Sri Lanka.
In response to the COVID-19 outbreak and the Group’s expectations of economic impacts due to uncertainties, key assumptions used in the Group’s calculation of ECL have been revised. As at the reporting date, the expected impacts of COVID-19 pandemic and the economic uncertainties have been captured via the modelled outcome as well as a separate management overlay reflecting the considerable uncertainty remaining in the modelled outcome given the unprecedented impacts in the economy. Although the credit model inputs and assumptions, including forward-looking macroeconomic assumptions, were revised in response to any possible adverse scenarios, the fundamental credit model mechanics and methodology underpinning the Group’s calculation of ECL have remained consistent with prior periods.
Accordingly, the Bank took steps to identify the customers showing distress signs in identifying SICR under the individual impairment assessment. Under the collective assessment, customers operating in risk elevated industries including tourism and hospitality, few selected personal loan categories, export, industrial and transportation subsectors, construction, and infrastructure development were assessed for Lifetime ECL. Exposures outstanding from the borrowers operating in these industries have been classified as Stage 2 unless such exposures are individually significant and have specifically been identified as Stage 1 reflecting forward looking view of the economy in relation to the business.
Further, during 2022, the Bank decided to increase the weightages assigned for worst case scenario while reducing the weightages assigned for base case scenario and best case scenario when assessing the probability weighted forward looking macroeconomic indicators along with management overlays to qualitative indicators relating to forward looking macroeconomic environment with the objective of capturing the impact of economic uncertainties and volatilities in future outlook on the ECL computation. Furthermore, as per expert credit judgement, the Bank stressed the ECL parameters such as PDs and LGDs to reflect the real economic scenario that is not reflected due to the deferrals and concessions granted due to COVID-19 outbreak and economic uncertainties, in addition to providing adequate provisions considering the riskiness of those customers who have been granted concessions.
Early observations of payment behaviour of expiries for this year were considered in the assessment of the changes in the risk of default occurring over the expected life of a financial instrument when determining staging and is a key input in determining migration.
Refer Note 18 for details.
2.12.6 Impairment of non-financial assets
The Group assesses whether there are any indicators of impairment for an asset or a cash generating unit (CGU) at each reporting date or more frequently, if events or changes in circumstances necessitate to do so. This requires the estimation of the value in use (VIU) of such individual assets or the CGUs. Estimating VIU requires the Management to make an estimate of the expected future cash flows from the asset or the CGU and also to select a suitable discount rate in order to calculate the present value of the relevant future cash flows. This valuation requires the Group to make estimates about expected future cash flows and discount rates and hence, they are subject to uncertainty.
Refer Note 7.6 for details.
2.12.7 Revaluation of property, plant and equipment
The Group measures land and buildings at revalued amounts with changes in fair value being recognised in equity through OCI. The Group engages independent professional valuers to assess fair value of land and buildings in terms of Sri Lanka Accounting Standard – SLFRS 13 on “Fair Value Measurement” (SLFRS 13). The key assumptions used to determine the fair value of the land and building and sensitivity analyses are provided in Notes 38.5 (b) and 38.5 (c).
2.12.8 Useful lifetime of the property, plant and equipment
The Group reviews the residual values, useful lives and methods of depreciation of property, plant and equipment at each reporting date. Judgement of the Management is exercised in the estimation of these values, rates, methods and hence they are subject to uncertainty.
Refer Note 20.
2.12.9 Fair valuation of investment property
Fair valuation of the investment property is ascertained by independent valuations carried out by chartered valuation surveyors, who have recent experience in valuing properties at similar locations and categories. They have made reference to market evidence of transaction prices for similar properties, with appropriate adjustments for size and location. The key assumptions used to determine the fair value of investment property are provided in detail in Note 39.
2.12.10 SLFRS 16 – leases
2.12.10.1 Determination of the lease term for lease contracts with renewal and termination options (Group as a lessee)
The Group determines the lease term as the non-cancellable term of the lease, together with any periods covered by an option to extend the lease if it is reasonably certain to be exercised, or any periods covered by an option to terminate the lease, if it is reasonably certain not to be exercised.
The Group has several lease contracts that include extension and termination options. The Group applies judgement in evaluating whether it is reasonably certain whether or not to exercise the option to renew or terminate the lease. That is, it considers all relevant factors that create an economic incentive for it to exercise either the renewal or termination option. After the commencement date, the Group reassesses the lease term if there is a significant event or change in circumstances that is within its control that affects its ability to exercise or not to exercise the option to renew or to terminate (e.g. construction of significant leasehold improvements or significant customisation of the leased asset).
2.12.10.2 Estimating the incremental borrowing rate
As the Group cannot readily determine the interest rate implicit in the lease, it uses its incremental borrowing rate (“IBR”) to measure the lease liabilities. The IBR is the rate of interest that the Group would have to pay to borrow over a similar term, and with a similar security, the funds necessary to obtain an asset of a similar value to the right-of-use asset in a similar economic environment. The IBR therefore reflects what the Group “would have to pay”, which requires estimation when no observable rates are available (or when they need to be adjusted to reflect the terms and conditions of the lease). The Group estimates the IBR using observable input when available and is required to make certain entity-specific adjustments.
2.12.11 Deferred tax assets
Deferred tax assets are recognised in respect of tax losses to the extent that it is probable that future taxable profit will be available and can be utilised against such tax losses. Judgement is required to determine the amount of deferred tax assets that can be recognised, based upon the likely timing and level of future taxable profits, together with future tax-planning strategies.
Refer Note 41 for details.
2.12.12 Defined benefit obligation
The costs of the defined benefit plans are determined using an actuarial valuation. The actuarial valuation involves making assumptions about discount rates, expected rates of return on assets, future salary increases, mortality rates, future pension increase, etc. Due to the long-term nature of these plans, such estimates are subject to significant uncertainty.
The Bank generally uses the long-term treasury bond rate as the discount rate for the purpose of assessing the present value of future obligations. The treasury bond rates increased significantly during the year and were around 30% range during the latter part of 2022. As per the “Frequently Asked Questions (FAQs) on Use of Discount rate under the uncertain Economic Conditions” issued by the CA Sri Lanka, an adjusted treasury bond rate can be considered as the discount rate for the purpose of the actuarial valuations as at December 31, 2022, on the basis that the current treasury bond rates do not reflect only the time value of money. Accordingly, an adjusted discount rate of 18% was derived by removing a credit spread from the current treasury bond rate.
 Refer Note 48 for the assumptions used.
2.12.13 Impact of climate risk
The Group and its customers are exposed to the physical risks from climate change and risks of transitioning to a net-zero economy. Most climate-related physical risks are expected to manifest over a term that is generally longer than the maturity of most of the outstanding exposures. The following balances may be impacted by physical and transition risks:
ECL: Customers and portfolios with exposure to climate risk may have a resultant deterioration in creditworthiness, which has an impact on ECL. On the whole, the Group is of the view that the counterparties who have exposures to climate risk are not expected to be materially impacted by physical or transition risks associated with climate change. For example, the majority of the counterparties are not employed, or do not operate, in high-risk sectors, nor are they located in high risk geographical areas. It was also noted that for a significant part of the portfolio, the time horizon for any physical impact of climate risk is longer than the maturity of most of the assets as described in Note 60.
Fair value measurement: The Bank has assumed that any climate change variables incorporated in fair value measurement are those that market participants would consider when pricing the asset or liability, in line with SLFRS 13. The Bank has concluded that climate risk has been adequately reflected within the fair value.
2.12.14 Provisions for liabilities, commitments and contingencies
The Group receives legal claims in the normal course of business. Management has made judgements as to the likelihood of any claim succeeding in making provisions. The time of concluding legal claims is uncertain, as is the amount of possible outflow of economic benefits. Timing and cost ultimately depends on the due processes in respective legal jurisdictions.
Information about significant areas of estimation uncertainty and critical judgements in applying Accounting Policies other than those stated above that have significant effects on the amounts recognised in the Consolidated Financial Statements are described in Notes 7.10 to 7.15.
2.13 Events after the reporting period
Events after the reporting period are those events, favourable and unfavourable, that occur between the reporting date and the date when the Financial Statements are authorised for issue.
In this regard, all material and important events that occurred after the reporting period have been considered and appropriate disclosures are made in Note 68, where necessary.
3. Financial Risk Management
3.1 Introduction and overview
Like any other business model, risk is inherent in the Bank’s activities too and attempts to manage through a process of ongoing identification, measurement and monitoring, subject to risk limits and controls are adopted to mitigate possible consequences arising out of volatile and fluid outcomes in the internal and external environment.
The process of risk management is identified as critical to maintain Bank’s continuing profitability. Managing the changing stakeholder dynamics whilst preserving culture and value system of the Bank is considered as a priority in the business operation.
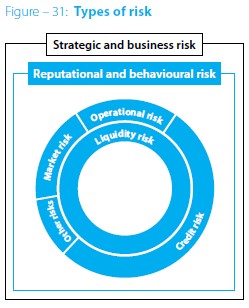
The Group has exposure mainly to the following broad risk categories arising out of its business activities that are undertaken in its day to day functions:
- Strategic and business risk;
- Credit risk;
- Reputational risk;
- Liquidity risk;
- Market risk;
- Operational risk;
- Conduct risk;
- Social and environmental risk.
Amidst an environment where the country is wading through socio-political-economical bog land filled with uncertainty and possible pit falls in 2022. The global economy is getting ready for a recession in 2023. Unprecedented elevated levels of risk in the business environment and the nuances and correlations associated with different key risk categories acted as major challenges in this continuously evolving risk universe which is going through a constant state of flux.
3.2 Bank’s risk management framework

The Board of Directors of the Bank has the overall responsibility for the establishment and oversight of the Bank’s Risk Management Framework.
The Risk Management Framework of the Bank translates overall risk appetite on business activities in a holistic approach to provide the guidance required for convergence of strategic and risk perspectives of the Bank.
The Group’s risk management policies are established to identify and analyse the risks faced by the Group, to set appropriate risk limits and controls to monitor risks and adherence to limits. The Risk Management Policy Framework constitutes the Credit Policy, Lending Guidelines, Credit Risk Review Policy, ALM Policy including Contingency Funding Plan, Foreign Exchange Policy, Operational Risk Policy, IT Risk Policy, Market Risk Policy, Stress Testing Policy, Financial & Risk Management Disclosure Policy, Conduct Risk Management Policy, Group Social and Environmental Policy and Reputational Risk Management Policy etc., which have been firmly established to provide control and guidance for decision-making throughout the Bank in a uniform manner.
The Committee structure embedded to the Risk Management Framework acts as a fact finding and decision-making authority through deliberations and arriving at consensus arising out of multiple points of views. The Risk Management Committees effectively deliberate on matters at hand to provide guidance to the business lines with a view to managing risk in accordance with the strategic goals and risk appetite of the Bank.
The Board of Directors of the Bank has formed the Board Integrated Risk Management Committee (BIRMC) as a mandatory Board Committee, as per Banking Act Direction No. 11 of 2007 on Corporate Governance. The performance of the Committee and the duties and roles of members are reviewed by the Board annually or more frequently, if warranted.
The meetings of the Executive Integrated Risk Management Committee (EIRMC) are conducted on a monthly basis to discuss Credit, Operational, Market, IT and Social and Environmental risk matters of the Bank. Assets and Liabilities Committee (ALCO), that convene at least once a fortnight, gives priority for liquidity, funding and profitability in line with the changes taken place in the market.
Risk Control Self-Assessment (RCSA) framework is adopted to identify risks involved in business activities of the Bank and to implement appropriate risk mitigatory measures after assessing criticality of such risks. The Integrated Risk Management Department (IRMD) carries out semi-annual Bank-wide RCSA exercise focusing on adherence to laws, regulations, and regulatory guidelines as well as internal controls and approved policies.
Further, the Internal Audit function of the Bank independently monitors and evaluates the risk management function of the Bank and provides its views on the adequacy of the Risk Management Framework to the Board Audit Committee (BAC).
Strategic and business risk
Bank’s inability to keep up with the evolving market dynamics, resulting in loss of market share and failure to achieve strategic goals in line with its Vision and Mission is identified as Strategic risk.
Business risk refers to any risk that arises from the Bank’s long-term business strategies and affects its profitability, and relatively short term in nature.
Management of strategic and business risk
Corporate planning and budgeting process and continuous evaluation of their alignment with the Bank’s Vision, Mission and the risk appetite facilitate management of strategic risk. In the annual Internal Capital Adequacy Assessment Process (ICAPP) exercise of the Bank, detailed scorecard-based qualitative models are used to measure and monitor strategic risk of the Bank. This scorecard-based approach takes a number of variables into account, including the size and sophistication level of the Bank, the nature and complexity of its operations and highlights the areas that require focus to mitigate potential strategic risks.
Business risk of the Bank is managed through its day to day decisions made by the line managers and also at different Management Committees in identifying, assessing and remediating such risks.
Also, in line with the Banking Act Direction No. 09 of 2021, commencing from 2022, the Bank being the largest private sector bank in the industry designated as a Domestic Systemically Important Bank (D-SIB), has developed its Recovery Plan. This plan outlines the Bank's transition from Business-As-Usual (BAU) to different degrees of elevated risk conditions, highlighting the preparedness to the recovery actions, if the financial deterioration occurs and is not rectified.
Credit risk
The risk that the Bank will incur a loss due to its customers or counterparties failing to discharge their contractual obligations, is considered generally under the credit risk assessment.
The Bank manages and controls credit risk by setting limits on the amount of risk it is willing to accept for individual counterparties, groups of counterparties, geographies, business sectors, and industries by monitoring exposures and possible adverse external factors in relation to such limits.
Management of credit risk
Lending Guidelines of the Bank has been formulated based on evolving practices of lending to provide expected granularity of credit assessment and thereby, to ensure strict attention to risks emanating from lending proposals at the time of initiation, analysis, and approval. In addition, Lending Guidelines ensures objective assessment of acceptability of collateral as well as limits on exposures and concentration levels to various sectors, counterparties, geographies and segments etc.
A robust risk grading system in line with the Basel guidelines on rating of facilities and counterparties is adopted by the Bank for evaluation of credit proposals. This risk grading framework consists of 10 grades of gradually escalating continuum of risks as indicators for the Lending Officers to evaluate and arrive at suitable risk reward trade-offs in their propositions. These risk grades were validated by internationally accepted consultants and are reviewed by the IRMD regularly.
Credit Risk Review function covers over 30% of the advances portfolio of the Bank using the Loan Review Mechanism (LRM). This continuous exercise provides reasonable assurance that all major credit risks embedded in the operation of lending is carried out in line with the stipulated guidelines and within the risk appetite framework of the Bank.
Early Warning Signals (EWS) system which is currently being adopted based on Machine Learning/Regression analysing prediction model to assist Lending Officers. This will reciprocally affect in detecting problematic advances, industries whilst inversely provide insights to identify potential lending opportunities. This tool is used to maintain the quality of the Loan Book of the Bank.
Portfolio level credit risk analyses are taken up at monthly EIRMC meetings as well as quarterly at BIRMC meetings. Individual credit proposals evaluated by the Lending Officers are approved by the Authorising Officers within the hierarchy in delegated authority levels whilst ensuring a minimum of the Four Eyes Principle, when approving them. Approval levels are escalated based on delegated authority levels attached to exposure levels, final risk ratings, changes of risk appetite for specific industries as well as negative deviation of performance levels as compared to previous facilities extended to borrowers.
The Executive Credit Committee (ECC) and the Board Credit Committee (BCC) are responsible for approving credit facilities with high value while the Board will be the ultimate authority for approving facilities exceeding predetermined threshold levels. Deliberations take place at the BCC level on facilities being considered for approval beyond the specified threshold and recommendations for approval of the Board are made based on quantum of exposures at various levels.
The IRMD provides risk approval for individual proposals above predetermined threshold levels, consequent to a rigorous independent risk evaluation guided by Credit Policy, Lending Guidelines, and circular instructions within a limit framework stemming from risk appetite of the Bank.
Across the globe, banks are intensifying their approach towards early recognition of impaired credit assets and thereby, taking proactive efforts in readying their institutions to encounter possible economic downturns. Most regulators of the banking sector around the world expect the financial institutions in their markets to implement robust credit risk estimation models and align the decision-making process based on such robust models. Forward looking impairment provision approach is significantly different from the traditional approach of providing for Incurred Loss Assets. The Expected Credit Loss (ECL) model introduced under the SLFRS 9 replaced the Incurred Loss Model, which was considered inadequate in recognising credit losses in a proactive manner and had failed in accurately estimating the credit losses during economic stress conditions. Accordingly, the Bank also had duly adopted the ECL modelling in impairment computations. IRMD involves in Independent oversight on Individually Significant Loans (ISLs) to improve accuracy of cash flow projections bringing in a more robust and specific approach to the classification, recognition and measurement of credit facilities. Also the CBSL had issued the Banking Act Direction No. 13 of 2021, which spells out clear procedures to be adopted by banks in impairment computations.
Commencing from January 01, 2022, IRMD has been entrusted with the responsibility of objective assessment of credit facilities for upgrading purpose as per the provisions of the Banking Act Direction No. 13 of 2021. Accordingly, models used for calculation of impairment would be evaluated/ recommended by the IRMD under the specific supervision of the Chief Risk Officer. Upgrading of restructured and rescheduled credit facilities shall only be carried out by the IRMD and shall be independent from the credit facility review mechanism.
Social and environmental risk
Impending negative consequences to the Bank that arise from impacts or perceived impacts on the natural environment or communities of people through the Bank’s lending activities are identified as of paramount importance for the Bank as the risk arising from such can lead to multitude of other risks.
Social and Environmental (S&E) risks typically include environmental pollution, hazards to human health, safety and security, impacts on communities and threats to a region’s biodiversity and cultural heritage. Failure to effectively manage Social and Environmental issues affecting the Bank, can lead to a range of financial, legal and reputational consequences.
The Bank manages its exposure to Social and Environmental risks through a Social and Environmental Management System (SEMS) which includes the policies, procedures, assessment tools and human resources allocated for the management and appraisal of Social and Environmental Risks.
Management of social and environmental risk
As an integral part of the credit risk management, the Bank manages the Social and Environmental risks of lending activities.
The Bank’s SEMS framework is based on the IFC Performance Standards where each lending facility extended by the Bank is screened and categorised based on their Social and Environmental Risk intensity.
Social and Environmental Due Diligences exercises are carried out as and when required and corrective actions are proposed for the identified Significant Social and Environmental Risks in line with the relevant policies and guidelines. Performance of the borrowers monitored periodically to ensure the implementation of S&E corrective actions and continuously complying with the Country’s S&E regulations.
The Bank also has a well-defined decision-making process, duly described roles and responsibilities as well as documentation and record keeping requirements in relation to SEMS.
Liquidity risk
The risk that the Bank will encounter difficulty in meeting obligations associated with the financial liabilities that are settled by delivering cash or another financial asset is focused on this risk domain. Liquidity risk arises because of the possibility that the Bank might be unable to meet its payment obligations or not receiving what is due to the Bank when they fall due under both normal and stress circumstances.
To limit this risk, Management has arranged diversified funding sources in addition to its core deposit base and adopted a policy of managing assets with liquidity in mind and monitoring future cash flows and liquidity on a daily basis. The Bank has reviewed and strengthened its internal control processes and contingency plans for managing liquidity risk.
Management of liquidity risk
Market Risk Management Policy and the ALM Policy of the Bank approved by the Board of Directors set the tone for managing liquidity risk of the Bank. Liquidity risk of the Bank is given utmost priority when managing a wide range of other risks because it is considered as the most critical risk for any financial institution.
The Bank’s Treasury Department is entrusted with managing liquidity of the Bank on a real time basis to ensure smooth functioning of business activities of all other business units of the Bank. Additionally, a team of members of the Corporate Management level, most of them being ALCO members, carefully analyse the foreign currency liquidity position of the Bank taking into consideration, both short term and medium term cash flow gaps, more frequently.
Access to a substantial stable Current Account and Savings Account (CASA) base due to its wide branch network and the top of the mind perception created among the depositors, provide immense strength to the Bank in managing liquidity. Also, the growing balance sheet size, higher rating and continuous rapport maintained with local and international counterparty banks have helped immensely to the Bank to maintain adequate foreign currency liquidity amidst stressed Market conditions.
Having an adequate buffer of High Quality Liquid Assets (HQLA) at the disposal of the Bank is another plus factor for the Bank. The strength of such portfolio is amply reflected in the Basel III computation the Bank carries out for arriving at Liquidity Coverage Ratio (LCR) and Net Stable Funding Ratio (NSFR) as per the CBSL Direction, which recorded very healthy results as compared to regulatory minimum threshold levels.
Amidst the challenging economic conditions experienced by the country since the Easter Sunday terrorist attack and COVID-19 pandemic, which triggered the default of country’s foreign debt repayment in 2022, an assessment of expected foreign currency cash inflows and outflows has been carried out by the Bank to assure smooth functioning of its business activities.
The Bank has experienced accumulation of rupee liquidity above the minimum regulatory requirements as a result of sluggish economic performance of the country since 2020. However, having adopted many strategies to invest excess liquidity at optimum yields but in staggered maturities and thereby to minimise the negative impact on the bottom line as well as liquidity, the bank is mindful about the excessive exposure to the Government by way of the Government Securities.
Contingency funding plans are in force, constant monitoring of salient liquidity ratios and scenario-based stress testing being carried out regularly would enable the Bank to take proactive measures towards overcoming an adverse liquidity position that may arise on a future date.
Market risk
The risk that the fair value or future cash flows of financial instruments will fluctuate due to changes in market variables such as interest rates, foreign exchange rates and equity prices comes under the ambit of Market risk. The Bank classifies exposures to Market Risk into either Trading or Non-Trading portfolios (Banking Book) and manages each of those portfolios separately.
The Market risk for the Trading portfolio is monitored and managed closely having paid attention to the changes on the prices of market.
Management of market risk
Market Risk Management Policy, ALM Policy and Foreign Exchange Risk Policy are the three main policies that constitute the framework governing the Market Risk Management function of the Bank. Due to the business model adopted by the Bank, exposure to equity and commodity risk was kept at bay throughout the year.
However, Interest Rate Risk arising from the Banking Book as well as Trading Book and Foreign Exchange Risk arising from dealing in assets and liabilities denominated in currencies other than local currency, continued to expose the Bank to associated risk elements.
Escalation of the interest rates since the second half of 2021 posed challenges to the NIM as the demand for advances had not risen up since the COVID-19 period and the adverse economic conditions that prevailed in the country subsequently.
Interest rates of the Banking Book is subjected to varying degrees of rate shocks to simulate and identify impact on earnings perspective in such rate scenarios. The results of such predictions could assist the Bank in formulating strategies to manage the financial position in an effective manner with the limited choices available in the local market.
Trading Book too was subjected to Value at Risk (VaR) framework internally carried out by the Bank on a regular basis. The Bank also carried out sensitivity analysis on a regular basis to ascertain the impact on portfolios maintained, mainly in Government Securities and marking to market of such portfolios to reflect fair value of underlying assets for the decision-making process.
Foreign exchange positions were maintained within the regulatory framework in a market where a high volatility is observed in the major currency, compared to the previous year that the Bank deals in, i.e., US Dollars. The positions were subjected to continuous sensitivity analysis to provide insights to possible losses arising from currency depreciation, amidst the thin Foreign Currency Reserve position of the country, as the reporting currency of the Bank being Sri Lankan Rupees.
Operational risk
The risk that the Bank will incur a loss due to failure of systems, human errors, frauds or external events is focused on this risk domain. When controls fail to operate effectively, operational risks can cause damage to reputation, have legal or regulatory implications or lead to financial loss. The Bank cannot expect to eliminate all operational risks, but it endeavours to manage these risks through a control framework and by monitoring, escalating, reporting and responding to potential risks.
Circular Instructions and Operational Risk Management Policy play a major part in bringing together business practices with accepted benchmarks to ensure minimum disruption to processes, personnel, technology and infrastructure.
Internal control framework and audit function with firmly established “three lines of defences” serve the Bank to manage operational risk at current acceptable levels.
Sound Operational Risk Management practices are embedded into the work process through the Bank’s culture, internal policy framework and as per regulatory requirements.
IT Risk of the Bank is managed through strict monitoring of Key IT Risk Indicators while Vulnerability Assessment and Penetration Tests are being carried out by both internal and external parties at regular intervals to identify the relevant risks.
Controls include effective segregation of duties, access, authorisation and reconciliation procedures, staff education and assessment processes, such as the use of internal audit.
Conduct risk and reputational risk
Risk that can arise as a result of mis selling, unethical business practices, professional misbehaviours, governance weaknesses etc, intend to be manage through such elaborate and intricate framework well established over decades of existence.
The risk that the Bank’s reputation will be damaged by one or more than one reputation event, as reflected from negative publicity about the Bank’s business practices, conduct or financial condition. Such negative publicity, whether true or not, may impair public confidence in the Bank, result in costly litigation, or lead to a decline in its customer base, business or revenue.
Management of the Conduct and Reputational risk is underpinned by a comprehensive policy framework approved by the Board of Directors.
Refer Note 66 for “Financial risk review”.
A detailed write-up on how the risk management is carried out within the Bank’s Risk Management Framework with due consideration given to factors such as governance, identification, assessment, monitoring, reporting and mitigation are discussed in the section on “Risk Governance and Management”.
7. Significant Accounting Policies – Recognition of assets and liabilities
7.1 Financial instruments – initial recognition, classification and subsequent measurement
7.1.1 Date of recognition
The Group initially recognises loans and advances, deposits and subordinated liabilities, etc., on the date on which they are originated. All other financial instruments (including regular-way purchases and sales of financial assets) are recognised on the trade date, which is the date on which the Group becomes a party to the contractual provisions of the instrument.
7.1.2 Initial measurement of financial instruments
The classification of financial instruments at initial recognition depends on their cash flow characteristics and the business model for managing the instruments. Refer Notes 7.1.3 and 7.1.4 for further details on classification of financial instruments.
A financial asset or financial liability is measured initially at fair value plus or minus transaction costs that are directly attributable to its acquisition or issue, except in the case of financial assets and financial liabilities at fair value through profit or loss as per SLFRS 9 and trade receivables that do not have a significant financing component as defined in Sri Lanka Accounting Standard – SLFRS 15 on “Revenue from Contracts with Customers” (SLFRS 15).
Transaction cost in relation to financial assets and financial liabilities at fair value through profit or loss are dealt with through the Income Statement.
Trade receivables that do not have a significant financing component are measured at their transaction price at initial recognition as defined in SLFRS 15.
When the fair value of financial instruments (except trade receivables that do not have a significant financing component) at initial recognition differs from the transaction price, the Group accounts for the Day 1 profit or loss, as described below.
7.1.2.1 “Day 1” profit or loss
When the transaction price of the instrument differs from the fair value at origination and fair value is based on a valuation technique using only inputs observable in market transactions, the Group recognises the difference between the transaction price and fair value in net gains/(losses) from trading. In those cases, where the fair value is based on models for which some inputs are not observable, the difference between the transaction price and the fair value is deferred and is only recognised in profit or loss when the inputs become observable, or when the instrument is derecognised.
The “Day 1 loss” arising in the case of loans granted to employees at concessionary rates under uniformly applicable schemes is deferred and amortised using Effective Interest Rates (EIR) in “Interest income” and “Personnel expenses” over the remaining service period of the employees or tenure of the loan whichever is shorter in line with SLFRS 9 and Sri Lanka Accounting Standard – LKAS 19 on “Employee Benefits” (LKAS 19).
Refer Notes 13 and 19.
7.1.3 Classification and subsequent measurement of financial assets
As per SLFRS 9, the Group classifies all of its financial assets based on the business model for managing the assets and the assets’ contractual terms measured at either;
- Amortised cost
- Fair value through other comprehensive income (FVOCI)
- Fair value through profit or loss (FVTPL)
The subsequent measurement of financial assets depends on their classification.
7.1.3.1 Business model assessment
The Group makes an assessment of the objective of a business model in which an asset is held at a portfolio level and not assessed on instrument-by-instrument basis because this best reflects the way the business is managed and information is provided to management. The information considered includes:
- the stated policies and objectives for the portfolio and the operation of those policies in practice. In particular, whether Management’s strategy focuses on earning contractual interest revenue, maintaining a particular interest rate profile, matching the duration of the financial assets to the duration of the liabilities that are funding those assets or realising cash flows through the sale of the assets;
- how the performance of the portfolio is evaluated and reported to the Group’s Management;
- the risks that affect the performance of the business model (and the financial assets held within that business model) and how those risks are managed;
- how managers of the business are compensated – e.g. whether compensation is based on the fair value of the assets managed or the contractual cash flows collected; and
- the frequency, volume and timing of sales in prior periods, the reasons for such sales and its expectations about future sales activity. However, information about sales activity is not considered in isolation, but as part of an overall assessment of how the Group’s stated objective for managing the financial assets is achieved and how cash flows are realised.
The business model assessment is based on reasonably expected scenarios without taking “worst case” or “stress case” scenarios into account. If cash flows after initial recognition are realised in a way that is different from the Group's original expectations, the Group does not change the classification of the remaining financial assets held in that business model, but incorporates such information when assessing newly originated or newly purchased financial assets going forward.
7.1.3.2 Assessment of whether contractual cash flows are solely payments of principal and interest (SPPI test)
As a second step of its classification process the Group assesses the contractual terms of financial assets to identify whether they meet the SPPI test.
For the purposes of this assessment, “principal” is defined as the fair value of the financial asset on initial recognition and may change over the life of the financial asset (for example, if there are repayments of principal or amortisation of the premium/discount).
“Interest” is defined as consideration for the time value of money and for the credit risk associated with the principal amount outstanding during a particular period of time and for other basic lending risks and costs, as well as profit margin.
In contrast, contractual terms that introduce a more than de minimis exposure to risks or volatility in the contractual cash flows that are unrelated to a basic lending arrangement do not give rise to contractual cash flows that are solely payments of principal and interest on the principal amount outstanding. In such cases, the financial asset is required to be measured at FVTPL.
In assessing whether the contractual cash flows are solely payments of principal and interest on principal amount outstanding, the Group considers the contractual terms of the instrument. This includes assessing whether the financial asset contains a contractual term that could change the timing or amount of contractual cash flows such that it would not meet this condition. In making the assessment, the Group considers:
- contingent events that would change the amount and timing of cash flows;
- leverage features;
- prepayment and extension terms;
- terms that limit the Group’s claim to cash flows from specified assets; and
- features that modify consideration of the time value of money.
The Group holds a portfolio of long-term fixed rate loans for which the Group has the option to propose to revise the interest rate at periodic reset dates. These reset rights are limited to the market rate at the time of revision. The borrowers have an option to either accept the revised rate or redeem the loan at par without penalty. The Group has determined that the contractual cash flows of these loans are solely payments of principal and interest because the option varies the interest rate in a way that is consideration for the time value of money, credit risk, other basic lending risks and costs associated with the principal amount outstanding.
 Refer Notes 7.1.3.3 to 7.1.3.5 below for details on different types of financial assets recognised on the SOFP.
7.1.3.3 Financial assets measured at amortised cost
A financial asset is measured at amortised cost if it meets both of the following conditions and is not designated as at FVTPL:
- The asset is held within a business model whose objective is to hold assets to collect contractual cash flows; and
- The contractual terms of the financial asset give rise on specified dates to cash flows that are solely payments of principal and interest on the principal amount outstanding.
Financial assets measured at amortised cost are given in Notes 7.1.3.3.1 to 7.1.3.3.6 below.
7.1.3.3.1 Loans and advances to other customers
Loans and advances to other customers include amounts due from loans and advances and lease receivables from the customers of the Group.
Details of “Loans and advances to other customers” are given in Note 33.
7.1.3.3.2 Securities purchased under resale agreements (reverse repos)
When the Group purchases a financial asset and simultaneously enters into an agreement to resale the asset (or a similar asset) at a fixed price on a future date (reverse repo), the arrangement is accounted for as a financial asset in the SOFP reflecting the transaction’s economic substance as a loan granted by the Group. Subsequent to initial recognition, these securities issued are measured at amortised cost using the EIR with the corresponding interest income/ receivable being recognised as interest income in profit or loss.
Details of “Securities purchased under resale agreements” are given in the SOFP.
7.1.3.3.3 Debt and other financial instruments measured at amortised cost
Details of “Debt and other financial instruments measured at amortised cost” are given in Note 34.
7.1.3.3.4 Cash and cash equivalents
Details of “Cash and cash equivalents” are given in Note 28.
7.1.3.3.5 Balances with central banks
Details of “Balances with central banks” are given in Note 29.
7.1.3.3.6 Placement with banks
Details of “Placement with banks” are given in Note 30.
7.1.3.4 Financial assets measured at FVOCI
Financial assets at FVOCI include debt and equity instruments measured at fair value through other comprehensive income.
For financial assets measured at FVOCI refer Notes 7.1.3.4.1 and 7.1.3.4.2.
7.1.3.4.1 Debt instruments measured at FVOCI
Debt instruments are measured at FVOCI if they are held within a business model whose objective is to hold for collection of contractual cash flows and selling financial assets, where the asset’s contractual cash flows represent payments that are solely payments of principal and interest on principal outstanding. Details of “Debt instruments at FVOCI” are given in Note 35.
7.1.3.4.2 Equity instruments designated at FVOCI
Upon initial recognition, the Group elects to classify irrevocably some of its equity instruments held for strategic and regulatory purposes as equity instruments at FVOCI. Details of “Equity instruments at FVOCI” are given in Note 35.
7.1.3.5 Financial assets measured at FVTPL
All financial assets other than those classified at amortised cost or FVOCI are classified as measured at FVTPL. Financial assets measured at FVTPL include financial assets that are held for trading or managed and whose performance is evaluated on a fair value basis because they are neither held to collect contractual cash flows nor held both to collect contractual cash flows and to sell as discussed in Notes 7.1.3.5.1 and 7.1.3.5.2 below.
7.1.3.5.1 Financial assets held for trading
Details of “Financial Assets held for trading” are given in Note 32.
Details of “Derivative financial assets” recorded at fair value through profit or loss are given in Note 31.
7.1.3.5.2 Financial assets designated at FVTPL
On initial recognition, the Group may irrevocably designate a financial asset that otherwise meets the requirements to be measured at amortised cost or at FVOCI as at FVTPL when such designation eliminates or significantly reduces an accounting mismatch that would otherwise arise from measuring the assets or liabilities or recognising gains or losses on them on a different basis.
Financial assets designated at FVTPL are recorded in the SOFP at fair value. Changes in fair value are recorded in “Net gain or loss on financial instruments designated at FVTPL”. Interest earned is accrued in “Interest Income”, using the EIR, while dividend income is recorded in “Other operating income” when the right to receive the payment has been established.
The Group has not designated any financial assets upon initial recognition as at FVTPL as at the end of the reporting period.
7.1.4 Classification and subsequent measurement of financial liabilities
The Group classifies financial liabilities, other than financial guarantees and loan commitments into one of the following categories:
- Financial liabilities at FVTPL, and within this category as –
– Held-for-trading; or
– Designated at FVTPL;
- Financial liabilities measured at amortised cost.
The subsequent measurement of financial liabilities depends on their classification.
 Refer Notes 7.1.4.1 and 7.1.4.2 as detailed below:
7.1.4.1 Financial liabilities at FVTPL
Financial liabilities at FVTPL include financial liabilities held for trading and financial liabilities designated upon initial recognition as at FVTPL. Refer Notes 7.1.4.1.1 and 7.1.4.1.2 below.
7.1.4.1.1 Financial liabilities held for trading
Details of “Derivative financial liabilities” classified under financial liabilities held for trading are given in Note 44.
7.1.4.1.2 Financial liabilities designated at FVTPL
Financial liabilities designated at FVTPL are recorded in the SOFP at fair value when;
- The designation eliminates, or significantly reduces, the inconsistent treatment that would otherwise arise from measuring the assets or liabilities or recognising gains or losses on them on a different basis, or
- A group of financial liabilities or financial assets and financial liabilities is managed and its performance is evaluated on a fair value basis, in accordance with a documented risk management or investment strategy, and information about the group is provided on that basis to entity’s Key Management Personnel, or
- The liabilities containing one or more embedded derivatives, unless they do not significantly modify the cash flows that would otherwise be required by the contract, or it is clear with little or no analysis when a similar instrument is first considered that separation of the embedded derivative(s) is prohibited.
Changes in fair value are recorded in “Net fair value gains/ (losses) from financial instruments at FVTPL” with the exception of movements in fair value of liabilities designated at FVTPL due to changes in the Bank’s own credit risk. Such changes in fair value are recorded in the own credit reserve through OCI and do not get recycled to profit or loss. Interest paid/payable is accrued in “Interest expense”, using the EIR.
The Group has not designated any financial liabilities as at FVTPL as at the end of the reporting period.
7.1.4.2 Financial liabilities at amortised cost
Financial liabilities of the Group that are not measured at FVTPL are classified as financial liabilities at amortised cost under “Due to banks”, “Securities sold under repurchase agreements”, “Due to depositors”, “Other borrowings” or “Subordinated liabilities” as appropriate, where the substance of the contractual arrangement results in the Group having an obligation either to deliver cash or another financial asset to the holder, or to satisfy the obligation other than by the exchange of a fixed amount of cash or another financial asset for a fixed number of own equity shares.
The Group classifies capital instruments as financial liabilities or equity instruments in accordance with the substance of the contractual terms of the instrument.
After initial recognition, such financial liabilities are subsequently measured at amortised cost using the EIR method. Amortised cost is calculated by taking into account any discount or premium on acquisition and fee or costs that are an integral part of the EIR.
The EIR amortisation is included in “Interest expense” in profit or loss. Gains and losses too are recognised in profit or loss when the liabilities are derecognised as well as through the EIR amortisation process.
7.1.4.2.1 Due to banks
Details of “Due to banks” are given in Note 43.
7.1.4.2.2 Securities sold under repurchase agreements (repos)
When the Group sells a financial asset and simultaneously enters into an agreement to repurchase the asset (or a similar asset) at a fixed price on a future date (repos), the arrangement is accounted for as a financial liability in the SOFP reflecting the transaction’s economic substance as a deposit. Subsequent to initial recognition, these securities are measured at amortised cost using the EIR with the corresponding interest payable being recognised as “interest expense” in profit or loss.
Details of “Securities sold under repurchase agreements (repos)” are given in the SOFP.
7.1.4.2.3 Due to depositors
Details of “Due to depositors” are given in Note 45.
7.1.4.2.4 Other borrowings
Details of “Other borrowings” are given in Note 46.
7.1.4.2.5 Subordinated liabilities
Details of “Subordinated liabilities” are given in Note 50.
7.1.5 Derivatives held for risk management purposes and hedge accounting
Derivatives held for risk management purposes include all derivative assets and liabilities that are not classified as trading assets and liabilities. Derivatives held for risk management purposes are measured at fair value in the SOFP.
The Group designates certain derivatives held for risk management as well as certain non-derivative financial instruments as hedging instruments in qualifying hedging relationships. On initial designation of the hedge, the Group formally documents the relationship between the hedging instrument and hedged item, including risk management objective and strategy in undertaking the hedge, together with the method that will be used to assess the effectiveness of the hedging relationship. The Group makes an assessment, both at inception of the hedge relationship and on an ongoing basis, of whether the hedging instrument is expected to be highly effective in offsetting the changes in fair value or cash flow of the respective hedged item during the period for which the hedge is designated, and whether the actual results of each hedge are within a range of 80% to 125%. The Group makes an assessment for a cash flow hedge of a forecast transaction, of whether the forecast transaction is highly probable to occur and presents an exposure to variations in cash flows that could ultimately affect profit or loss.
The Group currently uses cash flow hedging relationships for risk management purposes. Different types of hedges and derivatives are discussed in Notes 7.1.5.1 to 7.1.5.5 below:
7.1.5.1 Fair value hedges
When a derivative is designated as the hedging instrument in a hedge of the change in fair value of a recognised asset or liability or a firm commitment that could affect the profit or loss, changes in the fair value of the derivative are recognised immediately in profit or loss in the same line item as the hedged item that is attributable to the hedged risk.
If the hedging derivative expires or is sold, terminated or exercised, or the hedge no longer meets the criteria for fair value hedge accounting, or the hedge designation is revoked, then hedge accounting is discontinued prospectively. However, if the derivative is novated to a central counterparty by both parties as a consequence of laws or regulations without changes in its terms except for those are necessary for the novation, then the derivative is not considered as expired or terminated.
Any adjustment up to the point of discontinuation to a hedged item for which the effective interest method is used is amortised to profit or loss as part of the recalculated EIR of the item over its remaining life.
7.1.5.2 Cash flow hedges
When a derivative is designated as the hedging instrument in a hedge of the variability in cash flows attributable to a particular risk associated with a recognised asset or liability that could affect the profit or loss, the effective portion of changes in the fair value of the derivative are recognised in OCI and presented in the hedging reserve within equity. Any ineffective portion of changes in the fair value of the derivative is recognised immediately in profit or loss.
The amount recognised in OCI is reclassified to profit or loss as a reclassification adjustment in the same period as the hedged cash flows affect profit or loss, and in the same line item in the Statement of Profit or Loss and OCI.
If the hedging derivative expires or is sold, terminated or exercised, or the hedge no longer meets the criteria for cash flow hedge accounting, or the hedge designation is revoked, then hedge accounting is discontinued prospectively. However, if the derivative is novated to a central counterparty by both parties as a consequence of laws or regulations without changes in its terms except for those are necessary for the novation, then the derivative is not considered as expired or terminated.
Details of “Cash flow hedges” are given in Note 44.1.
7.1.5.3 Net investment hedges
When a derivative instrument or a non-derivative financial liability is designated as the hedging instrument in a hedge of a net investment in a foreign operation, the effective portion of changes in the fair value of the hedging instrument is recognised in OCI and presented in the translation reserve within equity. Any ineffective portion of changes in the fair value of the derivative is recognised immediately in profit or loss. The amount recognised in OCI is reclassified to profit or loss as a reclassification adjustment on disposal of the foreign operation.
7.1.5.4 Other non-trading derivatives
If the derivative is not held for trading, and is not designated in a qualifying hedging relationship, then all changes in its fair value are recognised immediately in profit or loss as a component of net income from other financial instruments at FVTPL.
7.1.5.5 Embedded derivatives
An embedded derivative is a component of a hybrid instrument that also includes a non-derivative host contract with the effect that some of the cash flows of the combined instrument vary in a way similar to a stand-alone derivative. An embedded derivative causes some or all of the cash flows that otherwise would be required by the contract to be modified according to a specified interest rate, financial instrument price, commodity price, foreign exchange rate, index of prices or rates, credit rating or credit index, or other variable, provided that, in the case of a non-financial variable, it is not specific to a party to the contract. A derivative that is attached to a financial instrument, but is contractually transferable independently of that instrument, or has a different counterparty from that instrument, is not an embedded derivative, but a separate financial instrument.
Derivatives may be embedded in another contractual arrangement (a host contract). The Group treats derivatives embedded in financial liabilities and non-financial host contracts as separate derivatives, if:
- the host contract is not itself carried at FVTPL;
- the terms of the embedded derivative would meet the definition of a derivative if they were contained in a separate contract; and
- the economic characteristics and risks of the embedded derivative are not closely related to the economic characteristics and risks of the host contract.
Separated embedded derivatives are measured at fair value, with all changes in fair value recognised in profit or loss unless they form part of a qualifying cash flow or net investment hedging relationship. Separated embedded derivatives are presented in the SOFP together with the host contract. Derivatives embedded in financial assets are classified based on the business model and their contractual terms and are not separated as explained in Notes 7.1.3.1 and 7.1.3.2.
7.1.6 Reclassification of financial assets and liabilities
Financial assets are not reclassified subsequent to their initial recognition, except and only in those rare circumstances when the Group changes its objective of the business model for managing such financial assets which may include the acquisition, disposal or termination of a business line.
During the year, the Bank reclassified bulk of its treasury bond portfolio, majority of Sri Lanka Development Bond (SLDB) and entire Sri Lanka Sovereign Bond (SLSB) portfolio in FVOCI category to amortised cost category, with effect from April 01, 2022, as a result of changes to the business model of managing the assets due to unprecedented changes in the macroeconomic conditions in line with the guidelines issued by the CA Sri Lanka in the form of a Statement of Alternative Treatment (SoAT) on Reclassification of Debt Portfolio as a one off option. Refer Note 35.1 for further details.
Financial liabilities are not reclassified as such reclassifications are not permitted by SLFRS 9.
7.1.6.1 Timing of reclassification of financial assets
Consequent to the change in the business model, the Bank reclassifies all affected assets prospectively following the change in the business model (the reclassification date). Accordingly, prior periods are not restated.
7.1.6.2 Measurement of reclassification of financial assets
7.1.6.2.1 Reclassification of Financial Instruments at “FVTPL”
- To FVOCI
The fair value on reclassification date becomes the new gross carrying amount. The EIR is calculated based on the new gross carrying amount. Subsequent changes in the fair value is recognised in OCI.
- To Amortised Cost
The fair value on reclassification date becomes the new carrying amount. The EIR is calculated based on the new gross carrying amount.
7.1.6.2.2 Reclassification of Financial Instruments at “FVOCI”
- To FVTPL
The accumulated balance in OCI is reclassified to profit or loss on the reclassification date.
- To Amortised Cost
The financial asset is reclassified at fair value. The cumulative balance in OCI is removed and is used to adjust fair value on the reclassification date. The adjusted amount becomes the amortised cost. As a result, the financial asset is measured at the reclassification date as if it had always been measured at amortised cost.
EIR determined at initial recognition and gross carrying amount are not adjusted as a result of reclassification.
7.1.6.2.3 Reclassification of Financial Instruments at “Amortised Cost”
- To FVOCI
The asset is remeasured to fair value, with any difference being recognised in OCI. EIR determined at initial recognition is not adjusted as a result of reclassification.
- To FVTPL
The fair value on the reclassification date becomes the new carrying amount. The difference between amortised cost and fair value is recognised in profit or loss.
7.1.7 Derecognition of financial assets and financial liabilities
7.1.7.1 Financial assets
The Group derecognises a financial asset (or where applicable a part of thereof) when the contractual rights to the cash flows from the financial asset expire or it transfers the rights to receive the contractual cash flows in a transaction in which substantially all risks and rewards of ownership of the financial asset are transferred or in which the Group neither transfers nor retains substantially all risks and rewards of ownership and it does not retain control of the financial asset.
On derecognition of a financial asset, the difference between the carrying amount of the asset (or the carrying amount allocated to the portion of the asset derecognised) and the sum of the consideration received (including any new asset obtained less any new liability assumed) and any cumulative gain or loss that had been recognised in OCI is recognised in profit or loss.
However, cumulative gain/loss recognised in OCI in respect of equity investment securities designated as at FVOCI is not recognised in profit or loss on derecognition of such securities.
Any interest in transferred financial assets that qualify for derecognition that is created or retained by the Group is recognised as a separate asset or liability.
The Group enters into transactions whereby it transfers assets recognised on its SOFP, but retains either all or substantially all risks and rewards of the transferred assets or a portion of them. In such cases, the transferred assets are not derecognised.
When assets are sold to a third party with a concurrent total rate of return swap on the transferred assets, the transaction is accounted for as a secured financing transaction similar to sale and repurchase transactions because the Group retains all or substantially all risks and rewards of ownership of such assets.
When the Group has transferred its right to receive cash flows from an asset or has entered into a pass-through arrangement and has neither transferred nor retained substantially all the risks and rewards of the asset nor transferred control of the asset, the asset is recognised to the extent of the Group’s continuing involvement in the asset. In that case, the Group also recognises an associated liability. The transferred asset and the associated liability are measured on the basis that reflected the rights and obligations that the Group has retained.
7.1.7.2 Financial liabilities
The Group derecognises a financial liability when its contractual obligations are discharged, cancelled or expired.
7.1.8 Modification of financial assets and financial liabilities
7.1.8.1 Modification of financial assets
If the terms of a financial asset are modified, the Group evaluates whether the cash flows of the modified asset are substantially different. If the cash flows are substantially different, then the contractual rights to cash flows from the original financial asset are deemed to have expired. In this case, the original financial asset is derecognised and a new financial asset is recognised at fair value.
If the cash flows of the modified asset carried at amortised cost are not substantially different, then the modification does not result in derecognition of the financial asset. In this case, the Group recalculates the gross carrying amount of the financial asset and recognises the amount arising from adjusting the gross carrying amount as a modification gain or loss in profit or loss. If such a modification is carried out because of financial difficulties of the borrower, then the gain or loss is presented together with impairment losses measured using a pre modification interest rate. In other cases, it is presented as interest income.
As per Circular No. 2 of 2022 issued by CBSL dated July 07, 2022, the Bank granted appropriate concessions modifying the original contract to the eligible customers affected by extraordinary macroeconomic circumstances in various economic sectors on a case-by-case basis for a period of six months from the date of the circular. In the case of regular instalment loans, the CBSL directed the banks to devise a mechanism to structure the repayment plan not exceeding the contracted instalment value of the existing credit facility with an extended tenure, to match with the repayment capabilities of the customers. For other credit facilities, the banks were required to devise a suitable mechanism to structure the repayment plan. In the case of rupee facilities considered for the concession, the interest rate applicable for concessionary period was limited to the higher of latest contractual interest rate and the Standard Lending Facility Rate applicable on the date of the circular i.e. 15.5%. In the case of foreign currency facilities, the banks were allowed to charge mutually agreed concessionary interest rate with the customer.
Modifications to the original terms and conditions of the loans due to the above concessions, did not result in derecognition of the original loans as the Management concluded that the modifications were not substantial. Accordingly, a modification loss has been recognised under interest income.
7.1.8.2 Modification of financial liabilities
Where an existing financial liability is replaced by another from the same lender on substantially different terms or the terms of an existing liability are substantially modified, such an exchange or modification is treated as a derecognition of the original liability and the recognition of a new liability. In this case, a new financial liability based on the modified terms is recognised at fair value. The difference between the carrying amount of the financial liability extinguished and the new financial liability with modified terms is recognised in profit or loss.
7.1.9 Offsetting of financial instruments
Financial assets and financial liabilities are offset and the net amount reported in the SOFP if, and only if, there is a currently enforceable legal right to offset the recognised amounts and there is an intention to settle on a net basis, or to realise the assets and settle the liabilities simultaneously.
Income and expenses are presented on a net basis only when permitted under SLFRSs, or for gains and losses arising from a group of similar transactions such as in the Group’s trading activity.
7.1.10 Amortised cost and gross carrying amount
The “amortised cost” of a financial asset or financial liability is the amount at which the financial asset or financial liability is measured on initial recognition minus the principal repayments, plus or minus the cumulative amortisation using the EIR method of any difference between that initial amount and the maturity amount and, for financial assets, adjusted for any ECL allowance.
The “gross carrying amount of a financial asset” is the amortised cost of a financial asset before adjusting for any ECL allowance.
7.1.11 Fair value of financial instruments
Fair value measurement of financial instruments including the fair value hierarchy is explained in Notes 4 and 27.
7.1.12 Identification and measurement of impairment of financial assets
7.1.12.1 Overview of the ECL principles
The Group records an allowance for ECL for loans and advances to other customers, debt and other financial instruments measured at amortised cost, debt instruments measured at FVOCI, any other financial assets measured at amortised cost, loan commitments and financial guarantee contracts.
SLFRS 9 outlines a “three-stage” model for impairment based on changes in credit quality since initial recognition.
- Stage 1: A financial asset that is not originally credit impaired on initial recognition is classified in Stage 1. Financial instruments in Stage 1 have their ECL measured at an amount equal to the proportion of lifetime expected credit losses (LTECL) that result from default events possible within next 12 months (12M ECL).
- Stage 2: If a significant increase in credit risk (SICR) since origination is identified, the financial asset is moved to Stage 2 and the Group records an allowance for LTECL. Refer Note 7.1.12.2 for a description on how the Group determines when a SICR has occurred.
- Stage 3: If a financial asset is credit-impaired, it is moved to Stage 3 and the Group recognises an allowance for LTECL, with probability of default at 100%. Refer Note 7.1.12.3 for a description on how the Group defines default and credit impaired assets.
Purchased or originated credit impaired (POCI) financial assets: Financial assets which are credit impaired on initial recognition are categorised within Stage 3 with a carrying value already reflecting the LTECL. The Group does not have POCI loans as at the reporting date.
The key judgements and assumptions adopted by the Group in addressing the requirements of SLFRS 9 are discussed below:
7.1.12.2 Significant Increase in Credit Risk (SICR)
When determining whether the risk of default on a financial instrument has increased significantly since initial recognition, the Group considers reasonable and supportable information that is relevant and available without undue cost or effort. This includes both quantitative and qualitative information analysis, based on the Group’s historical experience and expert credit assessment and including forward-looking information.
The Group considers an exposure to have significantly increased credit risk when contractual payments of a customer are more than 30 days past due in accordance with the rebuttable presumption in SLFRS 9.
The Group individually reviews at each reporting date, loans and advances above a predefined threshold to identify whether the credit risk has increased significantly since origination, before an exposure is in default. Such indicators include, inter-alia:
- When the risk rating of a customer or an instrument has been downgraded to B+ by an external credit rating agency and/or when there is a two-notch downgrade in the banks internal rating system.
- When reasonable and supportable forecasts of future economic conditions directly affect the performance of a customer/group of customers, portfolios or instruments.
- When there is a significant change in the geographical locations or natural catastrophes that directly impact the performance of a customer/group of customers or an instruments.
- When the value of collateral is significantly reduced and/or realisability of collateral is doubtful.
- When a customer is subject to litigation, that significantly affects the performance of the credit facility.
- Frequent changes in the Senior Management of an institutional customer.
- Delay in the commencement of business operations/projects by more than two years from the originally agreed date.
- When the customer is deceased/insolvent.
- When the Bank is unable to contact or find the customer.
- A fall of 50% or more in the turnover and/or profit before tax of the customer when compared to the previous year for two consecutive years
- Erosion in net-worth by more than 25% when compared to the previous year.
- Number of times credit facilities are re-structured.
- Any other indicator that the Group believes which indicate an SICR as per expert credit judgement.
Credit facilities/exposures which have one or more of the above indicators are treated as facilities with SICR and assessed accordingly in ECL computations. The Group also considers the conditions stipulated in the Directions issued by the CBSL on identifying SICR criteria for assessing credit facilities for ECL computations. The Group regularly monitors the effectiveness of the criteria used to identify SICR to confirm that the criteria is capable of identifying SICR before an exposure is in default.
For debt instruments having an external credit rating, which are measured at amortised cost or at FVOCI, the Group determines SICR based on the generally accepted investment/non-investment grade definitions published by international rating agencies. Debt instruments are moved to Stage 2, if their credit risk increases to the extent that they are no longer considered investment grade.
7.1.12.3 Definition of default and credit impaired assets
The Group considers loans and advances to other customers be defaulted when:
- The borrower is unlikely to pay its obligations to the Group in full, without recourse by the Group to actions such as realising security (if any is held); or
- The borrower becomes 90 days past due on its contractual payments.
In addition, the Group classifies the financial investments under Stage 3 when the external credit rating assigned to the particular investment is “default”.
In assessing whether a borrower is in default, the Group reviews its individually significant loans and advances above a predefined threshold at each reporting date. Further, as per “CBSL Banking Act Direction No. 13 of 2021”, Non-Performing Credit Facilities (NPCF) means all the Credit Facilities where the contractual payments of a customer are past due for more than 90 days or has remained in excess of the sanctioned limit for more than 90 days, and any other credit facilities classified as Stage 3 credit facility under SLFRS 9.
7.1.12.4 Movement between the stages
Financial assets can be transferred between the different categories (other than POCI) depending on their relative change in credit risk since initial recognition. Financial instruments are transferred out of Stage 2 if their credit risk is no longer considered to be significantly increased since initial recognition based on the assessments described in Note 7.1.12.2 and also as per the Policy on Upgrading of Credit Facilities. Financial instruments are transferred out of Stage 3 when they no longer exhibit any evidence of credit impairment as described above as per the Policy on Upgrading of Credit Facilities. The Bank has developed a comprehensive Policy on Upgrading of Credit Facilities in line with the CBSL Banking Act Direction No. 13 of 2021. Accordingly, credit facilities other than restructured and rescheduled facilities are upgraded to a better stage if all due contractual payments associated with such credit facility as at the date of upgrading are fully settled. Restructured and rescheduled facilities are gradually upgraded upon satisfactory repayment for a stipulated period according to the policy while exercising prudence principles.
7.1.12.5 Grouping financial assets measured on collective basis
The Group calculates ECL either on a collective or an individual basis. Asset classes where the Group calculates ECL on individual basis include;
- Credit impaired facilities and facilities identified with SICR which are impaired based on the individual impairment assessment
- The Treasury, trading and interbank relationships (such as due from Banks, money at call and short notice, placements with banks, Government Securities, investments in debentures etc.)
Those financial assets for which, the Group determines that no provision is required under individual impairment are then collectively assessed for ECL. For the purpose of ECL calculation on collective basis, financial assets are grouped on the basis of similar risk characteristics. Loans and advances to other customers are grouped into homogeneous portfolios, based on a combination of product and customer characteristics.
Details of the ECL calculation are given in Note 18.
7.2 Non-current assets held for sale and disposal groups
The Group intends to recover the value of Non-Current Assets and disposal groups classified as held for sale as at the reporting date principally through a sale transaction rather than through continuing use. This condition is regarded as met only when the sale is highly probable, the asset or disposal group is available-for-sale in its present condition, the Management has committed to the sale, and the sale is expected to have been completed within one year from the date of classification.
As per the Sri Lanka Accounting Standard – SLFRS 5 on “Non-current Assets Held for Sale and Discontinued Operations”, (SLFRS 5) these assets are measured at the lower of the carrying amount and fair value, less costs to sell. Thereafter, the Group assesses at each reporting date or more frequently if events or changes in circumstances indicate that the investment or a group of investment is impaired. The Group recognises an impairment loss for any initial or subsequent write down of the assets to fair value less costs to sell and also recognises a gain for any subsequent increase in fair value less costs to sell of an asset, only to the extent of the cumulative impairment losses that have been recognised previously. Impairment loss is first allocated to goodwill, and then to the remaining assets and liabilities on a pro rata basis, except that no loss is allocated to financial assets, deferred tax assets or employee benefit assets which continue to be measured in accordance with the Group’s other accounting policies. As a result, once classified, the Group neither amortises nor depreciates the assets classified as held for sale.
In the Income Statement of the reporting period and of the comparable period of the previous year, income and expenses from discontinued operations are reported separately from income and expenses from continuing operations, down to the level of profit after taxes, even when the Group retains a NCI in a subsidiary after the sale. The resulting profit or loss (after taxes) is reported separately in the Income Statement.
7.3 Property, plant and equipment
Details of “Property, plant and equipment” are given in Note 38.
7.3.1 Depreciation
Details of “Depreciation” are given in Note 20.
7.3.2 Borrowing costs
As per the Sri Lanka Accounting Standard –
LKAS 23 on “Borrowing Costs” (LKAS 23), the Group capitalises borrowing costs that are directly attributable to the acquisition, construction or production of a qualifying asset as part of the cost of the asset. A qualifying asset is an asset which takes a substantial period of time to get ready for its intended use or sale. Other borrowing costs are recognised in the profit or loss in the period in which they occur.
7.4 Investment property
Investment properties are initially measured at cost, including transaction costs. The Group subsequently measures investment properties under fair value model. Any gain or loss arising from a change in fair value and the rental income from the investment property is recognised under net other operating income.
Details of “Investment property” are given in Note 39.
7.5 Intangible assets
Details of “Intangible assets” are given in Note 40.
Amortisation recognised during the year in respect of intangible assets is included under the item of “Amortisation of intangible assets” under “Depreciation and amortisation” in profit or loss.
Refer Note 20.
7.6 Impairment of non-financial assets
At each reporting date, the Group reviews the carrying amounts of its non-financial assets (other than investment properties and deferred tax assets) to determine whether there is any indication of impairment. If any such indication exists, then the asset’s recoverable amount is estimated. Goodwill is tested annually for impairment.
For impairment testing, assets are grouped together into the smallest group of assets that generates cash inflows from continuing use that is largely independent of the cash inflows of other assets or CGUs. Goodwill arising from a business combination is allocated to CGUs or groups of CGUs that are expected to benefit from the synergies of the combination.
The “recoverable amount” of an asset or CGU is the greater of its VIU and its fair value less costs to sell. VIU is based on the estimated future cash flows, discounted to their present value using a pre-tax discount rate that reflects current market assessments of the time value of money and the risks specific to the asset or CGU.
An impairment loss is recognised if the carrying amount of an asset or CGU exceeds its recoverable amount.
The Group’s corporate assets do not generate separate cash inflows and are used by more than one CGU. Corporate assets are allocated to CGUs on a reasonable and consistent basis and tested for impairment as part of the testing of the CGUs to which the corporate assets are allocated.
Impairment losses are recognised in profit or loss. They are allocated first to reduce the carrying amount of any goodwill allocated to the CGU, and then to reduce the carrying amounts of the other assets in the CGU on a pro rata basis.
An impairment loss in respect of goodwill is not reversed. For other assets, an impairment loss is reversed only to the extent that the asset’s carrying amount does not exceed the carrying amount that would have been determined, net of depreciation or amortisation, if no impairment loss had been recognised.
7.7 Dividends payable
Dividends on ordinary shares are recognised as a liability and deducted from equity when they are recommended and declared by the Board of Directors and approved by the shareholders. Interim dividends are deducted from equity when they are declared and no longer at the discretion of the Bank.
Dividends for the year, that are approved after the reporting date and not provided for, are disclosed as an event after the reporting period in accordance with the Sri Lanka Accounting Standard – LKAS 10 on “Events after the reporting period” (LKAS 10) in Note 68.
7.8 Employee benefits
7.8.1 Defined Benefit Plans (DBPs)
A DBP is a post-employment benefit plan other than a Defined Contribution Plan (DCP) as defined in LKAS 19.
7.8.1.1 Defined benefit pension plans
7.8.1.1.1 Description of the plans and employee groups covered
The Bank operates two types of Defined Benefit Pension Plans for its employees as described below:
(a) The Bank has an approved Pension Fund, which was established in 1992. As per the Deed of Trust, only those employees who were less than 45 years of age as at January 01, 1992 were covered by the Pension Fund in order to leave a minimum contribution for a period of 10 years before they are eligible to draw pension from the Pension Fund. Further, only the employees those who joined the Bank before January 01, 2000, became eligible for this pension scheme.
During 2006, the Bank offered a restructured pension scheme to convert the DBP to a DCP for the pensionable employees of the Bank and over 99% of them accepted it. As a result, the above Pension Fund now covers only those employees who did not opt for the restructured pension scheme and those employees who were covered by the Pension Fund which was established in 1992, but retired before the restructured pension scheme came into effect;
(b) Provision for pensions has been made for those employees who retired before January 01, 2000, and on whose behalf the Bank could not make contributions to the Retirement Pension Fund for more than 10 years. This liability although not funded has been provided for in full in the Financial Statements;
The subsidiaries of the Bank do not operate pension funds.
The Bank’s net obligation in respect of Defined Benefit Pension Plans is calculated separately for each plan by estimating the amount of future benefit that employees have earned in the current and prior periods, discounting that amount and deducting the fair value of any plan assets, as per LKAS 19 as detailed in Note 48.
The past service cost is recognised as an expense on a straight-line basis over the period until the benefits become vested. If the benefits are already vested following the introduction of, or changes to, a pension plan, past service cost is recognised immediately.
7.8.1.1.2 Recognition of actuarial gains or losses
Actuarial gains or losses are recognised in the OCI in the period in which they arise.
7.8.1.1.3 Recognition of retirement benefit obligation
The defined benefit asset or liability comprises the present value of the defined benefit obligation, less past service cost not yet recognised and the fair value of the plan assets out of which the obligations are to be settled directly. The value of any asset is restricted to the sum of any past service cost not yet recognised and the present value of any economic benefits available in the form of refunds from the plan or reductions in the future contributions to the plan.
The calculation of defined benefit obligations is performed annually by a qualified actuary using the Projected Unit Credit Method. When the calculation results in a potential asset for the Group, the recognised asset is limited to the present value of economic benefits available in the form of any future refunds from the plan or reductions in future contributions to the plan. To calculate the present value of economic benefits, consideration is given to any applicable minimum funding requirements.
Remeasurement of the net defined benefit liability, which comprises actuarial gains and losses, the return on plan assets (excluding interest) and the effect of the asset ceiling (if any, excluding interest), are recognised immediately in OCI. The Group determines the net interest expense/(income) on the net defined benefit liability/(asset) for the period by applying the discount rate used to measure the defined benefit obligation at the beginning of the annual period to the then net-defined benefit liability/(asset), taking into account any changes in the net-defined benefit liability/(asset) during the period as a result of contributions and benefit payments. Net interest expense and other expenses related to DBPs are recognised in profit or loss.
When the benefits of a plan are changed or when a plan is curtailed, the resulting change in benefit that relates to past service or the gain or loss on curtailment is recognised immediately in profit or loss. The Group recognises gains and losses on the settlement of a DBP when the settlement occurs.
Amounts recognised in profit or loss as expenses on DBPs and provisions made on DBPs together with the details of valuation methods are given in Notes 19 and 48.
7.8.2 Defined Contribution Plans (DCPs)
A DCP is a post-employment plan under which an entity pays fixed contributions into a separate entity and will have no legal or constructive obligations to pay a further amount. Obligations to DCPs are recognised in the profit or loss as the related service is provided. Prepaid contributions are recognised as an asset to the extent that a cash refund or a reduction in future payments is available. The Group has four such plans as explained in Notes 7.8.2.1, 7.8.2.2,7.8.2.3 and 7.8.2.4.
Amounts recognised in profit or loss as expenses on DCPs are given in Note 19.
7.8.2.1 Defined contribution pension plan
As explained in Note 7.8.1.1.1(a), during 2006, the Bank restructured its pension scheme which was a DBP to a DCP. This restructured plan was offered on a voluntary basis to the eligible employees of the Bank. The scheme provides for lump sum payments instead of commuted/monthly pensions to the eligible employees at the point of their separation, in return for surrendering their pension rights. The lump sum offered consisted of a past service package and a future service package. The shortfall on account of the past service package in excess of the funds available in the Pension Fund was borne by the Bank in 2006.
The future service package includes monthly contributions to be made by the Bank for the employees who accepted the offer, to be made during their remaining period of service, at predetermined contribution rates to be applied on their salaries, which are estimated to increase for this purpose at 10% p.a. based on the salary levels that prevailed as at the date of implementation of this scheme. In addition, interest to be earned on the assets of the DCP is also allocated to the employees who opted for the restructured pension scheme.
The assets of this Fund are held separately from those of the Bank and are independently administered by the Trustees as per the provisions of the Trust Deed.
7.8.2.2 Employees’ Provident Fund
The Bank and employees contribute to an approved Private Provident Fund at 12% and 8% respectively, on the salaries of each employee. In addition, the employees may voluntarily contribute an excess amount. Other local entities of the Group and their employees contribute at the same percentages as above to the Employees’ Provident Fund managed by the CBSL.
7.8.2.3 Employees’ Trust Fund
The Bank and other local entities of the Group contribute at the rate of 3% of the salaries of each employee to the Employees’ Trust Fund managed by the CBSL.
7.8.2.4 Defined Contribution Pension Fund (DCPF)
Defined Contribution Pension Fund (DCPF) was established on March 01, 2020, which is managed by a Board of Trustees consisting of representatives of Employee Organisations and the Management.
Employees who joined since the year 2000, and who are not covered under the Restructured Pension Scheme of the Bank and are in the service of the Bank as at March 01, 2020 are eligible for the new DCPF. The initial lump sum, based on Gratuity entitlement as at February 29, 2020, is being transferred to the accounts opened in the names of individual eligible employees.
The Bank contributes monthly, a percentage equivalent of seven decimals five per centum (7.5%) of the monthly salary of each eligible employee starting from March 01, 2020 until cessation of employment to the DCPF.
Employees cannot withdraw money from the DCPF before cessation of employment. In the event of early separation prior to retirement (excluding death), eligible employees are entitled to withdraw the accumulated amounts in their respective DCPF accounts. However, the eligible employees are not entitled to receive any DCPF payment where the completed service is less than five years (similar to the gratuity payments are done in case of a separation as per the Gratuity Act at the point of termination and separation). In the event of death of an employee whilst in service, the accumulated funds in the members account will be released in full to the nominated parties/legal heirs as the case may be, where the completed service is more than 5 years.
7.8.3 Other long-term employee benefits
The Group’s net obligation in respect of long-term employee benefits other than pension plans is the amount of future benefits that employees have earned in return for their service in the current and prior periods. That benefit is discounted to determine its present value, and the fair value of any related assets is deducted. The discount rate used as the yield as at the reporting date is the current market rate that has been extrapolated to reflect long-term rate of discount based on market rates of interest on short-term Corporate/Government Bonds and anticipated long-term rate of inflation. The calculation is performed using the Projected Unit Credit Method. Remeasurements are recognised in profit or loss in the period in which they arise.
The Group does not have any “Other long-term employee benefits plans”.
7.8.4 Terminal benefits
Termination benefits are expensed at the earlier of when the Group can no longer withdraw the offer of those benefits and when the Group recognises costs for a restructuring. If benefits are not expected to be wholly settled within 12 months of the reporting date, then they are discounted.
7.8.5 Short-term employee benefits
Short-term employee benefits are expensed as the related service is provided. A liability is recognised for the amount expected to be paid if the Group has a present legal or constructive obligation to pay this amount as a result of past service provided by the employee and the obligation can be estimated reliably.
7.8.6 Share-based payment arrangements
Share-based payment arrangements in which the Bank receives services as consideration for its own equity instruments are accounted for as equity-settled share-based payment transactions, regardless of how the equity instruments are obtained by the Bank. Executive Employees of the Bank receive remuneration in the form of share-based payment transactions, whereby employees render services as consideration for equity instruments (equity-settled transactions). The Group does not operate any cash-settled share-based payment transactions.
The Group applies the requirements of the Sri Lanka Accounting Standard – SLFRS 2 on “Share-based Payment” (SLFRS 2) in accounting for equity-settled share-based payment transactions, if any, that were granted after January 01, 2012 and had not vested at the same date. As per SLFRS 2, on the grant date, fair value of equity-settled share-based payment awards (i.e., share options) granted to employees is recognised as personnel expense, with a corresponding increase in equity, over the period in which the employees unconditionally become entitled to the awards. The amount recognised as an expense is adjusted to reflect the number of share awards for which the related service and non-market performance vesting conditions are expected to be met, so that the amount ultimately recognised as an expense is based on the number of share awards that do meet the related service and non-market performance conditions at the vesting date. For share-based payment awards with non-vesting conditions, the grant date fair value of the share-based payment is measured to reflect such conditions and there is no true-up for differences between expected and actual outcomes.
The Employee Share Option Plan – 2019, which was granted is subjected to the above accounting treatment.
The details of Employee Share Option Plan is given in Note 52.
The dilutive effect of outstanding options is reflected as additional share dilution in the computation of diluted earnings per share as disclosed in Note 24.1 and Note 24.2.
7.9 Other liabilities
Details of “Other liabilities” are given in Note 48.
7.10 Restructuring
Provision for restructuring is recognised when the Group has approved a detailed and formal restructuring plan, and the restructuring either has commenced or has been announced publicly. Future operating losses arising on such restructuring are not provided for.
The Group does not have any provision for restructuring as at the reporting date.
7.11 Onerous contracts
A provision for onerous contracts is recognised when the expected benefits to be derived by the Group from a contract are lower than the unavoidable cost of meeting its obligations under the contract. The provision is measured at the present value of the lower of the expected cost of terminating the contract and the expected net cost of continuing with the contract. Before a provision is established, the Group recognises any impairment loss on the assets associated with that contract.
The Group does not have any onerous contracts as at the reporting date.
7.12 Bank levies
A provision for bank levies is recognised when the condition that triggers the payment of the levy is met. If a levy obligation is subject to a minimum activity threshold so that the obligating event is reaching a minimum activity, then a provision is recognised when that minimum activity threshold is reached.
7.13 Financial guarantees, letters of credit and undrawn loan commitments
“Financial guarantees” are contracts that require the Group to make specified payments to reimburse the holder for a loss that it incurs because a specified debtor fails to make payment when it is due in accordance with the terms of a debt instrument. Undrawn loan commitments and letters of credits are commitments under which, over the duration of the commitment, the Bank is required to provide a loan with pre-specified terms to the customer.
Financial guarantees are initially recognised in the Financial Statements (within other liabilities) at fair value, being the premium received. Subsequent to initial recognition, the Group’s liability under each guarantee is measured at the higher of the amount initially recognised less cumulative amortisation recognised in the income statement and ECL provision, if appropriate.
The premium received is recognised in profit or loss in Note 14.1 on “Fee and commission income” on a straight line basis over the life of the guarantee.
The nominal contractual value of financial guarantees, letters of credit and undrawn loan commitments, where the loan agreed to be provided is on market terms, are not recorded on in the SOFP, but included as part of contingent liabilities and commitments. The nominal values of these instruments together with the corresponding ECLs are disclosed in Note 57.
Loan commitments at below market interest rates are initially measured at fair value and subsequently measured at the higher of the amount of the ECL allowance and the amount initially recognised less the cumulative amount of income recognised, when appropriate.
7.14 Commitments
All discernible risks are accounted for in determining the amount of known liabilities as explained in Note 7.9 above.
Details of the commitments are given in Note 57.
7.15 Contingent liabilities and commitments
A detailed list of “Contingent liabilities and commitments” and “Litigation against the Bank” are given in Notes 57 and 59.
7.16 Stated capital and reserves
Details of the “Stated capital and reserves” are given in Notes 51, 53, 54 and 55 to the Financial Statements.
7.17 Earnings per Share (EPS)
Details of “Basic and Diluted EPS” are given in Note 24.
7.18 Operating segments
Details of “Operating segments” are given in Note 61.
7.19 Fiduciary assets
The Bank provides trust and other fiduciary services that result in the holding or investing of assets on behalf of its clients. Assets held in a fiduciary capacity are not reported in these Financial Statements as they do not belong to the Bank.
18. Impairment charges and other losses
Accounting policy
Impairment charges as per SLFRS 9
The Group recognises loss allowances for expected credit loss (ECL) on the following financial instruments that are not measured at FVTPL:
- Cash and cash equivalents;
- Placements with banks;
- Loans and advances to other customers;
- Financial assets at amortised cost-debt and other financial instruments;
- Debt instruments at fair value through other comprehensive income;
- Loan commitments and financial guarantee contracts.
No impairment loss is recognised on equity investments.
The Group assesses the credit risk and the estimates unbiased and probability-weighted ECL, and incorporates all available information relevant to the assessment, including information about past events, current conditions and reasonable and supportable forecasts of economic conditions at the reporting date. In addition, the estimation of ECL takes into account the time value of money.
For loans and advances above a predefined threshold, the Group individually assesses for significant increase in credit risk (SICR). If a particular loan is individually impaired, the amount of the loss is measured as the difference between the asset’s carrying amount and the present value of estimated future cash flows. If the Group determines that no provision is required under individual impairment, such financial assets are then collectively assessed for any impairments along with the remaining portfolio.
The Group computes ECL using three main components; a probability of default (PD), a loss given default (LGD) and the exposure at default (EAD) under the collective assessment. These parameters are generally derived from internally developed statistical models and historical data and then adjusted to reflect forward-looking information.
- PD – The probability of default represents the likelihood of a borrower defaulting on its financial obligations (as per Note 7.1.12.3) either over the next 12-months (12m PD) or over the remaining lifetime (Lifetime PD) of the obligation. PD estimates are estimates at a certain date and days past due (DPD) is the primary input into the determination of the term structure of PD for exposures. DPD are determined by counting the number of days since the due date. The Group employs statistical models to analyse the data collected and generates estimates of the remaining lifetime PD of exposures and how these are expected to change as a result of the passage of time.
- LGD – The loss given default is an estimate of the loss arising in the case where a default occurs at a given time. It is based on the difference between the contractual cash flows due and those that the lender would expect to receive, including from the realisation of any collateral. The Group estimates LGD parameters based on historical recovery rates of claims against defaulted counterparties. They are calculated on a discounted cash flow basis using EIR as the discounting factor. LGD is usually expressed as a percentage of the EAD.
- EAD – The exposure at default represents the expected exposure in the event of a default. The Group estimates EAD, taking into account the repayment of principal and interest from the reporting date to the default event together with any expected drawdowns of committed facilities. To calculate EAD for a Stage 1 loan, the Group assesses the possible default events within 12 months. To calculate EAD of all other loans, default events over the lifetime of the financial instruments are considered.
Impairment charges on financial investments include ECL on debt instruments at FVOCI and financial assets at amortised cost.
The Group does not have historical loss experience on debt instruments at amortised cost and debt instruments at FVOCI. Thus the Group considers PDs published by the external sources (i.e. Bloomberg)
LGD for debt securities issued by the government of Sri Lanka in rupees is considered as 0%, LGDs for foreign currency denominated securities issued by the government are considered at a minimum of 20%. For all other instruments LGD is considered as 45% in accordance with the guideline issued by the Central Bank of Sri Lanka. However, the Group recognises a higher loss rates o/a SLSBs during the year, following the downgrade of the country’s sovereign rating and the announcement made by the Government in April 2022 stating the Government’s intention to restructure its external public debt. The Group was able to significantly reduce the investments made in SLDB portfolio by exercising the option to convert maturing SLDBs in to LKR denominated government securities.
EAD of a debt instrument is its gross carrying amount.
The Group’s product offering includes a variety of corporate and retail overdraft and credit cards facilities. The Group reviews the sanction limits at least annually and therefore has the right to cancel and/or reduce the limits. Therefore, the Group calculates only the 12-month ECL (12m ECL) allowance on these facilities. The EAD is arrived by taking the maximum of either sanction limit adjusted for Credit Conversion Factor (CCF) and the gross carrying amount of the loan (utilised amount). EAD of Stage 3 contracts are limited to the gross carrying amount which is the utilised amount since it is assumed that the Group freeze the limits of those contracts up to the utilised amount. The expected 12-month default probabilities are applied to EAD and multiplied by the expected LGD and discounted by an approximation to the original EIR.
When estimating Life Time ECL (LTECL) for undrawn loan commitments, the Group estimates the expected portion of the loan commitment that will be drawn down over its expected life. The ECL is then based on the present value of the expected shortfalls in cash flows if the loan is drawn down. The expected cash shortfalls are discounted at an approximation to the expected EIR on the loan. For loan commitments and letters of credit, the allowances for ECLs are recognised within “other liabilities”.
The Bank’s liability under each guarantee is measured at the higher of the amount initially recognised less cumulative amortisation recognised in the Income Statement, and the ECL provision. For this purpose, the Bank estimates ECLs based on the present value of the expected payments to reimburse the holder for a credit loss that it incurs. The shortfalls are discounted by the risk-adjusted interest rate relevant to the exposure. The allowances for ECLs related to financial guarantee contracts are recognised within “other liabilities”.
The Group incorporates forward-looking information into both its assessment as to whether the credit risk of an instrument has increased significantly since its initial recognition and its measurement of ECL. The Group also obtained experienced credit judgement from economic experts and Credit and Risk Management Departments to formulate a base case, a best case and a worst case scenario. The base case represents a most-likely outcome and is aligned with information used by the Group for strategic planning and budgeting. The Group has identified and documented key drivers of credit risk both quantitative and qualitative for various portfolio segments. Quantitative economic factors are based on economic data and forecasts published by the CBSL and other reliable sources.
| Quantitative drivers of credit risk | Qualitative drivers of credit risk |
| GDP growth rate | Status of industry business |
| Unemployment rate | Regulatory impact |
| Interest rate (AWPLR) | Government policies |
| Rate of inflation | Average loan to value ratio |
| Exchange rate |
The Group measures loss allowance at an amount equal to LTECL, except for following, which are measured as 12m ECL.
- Loans and advances on which credit risk has not increased significantly since the initial recognition.
- Debt instruments that are determined to have low credit risk at the reporting date.
The Group considers a debt instrument to have a low credit risk when they have an “investment grade” credit risk rating.
ECLs are measured as follows:
- Financial assets that are not credit-impaired at the reporting date: as the present value of all cash shortfalls
(i.e. the difference between the cash flows due to the entity in accordance with the contract and the cash flows that the Group expects to receive); - Financial assets that are credit-impaired at the reporting date: as the difference between the gross carrying amount and the present value of expected cash flows;
- Undrawn loan commitments: as the present value of the difference between the contractual cash flows that are due to the Group if the commitment is drawn down and the cash flows that the Group expects to receive;
- Financial guarantee contracts: the expected payments to reimburse the holder less any amounts that the Group expects to recover.
As described above, the Group calculates 12m ECL allowance based on the expectation of a default occurring in the 12 months following the reporting date. These expected 12-month default probabilities are applied to EAD and multiplied by the economic factor adjustment, expected LGD and discounted by an approximation to the original EIR. When the financial asset has shown a SICR since origination, the Group records an allowance for LTECLs based on PDs estimated over the lifetime of the instrument.
Impairment allowance on credit-impaired financial assets assessed on individual basis is computed as the difference between the asset’s gross carrying amount and the present value of estimated future cash flows. The expected future cash flows are based on the estimates made by credit risk officers‘ as at the reporting date, reflecting reasonable and supportable assumptions and projections of future recoveries and expected future receipts of interest. The Group regularly reviews the assumptions for projecting future cash flows.
Further, the loans and advances identified as credit impaired in Note 7.1.12.3 will be assessed for impairment with 100% PD.
The Bank seeks to use collateral, where possible, to mitigate its risks on financial assets. The collateral comes in various forms such as cash, gold, Government Securities, Letters of Credit/Guarantees, real estate, receivables, inventories, other non-financial assets and credit enhancements such as netting agreements, etc.
Loans and debt securities are written off (either partially or in full) when there is no realistic prospect of recovery. This is generally the case when the Group determines that the borrower does not have assets or sources of income that could generate sufficient cash flows to repay the amounts subject to the write-off. However, financial assets that are written off could still be subject to enforcement activities in order to comply with the Group’s procedures for recovery of amounts due.
Due to the high level of economic uncertainty that prevailed throughout the year, the Bank used management overlays, such as additional provisions on loans in risk elevated industries and loans subject to moratoriums, and additional provisions by stressing PDs and LGDs, to capture unforeseeable events that cannot be assessed using modelled outcomes. As a result, the cumulative impairment provision under management overlays as of December 31, 2022 is Rs. 10.386 Bn. (Rs. 13.260 Bn. as at December 31, 2021).
| As at December 31, | 2022 % | 2021 % |
| Best case | 5.00 | 15.00 |
| Base case | 15.00 | 40.00 |
| Worst case | 80.00 | 45.00 |
Further, the Group is of the view that there was no significant impact of COVID-19 on the value of assets pledged as collateral and therefore no additional adjustment made to ECL in this regard.
 Refer Note 2.12.5 for detailed explanation on significant assumptions and estimates used with the objective of capturing the impact of economic uncertainties to ECL provisions .
| GROUP | BANK | ||||
| For the year ended December 31, | 2022 | 2021 | 2022 | 2021 | |
| Note | Rs. ’000 | Rs. ’000 | Rs. ’000 | Rs. ’000 | |
| Loans and advances to other customers | 33.2 (a) & 33.2 (b) | 22,296,719 | 14,947,268 | 21,961,786 | 14,553,362 |
| Other financial assets | 47,281,554 | 6,948,387 | 47,161,839 | 6,899,745 | |
| Off-balance sheet credit exposures | 2,196,056 | 3,242,610 | 2,188,066 | 3,237,575 | |
| Total impairment charges | 18.1 & 18.2 | 71,774,329 | 25,138,265 | 71,311,691 | 24,690,682 |
| Investments in subsidiaries | 36.1 | – | – | – | – |
| Direct write-offs | 149,931 | 1,661 | 149,931 | 1,661 | |
| Total | 71,924,260 | 25,139,926 | 71,461,622 | 24,692,343 | |
18.1 Impairment charge to the Income Statement – Group
| For the year ended December 31, | Note | 2022 | 2021 | ||||||
| Stage 1 Rs. ’000 |
Stage 2 Rs. ’000 |
Stage 3 Rs. ’000 |
Total Rs. ’000 |
Stage 1 Rs. ’000 |
Stage 2 Rs. ’000 |
Stage 3 Rs. ’000 |
Total Rs. ’000 |
||
| Cash and cash equivalents | 28.1 | 3,131 | – | – | 3,131 | 4,371 | – | – | 4,371 |
| Placements with banks | 30.1 | (26,571) | – | – | (26,571) | 34,148 | – | – | 34,148 |
| Financial assets at amortised cost – loans and advances to banks | – | – | – | – | (85) | – | – | (85) | |
| Financial assets at amortised cost – loans and advances to other customers | 33.2 (a) | 2,380,186 | 8,141,759 | 11,774,774 | 22,296,719 | 3,607,700 | 6,767,014 | 4,572,554 | 14,947,268 |
| Financial assets at amortised cost – debt and other financial instruments | 34.1 (a) | (5,342,455) | 59,997,100 | – | 54,654,645 | 3,576,138 | – | – | 3,576,138 |
| Financial assets measured at fair value through other comprehensive income | 35.2 | (7,349,651) | – | – | (7,349,651) | 3,333,815 | – | – | 3,333,815 |
| Contingent liabilities and commitments | 57.3 (a) | 1,564,590 | 687,280 | (55,814) | 2,196,056 | 551,897 | 570,466 | 2,120,247 | 3,242,610 |
| Total | /> | (8,770,770) | 68,826,139 | 11,718,960 | 71,774,329 | 11,107,984 | 7,337,480 | 6,692,801 | 25,138,265 |
18.2 Impairment charge to the Income Statement – Bank
| For the year ended December 31, | Note | 2022 | 2021 | ||||||
| Stage 1 Rs. ’000 |
Stage 2 Rs. ’000 |
Stage 3 Rs. ’000 |
Total Rs. ’000 |
Stage 1 Rs. ’000 |
Stage 2 Rs. ’000 |
Stage 3 Rs. ’000 |
Total Rs. ’000 |
||
| Cash and cash equivalents | 28.1 | 2,921 | – | – | 2,921 | 4,313 | – | – | 4,313 |
| Placements with banks | 30.1 | 24,962 | – | – | 24,962 | 2,823 | – | – | 2,823 |
| Financial assets at amortised
cost – loans and advances to banks |
– | – | – | – | (85) | – | – | (85) | |
| Financial assets at amortised
cost – loans and advances to other customers |
33.2 (b) | 2,389,315 | 8,028,839 | 11,543,632 | 21,961,786 | 3,552,303 | 6,729,149 | 4,271,910 | 14,553,362 |
| Financial assets at amortised cost – debt and other financial instruments |
34.1 (b) | (5,513,493) | 59,997,100 | – | 54,483,607 | 3,558,879 | – | – | 3,558,879 |
| Financial assets measured at fair value through other comprehensive income |
35.2 | (7,349,651) | – | – | (7,349,651) | 3,333,815 | – | – | 3,333,815 |
| Contingent liabilities and commitments | 57.3 (b) | 1,556,600 | 687,280 | (55,814) | 2,188,066 | 546,862 | 570,466 | 2,120,247 | 3,237,575 |
| Total | (8,889,346) | 68,713,219 | 11,487,818 | 71,311,691 | 10,998,910 | 7,299,615 | 6,392,157 | 24,690,682 | |
22. Taxes on financial services
Accounting policy
Refer Notes 9.4 and 9.5.
| GROUP | BANK | ||||
| For the year ended December 31, | Note | 2022 | 2021 | 2022 | 2021 |
| Rs. ’000 | Rs. ’000 | Rs. ’000 | Rs. ’000 | ||
| Value Added Tax | 9.4 | 3,914,152 | 5,845,230 | 3,885,951 | 5,809,224 |
| Social Security Contribution Levy | 9.5 | 7,229 | – | 6,265 | – |
| Total | 3,921,381 | 5,845,230 | 3,892,216 | 5,809,224 | |
25. Dividends on ordinary shares
Accounting policy
Refer Note 7.7.
| GROUP and Bank | |||||||
| Cash dividend | Scrip dividend | Total | |||||
| Note | 2022 Rs. ’000 |
2021 Rs. ’000 |
2022 Rs. ’000 |
2021 Rs. ’000 |
2022 Rs. ’000 |
2021 Rs. ’000 |
|
| Dividends for 2020 | – | – | – | ||||
| First and final dividend | 25.1 | – | 5,253,070 | – | 2,334,698 | – | 7,587,768 |
| Dividends for 2021 | |||||||
| First and final dividend | 25.2 | 5,373,996 | – | 3,582,664 | – | 8,956,660 | – |
| Total amount paid during the year | 8,956,660 | 7,587,768 | |||||
25.1 Dividends for 2020
The Bank did not declare cash dividends during the year 2020 (for the year ended December 31, 2020), in conformity with the restrictions imposed by the Central Bank of Sri Lanka on payment of interim cash dividends for the financial year 2020, as per instructions issued via the Banking Act Direction No. 03 of 2020, dated May 13, 2020, on “Restrictions on Discretionary Payments of Licensed Banks”.
The Board of Directors of the Bank recommended and paid a first and final dividend of Rs. 6.50 per share which was satisfied in the form of Rs. 4.50 per share in cash (paid on April 05, 2021 and April 09, 2021) and Rs. 2.00 per share in the form of issue and allotment of new shares for both voting and non-voting ordinary shares of the Bank for the year ended December 31, 2020, and these new shares were listed on April 09, 2021.
This dividend was recommended and paid after the Financial Statements for the year 2020 were finalised and audited by the Bank’s external auditors and in compliance with the instructions given in the Banking Act Direction No. 01 of 2021, dated January 19, 2021, on “Restrictions on Discretionary Payments of Licensed Banks”.
25.2 Dividends for 2021
The Bank did not declare cash dividends during the year 2021 (for the year ended December 31, 2021), in conformity with the restrictions imposed by the Central Bank of Sri Lanka on payment of interim cash dividends for the financial year 2021, as per instructions issued via the Banking Act Direction No 11 of 2021, dated July 13, 2021, on “Restrictions on Discretionary Payments of Licensed Banks”.
The Board of Directors of the Bank recommended and paid a first and final dividend of Rs. 7.50 per share which was satisfied in the form of Rs. 4.50 per share in cash (paid on April 07, 2022 and April 11, 2022) and Rs. 3.00 per share in the form of issue and allotment of new shares for both voting and non-voting ordinary shares of the Bank for the year ended December 31, 2021, and these new shares were listed on April 26, 2022.
This dividend was recommended and paid after the Financial Statements for the year 2021 were finalised and audited by the Bank’s external auditors and in compliance with the instructions given in the Banking Act Direction No 11 of 2021, dated July 13, 2021, on “Restrictions on Discretionary Payments of Licensed Banks”.
25.3 Dividends for 2022
The Bank did not declare cash dividends during the year 2022 (for the year ended December 31, 2022), in conformity with the restrictions imposed by the Central Bank of Sri Lanka on payment of cash dividends for the financial year 2022, as per the instructions given in the Banking Act Direction No 2 of 2022, dated May 06, 2022, on “Restrictions on Discretionary Payments of Licensed Banks”.
Since the Financial Statements for the year 2022 are finalised and audited by the Bank's external auditors, the Board of Directors of the Bank has now recommended the payment of a first and final dividend of Rs. 4.50 per share to be satisfied in the form of issue and allotment of new shares for both voting and non-voting ordinary shareholders' of the Bank for the year ended
December 31, 2022.
The above first and final dividend recommended by the Board of Directors is to be approved at the forthcoming Annual General Meeting to be held on March 30, 2023.
51. Stated capital
Accounting policy
Ordinary shares in the Bank are recognised at the amount paid per ordinary share net of directly attributable issue cost.
| GROUP | BANK | ||||
| 2022 | 2021 | 2022 | 2021 | ||
| Note | Rs. ’000 | Rs. ’000 | Rs. ’000 | Rs. ’000 | |
| Balance as at January 01, | 54,566,957 | 52,187,747 | 54,566,957 | 52,187,747 | |
| Issue of ordinary voting shares under the employee share option plans | – | 40,866 | – | 40,866 | |
| Transfer from employee share option reserve | 55.5 | – | 3,646 | – | 3,646 |
| Issue of ordinary shares as part of the final dividend satisfied in the form of issue and allotment of new shares |
3,582,664 | 2,334,698 | 3,582,664 | 2,334,698 | |
| Ordinary voting shares | 3,373,442 | 2,198,757 | 3,373,442 | 2,198,757 | |
| Ordinary non-voting shares | 209,222 | 135,941 | 209,222 | 135,941 | |
| Balance as at December 31, | 58,149,621 | 54,566,957 | 58,149,621 | 54,566,957 | |
51.1 Movement in number of shares
| Number of ordinary voting shares | Number of ordinary non-voting shares | |||
| 2022 | 2021 | 2022 | 2021 | |
| Balance as at January 01, | 1,124,480,528 | 1,098,934,937 | 69,740,771 | 67,970,701 |
| Issue of ordinary voting shares under the employee share option plan | – | 474,254 | – | – |
| Issue of ordinary shares as part of the final dividend satisfied in the form of issue and allotment of new shares |
42,755,914 | 25,071,337 | 2,800,834 | 1,770,070 |
| Balance as at December 31, | 1,167,236,442 | 1,124,480,528 | 72,541,605 | 69,740,771 |
The shares of Commercial Bank of Ceylon PLC are quoted on the Colombo Stock Exchange. The non-voting ordinary shares of the Bank, rank pari passu in respect of all rights with the ordinary voting shares of the Bank except voting rights on Resolutions passed at General Meetings.
The holders of ordinary shares are entitled to receive dividends declared from time to time and are entitled to one vote per share at General Meetings of the Bank.
The Bank has offered employee share option plans.  Refer Note 52.
52. Share-based payment
52.1 Description of the Share-based Payment Arrangement
As at the reporting date, the Group had the following equity settled Share-based Payment Arrangement which was granted after January 01, 2012, the effective date of the Accounting Standard SLFRS 2 on “Share-based Payment”.
Employee Share Option Plan – 2015
The Bank obtained the approval of the shareholders at an Extraordinary General Meeting held on March 31, 2015, to introduce an Employee Share Option Plan for the benefit of all Executive Officers in Grade 1A and above by creating up to 2% of the ordinary voting shares at the rate of 0.5% shares in the first two years and 1% share in the last year over a period of three to five years, upon the Bank achieving specified performance targets. The performance conditions include minimum performance targets over the budget and over the industry peers and the service conditions include the fulfilment of the minimum service period at vesting dates of each tranche. The Employee share option plan – 2015 mentioned above was expired in 2021.
Employee Share Option Plan – 2019
The Bank obtained the approval of the shareholders at an Extraordinary General Meeting held on January 30, 2020, to introduce an Employee Share Option Plan for the benefit of all Executive Officers in Grade 1A and above by creating up to 2% of the ordinary voting shares at the rate of 0.5% shares in the first two years and 1% share in the last year over a period of three to five years, upon the Bank achieving specified performance targets. The performance conditions include minimum performance targets over the budget and over the industry peers and the service conditions include the fulfilment of the minimum service period at vesting dates of each tranche.
Key terms and conditions related to the offer are detailed below:
| Tranches | |||
| Tranche I | Tranche II | Tranche III | |
| Percentage of issue of new voting shares (Maximum) | 0.50% | 0.50% | 1.00% |
| Date granted | January 30, 2020 | January 30, 2020 | January 30, 2020 |
| Exercise price (Rs.) | 91.65 | 85.13 | 87.39 |
| Exercisable between | July 01, 2020 to June 30, 2023 | October 01, 2020 to September 30, 2023 | October 01, 2021 to September 30, 2024 |
| Date of vesting | June 30, 2020 | September 30, 2020 | September 30, 2021 |
| Vesting conditions | 6 Months of service from the grant date and the fulfilment of performance conditions stated above for the Financial Year 2018 | 6 Months of service from the grant date and the fulfilment of performance conditions stated above for the Financial Year 2019 | 6 Months of service from the grant date and the fulfilment of performance conditions stated above for the Financial Year 2020 |
| Number of options vested on the date of vesting | |||
| Options granted to key management personnel | 56,588 | 62,821 | 131,255 |
| Option granted to other executive officers | 4,749,197 | 4,743,061 | 11,071,741 |
| Total options vested on the date of vesting | 4,805,785 | 4,805,882 | 11,202,996 |
| Options cancelled due to non-acceptance | – | – | – |
| Number of options exercised up to December 31, 2022 | (73,510) | (394,997) | (5,747) |
| Number of options to be exercised as at December 31, 2022 |
4,732,275 | 4,410,885 | 11,197,249 |
All options are to be settled by physical delivery of ordinary voting shares of the Bank. There are neither cash settlement alternatives nor the Bank has a past practise of cash settlement for these types of options.
The exercise price of each tranche is computed based on a volume-weighted average market price of the Bank’s ordinary (voting) shares, during the period of thirty (30) market days, six months prior to the date of vesting.
52.2 Measurement of fair value
As required by SLFRS 2 on “Share-based Payment”, the fair value of the ESOP 2019 was estimated at the grant date using the Binomial Valuation Model taking into consideration various terms and conditions upon which the share options are granted.
The inputs used in measurement of fair value at the grant date of ESOP 2019 were as follows:
| Tranches | |||
| Description of the valuation input | Tranche I | Tranche II | Tranche III |
| Expected dividend rate (%) | 4.31 | 4.31 | 4.31 |
| Risk free rate (%) | 8.22 | 8.22 | 8.22 |
| Probability of share price increase (%) | 55.00 | 55.00 | 55.00 |
| Probability of share price decrease (%) | 45.00 | 45.00 | 45.00 |
| Size of annual increase of share price (%) | 19.00 | 19.00 | 19.00 |
| Size of annual reduction in share price (%) | (12.00) | (12.00) | (12.00) |
| Original expected exercise price (Rs.) | 100.22 | 100.74 | 101.45 |
Growths in share prices stated above have been based on evaluation of the historical volatility of the Bank’s share price over past 10 years, adjusted for post-war growth in All Share Price Index (ASPI) published by the Colombo Stock Exchange.
52.3 Reconciliation of outstanding share options
The number and weighted-average exercise prices of share options are as follows:
| Tranche | Tranche I | Tranche II | Tranche III | |||
| Exercise price | 91.65 | 85.13 | 87.39 | |||
| Year | 2022 | 2021 | 2022 | 2021 | 2022 | 2021 |
| No. of voting shares vested and to be vested as at January 01, | 4,732,275 | 4,805,785 | 4,410,885 | 4,805,882 | 11,197,249 | – |
| Granted during the year | – | – | – | – | – | 11,202,996 |
| Exercised during the year | – | (73,510) | – | (394,997) | – | (5,747) |
| Number of options expired | – | – | – | – | – | – |
| No. of voting shares vested and to be vested as at December 31, | 4,732,275 | 4,732,275 | 4,410,885 | 4,410,885 | 11,197,249 | 11,197,249 |
52.4 Expense recognised in Income Statement
The cumulative expense recognised for equity-settled transactions at each reporting date until the vesting date, reflects the extent to which the vesting period has expired and the Group’s best estimate of the number of equity instruments that will ultimately vest. Accordingly, the expense in the Income Statement represents the movement in cumulative expense recognised as at the beginning and end of that period and is recognised in employee benefits expense Refer Note 19.
52.5 Certificate from Auditors on ESOP schemes
The Bank has obtained a certification from the external auditors that the above ESOP schemes have been implemented in accordance with the requirements of the Section 5.6 of the Listing Rules of the CSE and the Special Resolutions passed at the General Meetings at which the schemes were approved by the shareholders.
66. Financial risk review
This note presents information about the Bank’s exposure to financial risks and the Bank’s management of capital.
| For information on the Bank’s financial risk management framework | |
Introduction |
|
66.1 |
Credit risk |
| 66.1.1 | Credit quality analysis |
| 66.1.2 | Credit-impaired financial assets |
| 66.1.3 | Sensitivity analysis of impairment provision on loans and advances to other customers and FCY denominated Government securities |
| 66.1.4 | Collaterals held |
| 66.1.5 | Concentration of credit risk |
66.2 |
Liquidity risk |
| 66.2.1 | Exposure to liquidity risk |
| 66.2.2 | Maturity analysis of financial assets and financial liabilities |
| 66.2.3 | Liquidity reserves |
| 66.2.4 | Financial assets available to support future funding |
66.3 |
Market risk |
| 66.3.1 | Exposure to market risk – Trading and non-trading portfolio |
| 66.3.2 | Exposure to interest rate risk – Sensitivity analysis |
| 66.3.3 | Exposure to currency risk – Non-trading portfolio |
| 66.3.4 | Exposure to equity price risk |
66.4 |
Operational risk |
66.5 |
Capital management and pillar III disclosures as per Basel III |
| 66.5.1 | Regulatory capital |
| 66.5.2 | Capital allocation |
| 66.5.3 | Pillar III disclosures as per Basel III |
Introduction
As a financial intermediary, the Bank is exposed to various types of risks including credit, market, liquidity and operational risks which are inherent in the Bank’s activities. Managing these risks is critical for the sustainability of the Bank which plays a pivotal role in all activities of the Bank. Risk management function strives to identify potential risks in advance, analyse them and take precautionary steps to mitigate the impact of risk whilst optimising through risk adjusted returns within the risk appetite of the Bank.
Risk management framework
The overall responsibility and oversight of the risk management framework of the Bank is vested with the Board of Directors (BOD). The Board Integrated Risk Management Committee (BIRMC), a mandatory subcommittee set up by the Board, in turn is entrusted with the development of the Bank’s Risk Management Policies and monitoring of due compliance of same through the Executive Integrated Risk Management Committee (EIRMC).
The Risk Management Policies spell out the risk appetite of the Bank and has incorporated risk exposure limits and controls to monitor and adherence to the limits in force. These Policies and Systems are reviewed regularly to reflect the changing market dynamics in light of the products and services offered.
The Bank strives to inculcate a risk management culture through continuous training, work ethics and standards.
Refer Note 3.2 for more information on the risk management framework of the Bank.
Integrated Risk Management Department (IRMD)
Business Units are the risk owners and have the primary responsibility for managing risk stemming from these activities. The IRMD acts as the second line of defence in managing the risk. The IRMD through Chief Risk Officer reports to the BIRMC thus ensuring its independence.
Risk measurement and reporting
The Bank uses robust risk measurement techniques in line with industry best practices. The Bank also carries out stress testing on regular basis which is a key aspect of the Internal Capital Adequacy Assessment Process (ICAAP). The risk management framework of the Bank provides an insight on the impact of extreme, but plausible scenarios on the Bank’s risk profile. The results of the stress testing are reported to the EIRMC and then to the BIRMC on a periodic basis.
The Bank establishes policies, and sets limits and thresholds within the risk appetite of the Bank. These limits reflect the business strategy and market environment which the bank operates as well as the level of risk that the Bank is willing to accept (risk appetite). The monitoring and control mechanism therefore, is based on risk appetite of the Bank.
66.1 Credit risk
The financial loss resulting from a borrower or counterparty to a financial instrument failing or delaying to meet its contractual obligations is referred to as credit risk. It arises principally from the loans and advances to banks and other customers, investments in debt securities and other financial instruments. In addition to the credit risk from direct funding exposure (i.e. on balance sheet exposure), indirect liabilities such as Letters of Credit, Guarantees etc. also would expose the Bank to credit risk.
The Bank ensures stringent credit risk management practices to manage overall elements of credit risk exposures (such as individual obligor default risk, country and sector concentration risks etc.).
66.1.1 Credit quality analysis
66.1.1 (a) Maximum exposure to credit risk by risk rating
The following tables set out information about the credit quality of financial assets measured at amortised cost, debt instruments measured at FVOCI and contingent liabilities and commitments.
| Carrying amount | Not subject to ECL | Subject to | ||||||
| As at December 31, 2022 | 12-month ECL (Stage 1) |
Lifetime ECL – not credit impaired (Stage 2) |
Lifetime ECL – credit impaired (Stage 3) |
|||||
| Note | Rs. ’000 | Rs. ’000 | Rs. ’000 | Rs. ’000 | Rs. ’000 | |||
| Cash and cash equivalents | ||||||||
| Risk free Investments | 47,104,381 | 47,104,381 | – | – | – | |||
| Rating 0-4: Investment grade | 102,265,027 | – | 102,265,027 | – | – | |||
| Rating 5-6: Moderate risk | 37,893 | – | 37,893 | – | – | |||
| Rating 7-8: High risk | – | – | – | – | – | |||
| Rating 9: Extreme risk | – | – | – | – | – | |||
| Gross carrying amount | 149,407,301 | 47,104,381 | 102,302,920 | – | – | |||
| Less: Provision for impairment | 13,690 | – | 13,690 | – | – | |||
| Net carrying amount | 28 | 149,393,611 | 47,104,381 | 102,289,230 | – | – | ||
| Placements with Central Bank and other Banks | ||||||||
| Risk free investments (Excluding Statutory Reserve) | – | – | – | – | – | |||
| Rating 0-4: Investment grade | 95,933,756 | – | 95,933,756 | – | – | |||
| Rating 5-6: Moderate risk | – | – | – | – | – | |||
| Rating 7-8: High risk | – | – | – | – | – | |||
| Rating 9: Extreme risk | – | – | – | – | – | |||
| Gross carrying amount | 95,933,756 | – | 95,933,756 | – | – | |||
| Less: Provision for impairment | 34,111 | – | 34,111 | – | – | |||
| Net carrying amount | 30 | 95,899,645 | – | 95,899,645 | – | – | ||
| Financial assets at amortised cost – Loans and advances to other customers | ||||||||
| Government Securities (Risk free investments) | – | – | – | – | – | |||
| Rating 0-4: Investment grade (*) | 841,623,725 | – | 736,637,671 | 92,289,248 | 12,696,806 | |||
| Rating 5-6: Moderate risk | 281,028,100 | – | 190,778,400 | 66,742,012 | 23,507,688 | |||
| Rating 7-8: High risk | 43,026,390 | – | 4,057,941 | 14,346,136 | 24,622,313 | |||
| Rating 9: Extreme risk | 53,989,028 | – | 35,675 | 41,305 | 53,912,048 | |||
| Gross carrying amount | 1,219,667,243 | – | 931,509,687 | 173,418,701 | 114,738,855 | |||
| Less: Provision for impairment | 89,224,664 | – | 14,598,587 | 28,248,676 | 46,377,401 | |||
| Net carrying amount | 33 | 1,130,442,579 | – | 916,911,100 | 145,170,025 | 68,361,454 | ||
| Financial assets at amortised cost – Debt and other financial instruments | ||||||||
| Government Securities (Risk free investments) | 564,355,883 | 564,355,883 | – | – | – | |||
| Rating 0-4: Investment grade | 7,642,694 | – | 7,642,694 | – | – | |||
| Rating 5-6: Moderate risk | 224,468,893 | – | – | 224,468,893 | – | |||
| Rating 7-8: High risk | – | – | – | – | – | |||
| Rating 9: Extreme risk | 152,870 | – | – | – | 152,870 | |||
| Gross carrying amount | 796,620,340 | 564,355,883 | 7,642,694 | 224,468,893 | 152,870 | |||
| Less: Provision for impairment | 70,685,041 | – | 1,407 | 70,530,764 | 152,870 | |||
| Net carrying amount | 34 | 725,935,299 | 564,355,883 | 7,641,287 | 153,938,129 | – | ||
| Financial assets measured at fair value through other comprehensive income | ||||||||
| Government securities (Risk free investments) | 116,840,307 | 116,840,307 | – | – | – | |||
| Rating 0-4: Investment grade | 215,933 | 215,933 | – | |||||
| Rating 5-6: Moderate risk | – | – | – | – | – | |||
| Rating 7-8: High risk | – | – | – | – | – | |||
| Rating 9: Extreme risk | – | – | – | – | – | |||
| Gross carrying amount | 117,056,240 | 117,056,240 | – | – | – | |||
| Less: Provision for impairment | – | – | – | – | – | |||
| Net carrying amount | 35 | 117,056,240 | 117,056,240 | – | – | – | ||
| Off-balance sheet (**) | ||||||||
| Contingent liabilities and commitments | ||||||||
| (i) Lending commitments | ||||||||
| Grade 0-6: Investment grade to moderate risk | 132,065,118 | – | 127,279,327 | 4,725,389 | 60,402 | |||
| Grade 7-9: High risk to extreme risk | – | – | – | – | – | |||
| Gross carrying amount | 132,065,118 | – | 127,279,327 | 4,725,389 | 60,402 | |||
| (ii) Contingencies | ||||||||
| Grade 0-6: Investment grade to moderate risk | 415,235,523 | 198,809,096 | 212,869,228 | 1,215,048 | 2,342,151 | |||
| Grade 7-9: High risk to extreme risk | – | – | – | – | – | |||
| Gross carrying amount | 415,235,523 | 198,809,096 | 212,869,228 | 1,215,048 | 2,342,151 | |||
| Total contingent liabilities and commitments | 57 | 547,300,641 | 198,809,096 | 340,148,555 | 5,940,437 | 2,402,553 | ||
| Provision for impairment | 57.3 (b) | 7,887,687 | – | 3,832,621 | 1,605,681 | 2,449,385 | ||
| Carrying amount | Not subject to ECL | Subject to | ||||||
| As at December 31, 2021 | 12-month ECL (Stage 1) | Lifetime ECL – not credit impaired (Stage 2) | Lifetime ECL – credit impaired (Stage 3) | |||||
| Note | Rs. ’000 | Rs. ’000 | Rs. ’000 | Rs. ’000 | Rs. ’000 | |||
| Cash and cash equivalents | ||||||||
| Risk free investments | 30,276,356 | 30,276,356 | – | – | – | |||
| Rating 0-4: Investment grade | 35,373,724 | – | 35,373,724 | – | – | |||
| Rating 5-6: Moderate risk | 2,435,551 | – | 2,435,551 | – | – | |||
| Rating 7-8: High risk | – | – | – | – | – | |||
| Rating 9: Extreme risk | – | – | – | – | – | |||
| Gross carrying amount | 68,085,631 | 30,276,356 | 37,809,275 | – | – | |||
| Less: Provision for impairment | 7,555 | – | 7,555 | – | – | |||
| Net carrying amount | 28 | 68,078,076 | 30,276,356 | 37,801,720 | – | – | ||
| Placements with Central Bank and other Banks | ||||||||
| Risk free investments (Excluding Statutory Reserve) | 13,105,398 | 13,105,398 | – | – | – | |||
| Rating 0-4: Investment grade | 11,590,882 | – | 11,590,882 | – | – | |||
| Rating 5-6: Moderate risk | – | – | – | – | – | |||
| Rating 7-8: High risk | – | – | – | – | – | |||
| Rating 9: Extreme risk | – | – | – | – | – | |||
| Gross carrying amount | 24,696,280 | 13,105,398 | 11,590,882 | – | – | |||
| Less: Provision for impairment | 5,930 | – | 5,930 | – | – | |||
| Net carrying amount | 29 & 30 | 24,690,350 | 13,105,398 | 11,584,952 | – | – | ||
| Financial assets at amortised cost – Loans and advances to other customers | ||||||||
| Government securities (Risk free investments) | – | – | – | – | – | |||
| Rating 0-4: Investment grade (*) | 781,407,131 | – | 693,942,543 | 80,421,587 | 7,043,001 | |||
| Rating 5-6: Moderate risk | 223,404,861 | – | 148,341,718 | 58,362,563 | 16,700,580 | |||
| Rating 7-8: High risk | 25,814,803 | – | 3,307,734 | 15,028,167 | 7,478,902 | |||
| Rating 9: Extreme risk | 48,058,333 | – | 177,332 | 27,848 | 47,853,153 | |||
| Gross carrying amount | 1,078,685,128 | – | 845,769,327 | 153,840,165 | 79,075,636 | |||
| Less: Provision for impairment | 64,066,548 | – | 10,027,938 | 18,973,409 | 35,065,201 | |||
| Net carrying amount | 33 | 1,014,618,580 | – | 835,741,389 | 134,866,756 | 44,010,435 | ||
| Financial assets at amortised cost – Debt and other financial instruments | ||||||||
| Government securities (Risk free investments) | 284,725,818 | 284,725,818 | – | – | – | |||
| Rating 0-4: Investment grade | 90,205,361 | – | 90,205,361 | – | – | |||
| Rating 5-6: Moderate risk | 1,610 | – | 1,610 | – | – | |||
| Rating 7-8: High risk | 152,870 | – | – | – | 152,870 | |||
| Rating 9: Extreme risk | – | – | – | – | – | |||
| Gross carrying amount | 375,085,659 | 284,725,818 | 90,206,971 | – | 152,870 | |||
| Less: Provision for impairment | 5,667,770 | – | 5,514,900 | – | 152,870 | |||
| Net carrying amount | 34 | 369,417,889 | 284,725,818 | 84,692,071 | – | – | ||
| Financial assets measured at fair value through other comprehensive income | ||||||||
| Government securities (Risk free investments) | 265,632,081 | 265,632,081 | – | – | – | |||
| Rating 0-4: Investment grade | 74,391,174 | – | 74,391,174 | |||||
| Rating 5-6: Moderate risk | 449,732 | 449,732 | – | – | – | |||
| Rating 7-8: High risk | – | – | – | – | – | |||
| Rating 9: Extreme risk | – | – | – | – | – | |||
| Gross carrying amount | 340,472,987 | 266,081,813 | 74,391,174 | – | – | |||
| Less: Provision for impairment | 5,009,649 | – | 5,009,649 | – | – | |||
| Net carrying amount | 35 | 335,463,338 | 266,081,813 | 69,381,525 | – | – | ||
| Off-balance sheet (**) | ||||||||
| Contingent liabilities and commitments | ||||||||
| (i) Lending commitments | ||||||||
| Grade 0-6: Investment grade to moderate risk | 143,400,310 | – | 139,418,405 | 3,616,084 | 365,821 | |||
| Grade 7-9: High risk to extreme risk | – | – | – | – | – | |||
| Gross carrying amount | 143,400,310 | – | 139,418,405 | 3,616,084 | 365,821 | |||
| (ii) Contingencies | ||||||||
| Grade 0-6: Investment grade to moderate risk | 536,752,669 | 268,010,348 | 263,917,835 | 1,840,922 | 2,983,564 | |||
| Grade 7-9: High risk to extreme risk | – | – | – | – | – | |||
| Gross carrying amount | 536,752,669 | 268,010,348 | 263,917,835 | 1,840,922 | 2,983,564 | |||
| Total contingent liabilities and commitments | 57 | 680,152,979 | 268,010,348 | 403,336,240 | 5,457,006 | 3,349,385 | ||
| Provision for impairment | 57.3 (b) | 5,356,900 | – | 2,082,029 | 814,948 | 2,459,923 | ||
(*) Investment grade also include Cash and Gold.
(**) Amounts reported above does not include capital commitments by the Bank disclosed in the Note 57 on “Contingent Liabilities and Commitments”.
Financial assets at amortised cost – Loans and advances to other customers and contingent liabilities and commitments categorised based on Bank’s internal risk rating and other financial assets are categorised based on external credit rating of respective counterparties.
66.1.1 (b) Credit exposure movement – ECL stage-wise
The following tables show reconciliations from the opening to closing balance of the gross carrying amounts by class of financial instrument.
| Subject to | |||||
| Carrying amount | Not subject to ECL | 12-month ECL (Stage 1) |
Lifetime ECL not credit impaired (Stage 2) |
Lifetime ECL credit impaired (Stage 3) |
|
| Rs. ’000 | Rs. ’000 | Rs. ’000 | Rs. ’000 | Rs. ’000 | |
| Cash and cash equivalents | |||||
| Gross carrying amount as at January 01, 2022 | 68,085,631 | 30,276,356 | 37,809,275 | – | – |
| Transfer to Stage 1 | – | – | – | – | – |
| Transfer to Stage 2 | – | – | – | – | – |
| Transfer to Stage 3 | – | – | – | – | – |
| New assets originated or purchased | 71,048,721 | 14,496,264 | 56,552,457 | – | – |
| Financial assets derecognised or repaid (excluding write-offs) | (13,450,415) | – | (13,450,415) | – | – |
| Foreign exchange adjustments | 23,723,364 | 2,331,761 | 21,391,603 | – | – |
| As at December 31, 2022 | 149,407,301 | 47,104,381 | 102,302,920 | – | – |
| Placements with Central Bank and other Banks | |||||
| Gross carrying amount as at January 01, 2022 | 24,696,280 | – | 24,696,280 | – | – |
| Transfer to Stage 1 | – | – | – | – | – |
| Transfer to Stage 2 | – | – | – | – | – |
| Transfer to Stage 3 | – | – | – | – | – |
| New assets originated or purchased | 86,199,464 | – | 86,199,464 | – | – |
| Financial assets derecognised or repaid (excluding write-offs) | (30,635,926) | – | (30,635,926) | – | – |
| Foreign exchange adjustments | 15,673,938 | – | 15,673,938 | – | – |
| As at December 31, 2022 | 95,933,756 | – | 95,933,756 | – | – |
| Financial assets at amortised cost – Loans and advances to other customers | |||||
| Gross carrying amount as at January 01, 2022 | 1,078,685,128 | – | 845,769,327 | 153,840,165 | 79,075,636 |
| Transfer to Stage 1 | – | – | 46,335,517 | (45,139,231) | (1,196,286) |
| Transfer to Stage 2 | – | – | (55,962,595) | 61,299,234 | (5,336,639) |
| Transfer to Stage 3 | – | – | (7,304,423) | (25,793,481) | 33,097,904 |
| New assets originated or purchased | 527,930,404 | – | 477,186,436 | 43,262,493 | 7,481,475 |
| Financial assets derecognised or repaid (excluding write-offs) | (607,652,181) | – | (530,515,444) | (59,019,458) | (18,117,279) |
| Write-offs (*) | (3,238,797) | – | – | – | (3,238,797) |
| Foreign exchange adjustments | 178,832,788 | – | 154,073,420 | 17,785,612 | 6,973,756 |
| Changes to contractual cash flows due to modifications not resulting in derecognition | 45,109,901 | – | 1,927,449 | 27,183,367 | 15,999,085 |
| As at December 31, 2022 | 1,219,667,243 | – | 931,509,687 | 173,418,701 | 114,738,855 |
| Financial assets at amortised cost – Debt and other financial instruments | |||||
| Gross carrying amount as at January 01, 2022 | 375,085,659 | 284,725,818 | 90,206,971 | – | 152,870 |
| Transfer to Stage 1 | – | – | (83,526,928) | 83,526,928 | – |
| Transfer to Stage 2 | – | – | – | – | – |
| Transfer to Stage 3 | – | – | – | – | – |
| New assets originated or purchased | 131,415,907 | 112,978,205 | 1,273,486 | 17,164,216 | – |
| Financial assets derecognised or repaid (excluding write-offs) | (129,343,017) | (51,366,652) | (311,676) | (77,664,689) | – |
| Reclassification adjustment | 312,906,219 | 201,437,745 | – | 111,468,474 | – |
| Foreign exchange adjustments | 106,555,572 | 16,580,767 | 841 | 89,973,964 | – |
| As at December 31, 2022 | 796,620,340 | 564,355,883 | 7,642,694 | 224,468,893 | 152,870 |
| Financial assets measured at fair value through other comprehensive income | |||||
| Gross carrying amount as at January 01, 2022 | 340,472,987 | 266,081,811 | 74,391,176 | – | – |
| Transfer to Stage 1 | – | – | (74,391,176) | 74,391,176 | – |
| Transfer to Stage 2 | – | – | – | – | – |
| Transfer to Stage 3 | – | – | – | – | – |
| New assets originated or purchased | 103,436,258 | 103,436,258 | – | – | – |
| Financial assets derecognised or repaid (excluding write-offs) | (65,513,843) | (65,513,843) | – | – | – |
| Reclassification adjustment | (311,439,672) | (201,437,745) | – | (110,001,927) | – |
| Foreign exchange adjustments | 35,622,732 | 11,981 | – | 35,610,751 | – |
| Change in fair value due to remeasurement | 14,477,778 | 14,477,778 | – | – | |
| As at December 31, 2022 | 117,056,240 | 117,056,240 | – | – | – |
| Contingent liabilities and commitments | |||||
| Gross carrying amount as at January 01, 2022 | 680,152,979 | 268,010,348 | 403,336,240 | 5,457,006 | 3,349,385 |
| Transfer to Stage 1 | – | – | 2,741,444 | (2,246,708) | (494,736) |
| Transfer to Stage 2 | – | – | (6,805,111) | 6,897,445 | (92,334) |
| Transfer to Stage 3 | – | – | (36,075) | (62,845) | 98,920 |
| Net change in New assets originated or purchased/Financial assets derecognised or repaid (excluding write-offs) | (132,852,338) | (69,201,252) | (59,087,943) | (4,104,461) | (458,682) |
| As at December 31, 2022 | 547,300,641 | 198,809,096 | 340,148,555 | 5,940,437 | 2,402,553 |
(*) Due to enforcement activities, loans and advances amounting to Rs. 16.353 Mn. was written off during the year.
| Subject to | |||||
| Carrying amount | Not subject to ECL | 12-month
ECL (Stage 1) |
Lifetime ECL not credit impaired (Stage 2) | Lifetime ECL credit impaired (Stage 3) | |
| Rs. ’000 | Rs. ’000 | Rs. ’000 | Rs. ’000 | Rs. ’000 | |
| Cash and cash equivalents | |||||
| Gross carrying amount as at January 01, 2021 | 50,253,868 | 26,152,779 | 24,101,089 | – | – |
| Transfer to Stage 1 | – | – | – | – | – |
| Transfer to Stage 2 | – | – | – | – | – |
| Transfer to Stage 3 | – | – | – | – | – |
| New assets originated or purchased | 19,649,337 | 4,123,577 | 15,525,760 | – | – |
| Financial assets derecognised or repaid (excluding write-offs) | (1,817,574) | – | (1,817,574) | – | – |
| As at December 31, 2021 | 68,085,631 | 30,276,356 | 37,809,275 | – | – |
| Placements with Central Bank and other Banks | |||||
| Gross carrying amount as at January 01, 2021 | 110,347,301 | – | 110,347,301 | – | – |
| Transfer to Stage 1 | – | – | – | – | – |
| Transfer to Stage 2 | – | – | – | – | – |
| Transfer to Stage 3 | – | – | – | – | – |
| New assets originated or purchased | 24,696,280 | – | 24,696,280 | – | – |
| Financial assets derecognised or repaid (excluding write-offs) | (110,347,301) | – | (110,347,301) | – | – |
| As at December 31, 2021 | 24,696,280 | – | 24,696,280 | – | – |
| Financial assets at amortised cost – Loans and advances to other customers | |||||
| Gross carrying amount as at January 01, 2021 | 947,841,905 | – | 740,254,706 | 105,011,766 | 102,575,433 |
| Transfer to Stage 1 | – | – | 14,755,909 | (13,531,224) | (1,224,685) |
| Transfer to Stage 2 | – | – | (37,213,850) | 59,086,325 | (21,872,475) |
| Transfer to Stage 3 | – | – | (3,669,537) | (4,270,785) | 7,940,322 |
| New assets originated or purchased | 505,250,921 | – | 469,012,166 | 34,049,647 | 2,189,108 |
| Financial assets derecognised or repaid (excluding write-offs) | (394,031,721) | – | (337,369,676) | (37,058,965) | (19,603,080) |
| Write-offs (*) | (929,627) | – | (391) | (84) | (929,152) |
| Changes to contractual cash flows due to modifications not resulting in derecognition | 20,553,650 | – | – | 10,553,485 | 10,000,165 |
| As at December 31, 2021 | 1,078,685,128 | – | 845,769,327 | 153,840,165 | 79,075,636 |
| Financial assets at amortised cost – Debt and other financial instruments | |||||
| Gross carrying amount as at January 01, 2021 | 294,836,457 | 197,785,756 | 96,897,831 | – | 152,870 |
| Transfer to Stage 1 | – | – | – | – | – |
| Transfer to Stage 2 | – | – | – | – | – |
| Transfer to Stage 3 | – | – | – | – | – |
| New assets originated or purchased | 107,674,053 | 101,713,040 | 5,961,013 | – | – |
| Financial assets derecognised or repaid (excluding write-offs) | (33,993,067) | (14,683,780) | (19,309,287) | – | – |
| Reclassification adjustment | – | – | – | – | – |
| Foreign exchange adjustments | 6,568,216 | (89,198) | 6,657,414 | – | – |
| As at December 31, 2021 | 375,085,659 | 284,725,818 | 90,206,971 | – | 152,870 |
| Financial assets measured at fair value through other comprehensive income | |||||
| Gross carrying amount as at January 01, 2021 | 280,137,202 | 201,329,443 | 78,807,759 | – | – |
| Transfer to Stage 1 | – | – | – | – | – |
| Transfer to Stage 2 | – | – | – | – | – |
| Transfer to Stage 3 | – | – | – | – | – |
| New assets originated or purchased | 194,086,697 | 186,842,735 | 7,243,962 | – | – |
| Financial assets derecognised or repaid (excluding write-offs) | (121,758,562) | (104,472,602) | (17,285,960) | – | – |
| Reclassification adjustment | – | – | – | – | – |
| Foreign exchange adjustments | 4,461,110 | 1,215 | 4,459,895 | – | – |
| Change in fair value due to remeasurement | (16,453,460) | (17,618,980) | 1,165,520 | – | – |
| As at December 31, 2021 | 340,472,987 | 266,081,811 | 74,391,176 | – | – |
| Contingent liabilities and commitments | |||||
| Gross carrying amount as at January 01, 2021 | 727,692,911 | 355,337,535 | 368,695,997 | 2,859,858 | 799,521 |
| Transfer to Stage 1 | – | – | 950,603 | (949,641) | (962) |
| Transfer to Stage 2 | – | – | (3,530,865) | 3,754,729 | (223,864) |
| Transfer to Stage 3 | – | – | (316,640) | (205,849) | 522,489 |
| Net change in New assets originated or purchased/Financial assets derecognised or repaid (excluding write offs) | (47,539,932) | (87,327,187) | 37,537,145 | (2,091) | 2,252,201 |
| As at December 31, 2021 | 680,152,979 | 268,010,348 | 403,336,240 | 5,457,006 | 3,349,385 |
(*) Due to enforcement activities, loans and advances amounting to Rs. 685.642 Mn. was written off during the year.
66.1.1 (c) Provision for impairment (ECL) movement
The following tables show reconciliations from the opening to closing balance of the provision for impairment by class of financial instrument.
| 12-month ECL (Stage 1) |
Lifetime ECL not credit impaired (Stage 2) |
Lifetime ECL – credit impaired (Stage 3) |
Total | ||
| Note | Rs. ’000 | Rs. ’000 | Rs. ’000 | Rs. ’000 | |
| Cash and cash equivalents | |||||
| Provision for impairment (ECL) as at January 01, 2022 | 7,555 | – | – | 7,555 | |
| Transfer to Stage 1 | – | – | – | – | |
| Transfer to Stage 2 | – | – | – | – | |
| Transfer to Stage 3 | – | – | – | – | |
| Net remeasurement of impairment | 2,551 | – | – | 2,551 | |
| New assets originated or purchased | 9,917 | – | – | 9,917 | |
| Financial assets derecognised or repaid (excluding write-offs) | (9,547) | – | – | (9,547) | |
| Foreign exchange adjustments | 3,214 | – | – | 3,214 | |
| As at December 31, 2022 | 28.1 | 13,690 | – | – | 13,690 |
| Placements with Central Bank and other Banks | |||||
| Provision for impairment (ECL) as at January 01, 2022 | 5,930 | – | – | 5,930 | |
| Transfer to Stage 1 | – | – | – | – | |
| Transfer to Stage 2 | – | – | – | – | |
| Transfer to Stage 3 | – | – | – | – | |
| Net remeasurement of impairment | – | – | – | – | |
| New assets originated or purchased | 34,111 | – | – | 34,111 | |
| Financial assets derecognised or repaid (excluding write-offs) | (9,149) | – | – | (9,149) | |
| Foreign exchange adjustments | 3,219 | – | – | 3,219 | |
| As at December 31, 2022 | 30.1 | 34,111 | – | – | 34,111 |
| Financial assets at amortised cost – Loans and advances to other customers | |||||
| Provision for impairment (ECL) as at January 01, 2022 | 10,027,938 | 18,973,409 | 35,065,201 | 64,066,548 | |
| Transfer to Stage 1 | 6,471,716 | (5,943,868) | (527,848) | – | |
| Transfer to Stage 2 | (1,857,039) | 3,461,046 | (1,604,007) | – | |
| Transfer to Stage 3 | (109,841) | (2,897,747) | 3,007,588 | – | |
| Net remeasurement of impairment | (2,376,706) | 8,918,073 | 8,487,567 | 15,028,934 | |
| New assets originated or purchased | 4,422,368 | 6,074,364 | 1,925,063 | 12,421,795 | |
| Financial assets derecognised or repaid (excluding write-offs) | (4,270,370) | (5,947,674) | (5,243,271) | (15,461,315) | |
| Write-offs and recoveries | – | – | (2,775,787) | (2,775,787) | |
| Foreign exchange adjustments | 2,181,334 | 1,246,428 | 3,581,147 | 7,008,909 | |
| Unwinding of discount | – | – | (1,216,457) | (1,216,457) | |
| Other movements | – | – | 179,665 | 179,665 | |
| Changes to contractual cash flows due to modifications not resulting in derecognition |
109,187 | 4,364,645 | 5,498,540 | 9,972,372 | |
| As at December 31, 2022 | 33.2 (b) | 14,598,587 | 28,248,676 | 46,377,401 | 89,224,664 |
| Financial assets at amortised cost – Debt and other financial instruments | |||||
| Provision for impairment (ECL) as at January 01, 2022 | 5,514,900 | – | 152,870 | 5,667,770 | |
| Transfer to Stage 1 | (5,514,616) | 5,514,616 | – | – | |
| Transfer to Stage 2 | – | – | – | – | |
| Transfer to Stage 3 | – | – | – | – | |
| Net remeasurement of impairment | 310 | 48,569,835 | – | 48,570,145 | |
| New assets originated or purchased | 964 | 3,906,890 | – | 3,907,854 | |
| Financial assets derecognised or repaid (excluding write-offs) | (151) | (5,343,892) | – | (5,344,043) | |
| Foreign exchange adjustments | – | 10,533,664 | – | 10,533,664 | |
| Reclassification adjustment | – | 7,349,651 | – | 7,349,651 | |
| As at December 31, 2022 | 34.1 (b) | 1,407 | 70,530,764 | 152,870 | 70,685,041 |
| Financial assets measured at fair value through other comprehensive income | |||||
| Provision for impairment (ECL) as at January 01, 2022 | 5,009,649 | – | – | 5,009,649 | |
| Transfer to Stage 1 | – | – | – | – | |
| Transfer to Stage 2 | – | – | – | – | |
| Transfer to Stage 3 | – | – | – | – | |
| Net remeasurement of impairment | – | – | – | – | |
| New assets originated or purchased | – | – | – | – | |
| Financial assets derecognised or repaid (excluding write-offs) | – | – | – | – | |
| Foreign exchange adjustments | 2,340,002 | – | – | 2,340,002 | |
| Reclassification adjustment | (7,349,651) | – | – | (7,349,651) | |
| As at December 31, 2022 | 35.2 | – | – | – | – |
| Contingent liabilities and commitments | |||||
| Provision for impairment (ECL) as at January 01, 2022 | 2,082,029 | 814,948 | 2,459,923 | 5,356,900 | |
| Transfer to Stage 1 | 286,298 | (221,211) | (65,087) | – | |
| Transfer to Stage 2 | (114,454) | 117,751 | (3,297) | – | |
| Transfer to Stage 3 | (471) | (24,226) | 24,697 | – | |
| Net remeasurement of impairment | (423,302) | 82,964 | (2,392) | (342,730) | |
| New assets originated or purchased | 2,774,946 | 1,394,534 | 101,354 | 4,270,834 | |
| Financial assets derecognised or repaid (excluding write-offs) | (966,417) | (662,532) | (111,089) | (1,740,038) | |
| Foreign exchange adjustments | 193,992 | 103,453 | 45,276 | 342,721 | |
| As at December 31, 2022 | 57.3 (b) | 3,832,621 | 1,605,681 | 2,449,385 | 7,887,687 |
| 12-month
ECL (Stage 1) |
Lifetime ECL –
not credit
impaired (Stage 2) |
Lifetime
ECL – credit
impaired (Stage 3) |
Total | ||
| Note | Rs. ’000 | Rs. ’000 | Rs. ’000 | Rs. ’000 | |
| Cash and cash equivalents | |||||
| Provision for impairment (ECL) as at January 01, 2021 | 3,241 | – | – | 3,241 | |
| Transfer to Stage 1 | – | – | – | – | |
| Transfer to Stage 2 | – | – | – | – | |
| Transfer to Stage 3 | – | – | – | – | |
| Net remeasurement of impairment | (1,124) | – | – | (1,124) | |
| New assets originated or purchased | 6,332 | – | – | 6,332 | |
| Financial assets derecognised or repaid (excluding write-offs) | (895) | – | – | (895) | |
| Foreign exchange adjustments | 1 | – | – | 1 | |
| As at December 31, 2021 | 28.1 | 7,555 | – | – | 7,555 |
| Placements with Central Bank and other Banks | |||||
| Provision for impairment (ECL) as at January 01, 2021 | 3,003 | – | – | 3,003 | |
| Transfer to Stage 1 | – | – | – | – | |
| Transfer to Stage 2 | – | – | – | – | |
| Transfer to Stage 3 | – | – | – | – | |
| New assets originated or purchased | 5,826 | – | – | 5,826 | |
| Financial assets derecognised or repaid (excluding write-offs) | (3,003) | – | – | (3,003) | |
| Foreign exchange adjustments | 104 | – | – | 104 | |
| As at December 31, 2021 | 30.1 | 5,930 | – | – | 5,930 |
| Financial assets at amortised cost – Loans and advances to other customers | |||||
| Provision for impairment (ECL) as at January 01, 2021 | 6,470,880 | 12,244,433 | 32,281,139 | 50,996,452 | |
| Transfer to Stage 1 | 1,112,720 | (857,754) | (254,966) | – | |
| Transfer to Stage 2 | (792,269) | 2,475,531 | (1,683,262) | – | |
| Transfer to Stage 3 | (39,996) | (632,774) | 672,770 | – | |
| Net remeasurement of impairment | 1,186,680 | 2,381,767 | 3,708,633 | 7,277,080 | |
| New assets originated or purchased | 2,863,733 | 3,934,433 | 501,304 | 7,299,470 | |
| Financial assets derecognised or repaid (excluding write-offs) | (778,565) | (2,242,555) | (3,050,647) | (6,071,767) | |
| Write-offs and recoveries | (482) | (158) | (691,667) | (692,307) | |
| Foreign exchange adjustments | 5,237 | (15) | 93,581 | 98,803 | |
| Unwinding of discount | – | – | (1,132,155) | (1,132,155) | |
| Other movements | – | – | 242,393 | 242,393 | |
| Changes to contractual cash flows due to modifications not resulting in derecognition | – | 1,670,501 | 4,378,078 | 6,048,579 | |
| As at December 31, 2021 | 33.2 (b) | 10,027,938 | 18,973,409 | 35,065,201 | 64,066,548 |
| Financial assets at amortised cost – Debt and other financial instruments | |||||
| Provision for impairment (ECL) as at January 01, 2021 | 1,956,021 | – | 152,870 | 2,108,891 | |
| Transfer to Stage 1 | – | – | – | – | |
| Transfer to Stage 2 | – | – | – | – | |
| Transfer to Stage 3 | – | – | – | – | |
| Net remeasurement of impairment | 3,922,155 | – | – | 3,922,155 | |
| New assets originated or purchased | 151 | – | – | 151 | |
| Financial assets derecognised or repaid (excluding write-offs) | (363,427) | – | – | (363,427) | |
| Reclassification adjustment | – | – | – | – | |
| As at December 31, 2021 | 34.1 (b) | 5,514,900 | – | 152,870 | 5,667,770 |
| Financial assets measured at fair value through other comprehensive income | |||||
| Provision for impairment (ECL) as at January 01, 2021 | 1,675,834 | – | – | 1,675,834 | |
| Transfer to Stage 1 | – | – | – | – | |
| Transfer to Stage 2 | – | – | – | – | |
| Transfer to Stage 3 | – | – | – | – | |
| Net remeasurement of impairment | 3,514,986 | – | – | 3,514,986 | |
| New assets originated or purchased | 75,245 | – | – | 75,245 | |
| Financial assets derecognised or repaid (excluding write-offs) | (256,416) | – | – | (256,416) | |
| Reclassification adjustment | – | – | – | – | |
| As at December 31, 2021 | 35.2 | 5,009,649 | – | – | 5,009,649 |
| Contingent liabilities and commitments | |||||
| Provision for impairment (ECL) as at January 01, 2021 | 1,532,691 | 244,482 | 339,676 | 2,116,849 | |
| Transfer to Stage 1 | 70,078 | (67,475) | (2,603) | – | |
| Transfer to Stage 2 | (38,578) | 149,953 | (111,375) | – | |
| Transfer to Stage 3 | (484) | (2,073) | 2,557 | – | |
| Net remeasurement of impairment | (52,145) | 42,244 | 7,427 | (2,474) | |
| New assets originated or purchased/Financial assets derecognised or repaid (excluding write-offs) | 1,100,870 | 612,002 | 2,428,786 | 4,141,658 | |
| Financial assets derecognised or repaid (excluding write-offs) | (532,879) | (164,185) | (204,545) | (901,609) | |
| Foreign exchange adjustments | 2,476 | – | – | 2,476 | |
| As at December 31, 2021 | 57.3 (b) | 2,082,029 | 814,948 | 2,459,923 | 5,356,900 |
66.1.1 (d) Financial assets recognised through profit or loss measured at fair value
Fair value through profit or loss investments in debt and equity securities
The table below sets out the credit quality of debt and equity securities classified through profit or loss measured at fair value. Debt securities include investments made by the Bank in Government Securities of Sri Lanka and Bangladesh. The analysis of equity securities is based on Fitch Rating Nomenclature or Equivalent Ratings, where applicable.
| 2022 | 2021 | ||
| Note | Rs. ’000 | Rs. ’000 | |
| Debt instruments at FVTPL | |||
| Government securities – Sri Lanka | |||
| Treasury bills | - | 1,782,169 | |
| Treasury bonds | 3,643,078 | 5,219,111 | |
| Government securities – Bangladesh | |||
| Treasury bills | 11,703,803 | 5,782,971 | |
| Treasury bonds | 7,501,370 | 9,055,000 | |
| Subtotal – Debt instruments at FVTPL | 32.1 | 22,848,251 | 21,839,251 |
| Equity instruments at FVTPL | |||
| Rated AAA | 69,357 | 60,119 | |
| Rated AA+ to AA- | 72,515 | 132,637 | |
| Rated A+ to A | 1,553,097 | 1,021,457 | |
| Rated BBB+ | 5,628 | 9,359 | |
| Unrated | 324,209 | 373,300 | |
| Subtotal – Equity instruments at FVTPL | 32.2 | 2,024,806 | 1,596,872 |
| Total | 32 | 24,873,057 | 23,436,123 |
Credit exposure arising from derivative transactions
Credit risk arising from derivative financial instruments at any time is limited to those with positive fair values, as reported in the Statement of Financial Position. With gross settled derivatives, the Bank is also exposed to a settlement risk, being the risk that the counterparty failing to deliver the value.
The tables below show analysis of credit exposures arising from derivative financial assets and liabilities:
| As at December 31, 2022 | Derivative type | |||||||||
| Forward | SWAPS | Spot | Options | Total | ||||||
| Notional amount | Fair value | Notional amount | Fair value | Notional amount | Fair value | Notional amount | Fair value | Notional amount | Fair value | |
| Rs. ’000 | Rs. ’000 | Rs. ’000 | Rs. ’000 | Rs. ’000 | Rs. ’000 | Rs. ’000 | Rs. ’000 | Rs. ’000 | Rs. ’000 | |
| Derivative financial assets (Note 1) | 30,653,862 | 1,349,719 | 67,008,905 | 6,994,807 | 627,386 | 565 | – | – | 98,290,153 | 8,345,091 |
| Derivative financial liabilities (Note 2) | 10,700,174 | (373,965) | 19,637,659 | (2,505,643) | 99,600 | (1,059) | – | – | 30,437,433 | (2,880,667) |
| Note 1 | ||||||||||
| Derivative financial assets by counterparty type | ||||||||||
| Banks | 734,000 | 11,409 | 64,806,905 | 6,785,681 | 627,386 | 59 | – | – | 66,168,291 | 6,797,149 |
| Other customers | 29,919,862 | 1,338,310 | 2,202,000 | 209,126 | – | 506 | – | – | 32,121,862 | 1,547,942 |
| Total | 30,653,862 | 1,349,719 | 67,008,905 | 6,994,807 | 627,386 | 565 | – | – | 98,290,153 | 8,345,091 |
| Note 2 | ||||||||||
| Derivative financial liabilities by counterparty type | ||||||||||
| Banks | 183,500 | (777) | 14,496,500 | (951,449) | 99,600 | (976) | – | – | 14,779,600 | (953,202) |
| Other customers | 10,516,674 | (373,188) | 5,141,159 | (1,554,194) | – | (83) | – | – | 15,657,833 | (1,927,465) |
| Total | 10,700,174 | (373,965) | 19,637,659 | (2,505,643) | 99,600 | (1,059) | – | – | 30,437,433 | (2,880,667) |
| As at December 31, 2021 | Derivative type | |||||||||
| Forward | SWAPS | Spot | Options | Total | ||||||
| Notional amount | Fair value | Notional amount | Fair value | Notional amount | Fair value | Notional amount | Fair value | Notional amount | Fair value | |
| Rs. ’000 | Rs. ’000 | Rs. ’000 | Rs. ’000 | Rs. ’000 | Rs. ’000 | Rs. ’000 | Rs. ’000 | Rs. ’000 | Rs. ’000 | |
| Derivative financial assets (Note 1) | 26,160,622 | 572,517 | 126,174,859 | 2,672,049 | 1,103,111 | 170 | 95,101 | 384 | 153,533,693 | 3,245,120 |
| Derivative financial liabilities (Note 2) | 6,483,380 | (258,788) | 56,743,238 | (1,827,553) | 5,449,768 | (5,473) | 95,101 | (384) | 68,771,487 | (2,092,198) |
| Note 1 | ||||||||||
| Derivative financial assets by counterparty type | ||||||||||
| With Banks | 1,045,000 | 10,277 | 125,174,859 | 2,465,767 | 920,906 | 170 | 16,044 | 66 | 127,156,809 | 2,476,280 |
| Other customers | 25,115,622 | 562,240 | 1,000,000 | 206,282 | 182,205 | – | 79,057 | 318 | 26,376,884 | 768,840 |
| Total | 26,160,622 | 572,517 | 126,174,859 | 2,672,049 | 1,103,111 | 170 | 95,101 | 384 | 153,533,693 | 3,245,120 |
| Note 2 | ||||||||||
| Derivative financial liabilities by counterparty type | ||||||||||
| With Banks | 650,000 | (266) | 52,838,955 | (1,138,159) | 476,165 | (434) | 79,057 | (318) | 54,044,177 | (1,139,177) |
| Other customers | 5,833,380 | (258,522) | 3,904,283 | (689,394) | 4,973,603 | (5,039) | 16,044 | (66) | 14,727,310 | (953,021) |
| Total | 6,483,380 | (258,788) | 56,743,238 | (1,827,553) | 5,449,768 | (5,473) | 95,101 | (384) | 68,771,487 | (2,092,198) |
66.1.2 Credit-impaired financial assets
Reconciliation of changes in the net carrying amount of lifetime ECL credit impaired (Stage 3) loans and advances as detailed below:
| 2022 | 2021 | |
| Rs. ’000 | Rs. ’000 | |
| Stage 3 loans and advances to other customers as at January 01, | 44,010,435 | 70,294,294 |
| Newly classified as impaired loans and advances during the year | 35,938,834 | 12,100,621 |
| Net change in already impaired loans and advances during the year | (3,775,606) | (4,238,959) |
| Net payment, write-off and recoveries and other movements during the year | (7,812,209) | (34,145,521) |
| Impaired loans and advances to customers as at December 31, | 68,361,454 | 44,010,435 |
Refer Note 18 for methodology of impairment assessment, on “Impairment charges on loans and advances to other customers”
Details of provision for impairment for loans and advances to other customers, are detailed in Note 33.
Set out below is an analysis of the gross and net carrying amounts of life time ECL credit impaired (Stage 3) loans and advances to other customers by risk rating.
| As at December 31, | 2022 | 2021 | ||
| Gross carrying amount | Net carrying amount | Gross carrying amount | Net carrying amount | |
| Rs. ’000 | Rs. ’000 | Rs. ’000 | Rs. ’000 | |
| Rating 0-4: Investment grade | 12,696,806 | 10,561,921 | 7,043,001 | 5,136,063 |
| Rating 5-6: Moderate risk | 23,507,688 | 15,430,726 | 16,700,580 | 10,016,789 |
| Rating 7-8: High risk | 24,622,313 | 16,284,152 | 7,478,902 | 5,492,123 |
| Rating 9: Extreme risk | 53,912,048 | 26,084,655 | 47,853,153 | 23,365,460 |
| Total | 114,738,855 | 68,361,454 | 79,075,636 | 44,010,435 |
66.1.3 Sensitivity of impairment provision on loans and advances to other customers and FCY denominated Government securities
The Bank has estimated the impairment provision on loans and advances to other customers and FCY denominated Government securities as at December 31, 2022, subject to various assumptions. The changes to such assumptions may lead to changes in the impairment provision recorded in the Statement of Financial Position.
The following table demonstrates the sensitivity of the impairment provision on loans and advances to other customers and FCY denominated Government securities of the Bank as at December 31, 2022 to a feasible change in impairment parameters.
| Impairment parameters | Sensitivity effect on Statement of Financial Position [Increase/(decrease) in impairment provision] |
Sensitivity effect on Income Statement Rs. ’000 |
||||||
| Stage 1 Rs. ’000 |
Stage 2 Rs. ’000 |
Stage 3 Rs. ’000 |
Total Rs. ’000 |
|||||
| 1% increase in PD across all age buckets | 4,908,777 | 563,076 | – | 5,471,853 | (5,471,853) | |||
| 1% decrease in PD across all age buckets (*) | (4,504,024) | (563,076) | – | (5,067,100) | 5,067,100 | |||
| 5% increase in LGD | 1,628,773 | 2,672,128 | 2,291,569 | 6,592,470 | (6,592,470) | |||
| 5% decrease in LGD (*) | (1,628,773) | (2,672,128) | (2,291,569) | (6,592,470) | 6,592,470 | |||
| Probability weighted forward looking macro economic indicators (**) | ||||||||
| – Base case 10% increase, worst case 5% decrease and best case 5% decrease | (23,654) | (28,310) | – | (51,964) | 51,964 | |||
| – Base case 10% decrease, worst case 5% increase and best case 5% increase | 23,654 | 28,310 | – | 51,964 | (51,964) | |||
| Sensitivity of impairment provision on foreign currency denominated government securities | ||||||||
| 2% increase in loss rate | N/A | 4,261,713 | N/A | 4,261,713 | (4,261,713) | |||
| 2% decrease in loss rate | N/A | (4,261,713) | N/A | (4,261,713) | 4,261,713 | |||
(*) The PD/LGD decrease is capped at 0%, if applicable.
(**) Please refer Note 18 for explanation on forward looking Macro Economic Indicators.
66.1.4 Collateral held
Loan-to-value ratio of residential mortgage lending
The table below stratifies eligible credit exposures by ranges of loan-to-value (LTV) ratio. LTV is calculated as the ratio of the gross amount of the loan to the value of the collateral, which is used for the computation of Capital Adequacy Ratios. The value of the collateral for residential mortgage loan is based on the forced sale value determined by professional valuers.
| As at December 31, | 2022 | 2021 | ||
| Rs. ’000 | Composition (%) | Rs. ’000 | Composition (%) | |
| LTV ratio | ||||
| Less than 50% | 18,404,643 | 26.38 | 14,656,389 | 22.71 |
| 51% – 70% | 17,607,065 | 25.23 | 15,284,539 | 23.69 |
| 71% – 90% | 17,951,133 | 25.73 | 18,030,113 | 27.94 |
| 91% – 100% | 1,798,987 | 2.58 | 2,373,719 | 3.68 |
| More than 100% (*) | 14,008,690 | 20.08 | 14,182,945 | 21.98 |
| Total | 69,770,518 | 100.00 | 64,527,705 | 100.00 |
(*) LTV ratio of more than 100% has been arisen due to subsequent disbursements made to the borrower after the initial valuation of the property (the denominator).
The total amount mentioned above does not tally to the total of residential mortgage lending by the Bank, as some of the residential mortgage lending are not eligible to apply preferential risk weight used in the calculation of Capital Adequacy Ratio.
Assets obtained by taking the possession of collaterals
Repossession of collaterals is resorted to in extreme situations where action is necessitated to recover the dues. The repossessed assets are disposed, in an orderly and a transparent manner and the proceeds are used to reduce or recover the outstanding claims and the amounts recovered in excess of the dues are refunded to the customers.
66.1.5 Concentration of credit risk
By setting various concentration limits under different criteria within the established risk appetite framework (i.e. single borrower/group, industry sectors, product, counterparty and country limits etc.), the Bank ensures that an acceptable level of risk diversification is maintained on an ongoing basis. These limits are continuously monitored and periodically reviewed by the Credit Policy Committee (CPC), EIRMC and BIRMC to capture the developments in the market, political and economic environment both locally and globally to strengthen the dynamic portfolio management practices and to provide early warning signals on possible credit concentrations.
The maximum exposure to credit risk in respect of each item of financial assets in the Statement of Financial Position as at the reporting date, as per the industry sector and by geographical region of financial assets is given below:
66.1.5 (a) Industry-wise distribution
| As at December 31, | Agriculture, Forestry and fishing | Manufacturing | Tourism | Transportation and storage | Construction | Infrastructure development | Wholesale and retail trade | Information technology and communication services | Financial services | Professional, scientific and technical activities | Arts, entertainment and recreation | Education | Healthcare, social services and support services | Consumption | Lending to overseas entities | Total | |
| Rs. ’000 | Rs. ’000 | Rs. ’000 | Rs. ’000 | Rs. ’000 | Rs. ’000 | Rs. ’000 | Rs. ’000 | Rs. ’000 | Rs. ’000 | Rs. ’000 | Rs. ’000 | Rs. ’000 | Rs. ’000 | Rs. ’000 | Rs. ’000 | ||
| Financial assets | |||||||||||||||||
| Cash and cash equivalents | – | – | – | – | – | – | – | – | 149,393,611 | – | – | – | – | – | – | 149,393,611 | |
| Balances with central banks | – | – | – | – | – | – | – | – | 66,493,499 | – | – | – | – | – | – | 66,493,499 | |
| Placements with banks | – | – | – | – | – | – | – | – | 95,899,645 | – | – | – | – | – | – | 95,899,645 | |
| Securities purchased under resale agreements | – | – | – | – | – | – | – | – | 1,517,308 | – | – | – | – | – | – | 1,517,308 | |
| Derivative financial assets | – | 192,224 | – | – | – | – | – | 698 | 8,152,169 | – | – | – | – | – | – | 8,345,091 | |
| Financial assets measured at FVTPL | – | 217,799 | 52,749 | – | 8,081 | – | 36,033 | 55,739 | 24,468,610 | – | – | – | 34,046 | – | – | 24,873,057 | |
| Government securities | – | – | – | – | – | – | – | – | 22,848,251 | – | – | – | – | – | – | 22,848,251 | |
| Quoted equity securities | – | 217,799 | 52,749 | – | 8,081 | – | 36,033 | 55,739 | 1,620,359 | – | – | – | 34,046 | – | – | 2,024,806 | |
| Financial assets at AC – Loans and advances to other customers (*) | 119,101,284 | 138,081,651 | 69,255,174 | 19,555,677 | 45,902,727 | 29,344,504 | 236,929,496 | 16,654,877 | 94,450,017 | 26,159,612 | 1,372,606 | 3,304,916 | 20,536,024 | 122,617,256 | 187,176,758 | 1,130,442,579 | |
| Financial assets at AC – Debt and other financial instruments | – | 5,332,844 | – | – | – | – | 80,257 | – | 720,522,198 | – | – | – | – | – | – | 725,935,299 | |
| Government securities | – | – | – | – | – | – | – | – | 718,294,012 | – | – | – | – | – | – | 718,294,012 | |
| Other investments | – | 5,332,844 | – | – | – | – | 80,257 | – | 2,228,186 | – | – | – | – | – | – | 7,641,287 | |
| Financial assets measured at FVOCI | – | 10,284 | – | – | 140,282 | – | – | – | 116,897,054 | 8,620 | – | – | – | – | – | 117,056,240 | |
| Government securities | – | – | – | – | – | – | – | – | 116,840,307 | – | – | – | – | – | – | 116,840,307 | |
| Equity securities | – | 10,284 | – | – | 140,282 | – | – | – | 56,747 | 8,620 | – | – | – | – | – | 215,933 | |
| Total | 119,101,284 | 143,834,802 | 69,307,923 | 19,555,677 | 46,051,090 | 29,344,504 | 237,045,786 | 16,711,314 | 1,277,794,111 | 26,168,232 | 1,372,606 | 3,304,916 | 20,570,070 | 122,617,256 | 187,176,758 | 2,319,956,329 |
| As at December 31, 2021 | Agriculture, Forestry and fishing | Manufacturing | Tourism | Transportation and storage | Construction | Infrastructure development | Wholesale and retail trade | Information technology and communication services | Financial services | Professional, scientific and technical activities | Arts, entertainment and recreation | Education | Healthcare, social services and support services | Consumption | Lending to overseas entities | Total | |
| Rs. ’000 | Rs. ’000 | Rs. ’000 | Rs. ’000 | Rs. ’000 | Rs. ’000 | Rs. ’000 | Rs. ’000 | Rs. ’000 | Rs. ’000 | Rs. ’000 | Rs. ’000 | Rs. ’000 | Rs. ’000 | Rs. ’000 | Rs. ’000 | ||
| Financial assets | |||||||||||||||||
| Cash and cash equivalents | – | – | – | – | – | – | – | – | 68,078,076 | – | – | – | – | – | – | 68,078,076 | |
| Balances with central banks | – | – | – | – | – | – | – | – | 52,897,908 | – | – | – | – | – | – | 52,897,908 | |
| Placements with banks | – | – | – | – | – | – | – | – | 11,584,952 | – | – | – | – | – | – | 11,584,952 | |
| Securities purchased under resale agreements | – | – | – | – | – | – | – | – | 3,000,490 | – | – | – | – | – | – | 3,000,490 | |
| Derivative financial assets | – | – | – | – | – | – | 60 | 9,449 | 3,235,611 | – | – | – | – | – | – | 3,245,120 | |
| Financial assets measured at FVTPL | – | 254,076 | 28,698 | – | 19,470 | – | 100,403 | 15,974 | 22,980,249 | – | – | – | 37,253 | – | – | 23,436,123 | |
| Government securities | – | – | – | – | – | – | – | – | 21,839,251 | – | – | – | – | – | – | 21,839,251 | |
| Quoted equity securities | – | 254,076 | 28,698 | – | 19,470 | – | 100,403 | 15,974 | 1,140,998 | – | – | – | 37,253 | – | – | 1,596,872 | |
| Financial assets at AC – Loans and advances to other customers (*) | 86,950,254 | 136,875,888 | 58,820,254 | 18,898,846 | 47,015,068 | 25,140,149 | 204,100,922 | 14,613,393 | 70,267,313 | 26,226,776 | 1,054,749 | 3,876,141 | 23,181,624 | 161,683,553 | 135,913,650 | 1,014,618,580 | |
| Financial assets at AC – Debt and other financial instruments | – | 5,332,910 | – | – | – | – | 80,280 | – | 364,004,699 | – | – | – | – | – | – | 369,417,889 | |
| Government securities | – | – | – | – | – | – | – | – | 362,738,130 | – | – | – | – | – | – | 362,738,130 | |
| Other investments | – | 5,332,910 | – | – | – | – | 80,280 | – | 1,266,569 | – | – | – | – | – | – | 6,679,759 | |
| Financial assets measured at FVOCI | – | 22,712 | – | – | 373,634 | – | – | – | 335,058,372 | 8,620 | – | – | – | – | – | 335,463,338 | |
| Government securities | – | – | – | – | – | – | – | – | 335,013,606 | – | – | – | – | – | – | 335,013,606 | |
| Equity securities | – | 22,712 | – | – | 373,634 | – | – | – | 44,766 | 8,620 | – | – | – | – | – | 449,732 | |
| Total | 86,950,254 | 142,485,586 | 58,848,952 | 18,898,846 | 47,408,172 | 25,140,149 | 204,281,665 | 14,638,816 | 931,107,670 | 26,235,396 | 1,054,749 | 3,876,141 | 23,218,877 | 161,683,553 | 135,913,650 | 1,881,742,476 |
(*) Loans and advances to other customers referred above do not agree with the Note 33.1 (c) due to impairment provisions.
66.1.5 (b) Geographical distribution of loans and advances
The Western Province has recorded a higher percentage of lending based on geographical distribution of the Bank’s lending portfolio. It has accounted for 79% (approximately) of total advances portfolio of the Bank (excluding Bangladesh operations) as at December 31, 2022. Although, Western Province is attracted with highest credit concentration, we believe that a sizable portion of these lending has been utilised to facilitate industries scattered around the country. For example, most of the large corporates which have island-wide operations are being accommodated by the Bank's branches and corporate banking division located in the Western Province thereby reflecting a fairly diversified geographical concentration as given below.
| Country/province | Loans and advances by product | |||||||||||
| As at December 31, 2022 | Overdrafts Rs. ’000 |
Trade finance Rs. ’000 |
Lease receivables Rs. ’000 |
Credit cards Rs. ’000 |
Pawning Rs. ’000 |
Staff loans Rs. ’000 |
Housing loans Rs. ’000 |
Personal loans Rs. ’000 |
Long–term loans Rs. ’000 |
Short–term loans Rs. ’000 |
Bills of exchange Rs. ’000 |
Total Rs. ’000 |
| Sri Lanka | ||||||||||||
| Central | 9,214,248 | 241,010 | 1,485,765 | 776,942 | 765,533 | 7,271 | 4,268,379 | 2,391,002 | 21,211,080 | 2,925,154 | 62,187 | 43,348,571 |
| Eastern | 816,917 | 4,331 | 1,074,882 | 194,497 | 632,419 | 2,791 | 864,460 | 1,248,254 | 3,752,284 | 260,087 | – | 8,850,922 |
| North Central | 556,957 | 22,282 | 1,499,504 | 191,049 | 291,304 | 676 | 854,497 | 1,849,881 | 7,455,612 | 135,424 | 23,670 | 12,880,856 |
| Northern | 5,165,602 | 440,196 | 2,498,611 | 664,031 | 1,232,241 | 3,664 | 3,997,158 | 3,068,122 | 13,875,331 | 2,554,660 | 7,688 | 33,507,304 |
| North Western | 2,636,468 | 31,979 | 2,241,198 | 242,931 | 5,178,565 | 4,200 | 1,312,562 | 1,734,575 | 6,636,431 | 356,298 | – | 20,375,207 |
| Sabaragamuwa | 4,387,024 | 365,634 | 2,180,345 | 428,457 | 482,501 | 6,433 | 3,224,079 | 1,703,202 | 12,088,788 | 1,343,088 | – | 26,209,551 |
| Southern | 5,018,670 | 2,981,356 | 2,655,293 | 757,217 | 1,565,460 | 8,977 | 5,661,247 | 3,645,571 | 16,597,312 | 3,829,671 | – | 42,720,774 |
| Uva | 784,139 | – | 880,251 | 199,390 | 175,596 | 1,145 | 1,820,026 | 983,583 | 5,849,216 | 241,658 | – | 10,935,004 |
| Western | 84,014,118 | 94,776,470 | 15,358,227 | 12,423,195 | 6,026,322 | 13,060,112 | 49,737,425 | 23,470,654 | 322,792,502 | 114,300,412 | 8,522,213 | 744,481,650 |
| Bangladesh | 19,722,269 | 10,682,117 | 2,029,750 | 318,428 | – | 527,586 | 2,326,431 | 853,814 | 25,575,627 | 102,359,400 | 22,737,318 | 187,132,740 |
| Net Loans and advances | 132,316,412 | 109,545,375 | 31,903,826 | 16,196,137 | 16,349,941 | 13,622,855 | 74,066,264 | 40,948,658 | 435,834,183 | 228,305,852 | 31,353,076 | 1,130,442,579 |
| Country/province | Loans and advances by product | |||||||||||
| As at December 31, 2021 | Overdrafts Rs. ’000 |
Trade
finance Rs. ’000 |
Lease
receivables Rs. ’000 |
Credit
cards Rs. ’000 |
Pawning Rs. ’000 |
Staff
loans Rs. ’000 |
Housing
loans Rs. ’000 |
Personal
loans Rs. ’000 |
Long–term
loans Rs. ’000 |
Short–term
loans Rs. ’000 |
Bills of
exchange Rs. ’000 |
Total Rs. ’000 |
| Sri Lanka | ||||||||||||
| Central | 9,014,862 | 243,021 | 1,648,083 | 750,949 | 284,385 | 5,357 | 4,154,739 | 2,795,812 | 21,230,413 | 1,928,065 | 68,999 | 42,124,685 |
| Eastern | 667,814 | 207,635 | 1,101,555 | 201,439 | 200,954 | 925 | 681,411 | 1,510,663 | 3,737,455 | 213,758 | – | 8,523,609 |
| North Central | 609,540 | 28,950 | 1,538,530 | 185,745 | 110,745 | 338 | 794,010 | 2,144,945 | 7,807,070 | 71,131 | – | 13,291,004 |
| Northern | 5,164,010 | 857,905 | 3,051,813 | 679,061 | 554,276 | 1,062 | 4,103,385 | 3,768,105 | 15,587,606 | 2,429,403 | 22,931 | 36,219,557 |
| North Western | 3,027,071 | 60,218 | 2,592,115 | 253,019 | 2,999,299 | 805 | 1,430,074 | 2,099,549 | 7,239,490 | 406,959 | – | 20,108,599 |
| Sabaragamuwa | 4,434,705 | 774,729 | 2,471,244 | 450,378 | 222,499 | 4,244 | 3,105,764 | 2,031,204 | 12,927,466 | 838,274 | – | 27,260,507 |
| Southern | 5,384,533 | 2,074,018 | 3,114,127 | 751,968 | 738,866 | 5,776 | 6,013,836 | 4,399,526 | 18,308,545 | 1,050,384 | – | 41,841,579 |
| Uva | 941,639 | – | 1,051,816 | 213,792 | 67,510 | 82 | 1,867,459 | 1,187,999 | 6,180,691 | 225,885 | – | 11,736,873 |
| Western | 66,606,158 | 80,326,737 | 18,249,874 | 11,493,752 | 2,415,464 | 12,812,122 | 49,272,824 | 28,448,277 | 290,258,900 | 112,482,160 | 5,248,661 | 677,614,929 |
| Bangladesh | 11,520,550 | 5,227,974 | 1,194,708 | 176,147 | – | 235,392 | 1,343,045 | 619,047 | 15,690,846 | 58,378,032 | 41,511,497 | 135,897,238 |
| Net Loans and advances | 107,370,882 | 89,801,187 | 36,013,865 | 15,156,250 | 7,593,998 | 13,066,103 | 72,766,547 | 49,005,127 | 398,968,482 | 178,024,051 | 46,852,088 | 1,014,618,580 |
Please refer Note 33 for the gross carrying amount of the loans and advances to other customers.
66.2 Liquidity risk
Liquidity risk arises because of the possibility that the Bank might not be able to meet On or Off-balance sheet contractual financial obligations on its payments or not receiving what is due to the Bank when they fall due, without incurring unacceptable losses. The principal objective in liquidity risk management is to assess the need for funds to meet such obligations, make sure receipt of funds when they are due and to ensure the availability of adequate funding to fulfill those needs at the appropriate time, under both normal and stressed conditions.
Therefore, the Bank continuously analyses and monitors its liquidity profile, maintains adequate levels of high quality liquid assets, ensures access to diverse funding sources and has contingency funding agreements with peer banks to meet any unforeseen liquidity requirements. Exposures, and ratios against tolerance
limits as well as stressed scenarios are regularly monitored in order to identify the Bank’s liquidity position and potential funding requirements.
Assets and Liability Management Committee (ALCO)
ALCO chaired by the Managing Director, has representatives from Treasury, Corporate Banking, Personal Banking, Risk and Finance Departments. The Committee meets fortnightly or more frequently to monitor and manage the assets and liabilities of the Bank and also the overall liquidity position to keep the Bank‘s liquidity at healthy levels, whilst satisfying the regulatory requirements.
66.2.1 Exposure to liquidity risk
The Bank uses the key ratios given below for managing liquidity risk:
| Minimum Requirement | |||||
| 2022 % |
2021 % |
2022 % |
2021 % |
||
| Liquid Assets Ratio (LAR) | |||||
| LAR calculates the percentage of liquid assets to total liabilities excluding shareholders’ funds. For this purpose, “liquid assets” include cash and cash equivalents, Placements with banks and Government Securities (net). | Domestic Banking Unit | 20.00 | 20.00 | 35.01 | 38.73 |
| Off shore Banking Centre | 20.00 | 20.00 | 32.37 | 36.39 | |
| Consolidated (Sri Lankan Operation) |
20.00 | N/A | 35.88 | N/A | |
| Liquidity Coverage Ratio (LCR)* | |||||
| This ratio determines the ability of the Bank to withstand adverse shocks (i.e. sudden withdrawal of a significant portion of deposits) by holding high quality liquid assets in a 30 day time span. | Rupee Liquidity Requirement | 90.00 | 100.00 | 405.91 | 425.97 |
| All-Currency Liquidity Requirement | 90.00 | 100.00 | 293.91 | 242.52 | |
| Net Stable Funding Ratio (NSFR)* | |||||
| This ratio measures the availability of Stable Funds against the Required Funds of the Bank. NSFR, requires banks to maintain a stable funding profile by creating additional incentives to fund their activities with more stable sources of funding on an ongoing basis, over a longer time horizon. | 90.00 | 100.00 | 173.58 | 157.47 | |
*Details of LCR and NSFR are given in Disclosure 04 and 05 as per Basel III disclosures under Pillar III.
Details of the reported LAR of liquid assets to external liabilities of the Domestic Banking Unit (DBU) and the Off-shore Banking Centre (OBC)
as at reporting dates are as follows:
| Domestic Banking Unit | Off-shore Banking Centre | ||||
| 2022 % | 2021 % | 2022 % | 2021 % | ||
| As at December 31, | 35.01 | 38.73 | 32.37 | 36.39 | |
| Average for the period | 32.17 | 44.16 | 30.46 | 34.47 | |
| Maximum for the period | 39.68 | 47.38 | 34.49 | 38.28 | |
| Minimum for the period | 25.37 | 38.73 | 26.15 | 32.79 | |
| Statutory minimum requirement | 20.00 | 20.00 | 20.00 | 20.00 | |
The graph below depicts the trends in liquidity ratios of the Bank calculated on a quarterly basis during the period from December 2019 to December 2022:
[[Graph]]
66.2.2 Maturity analysis of financial assets and financial liabilities
66.2.2 (a) Remaining contractual period to maturity – Bank
(i) Remaining contractual period to maturity of the assets employed by the Bank as at the date of Statement of Financial Position,
is detailed below:
| As at December 31, | Up to 3 months | 3 to 12 months | 1 to 3 years | 3 to 5 years | More than 5 years | Total as at December 31, 2022 | Total as at December 31, 2021 |
| Rs. ’000 | Rs.’000 | Rs. ’000 | Rs. ’000 | Rs. ’000 | Rs. ’000 | Rs. ’000 | |
| Interest earning financial assets: | |||||||
| Cash and cash equivalents | 16,544,051 | – | – | – | – | 16,544,051 | 13,442,860 |
| Balances with central banks | 2,885,093 | – | – | – | – | 2,885,093 | 13,610,417 |
| Placements with banks | 74,515,587 | – | – | – | – | 74,515,587 | 11,584,952 |
| Securities purchased under resale agreements | 1,517,308 | – | – | – | – | 1,517,308 | 3,000,490 |
| Financial assets measured at FVTPL | 22,848,251 | – | – | – | – | 22,848,251 | 21,839,251 |
| Financial assets at amortised cost – Loans and advances to other customers | 475,157,631 | 262,608,426 | 225,145,894 | 109,783,984 | 57,746,644 | 1,130,442,579 | 1,014,618,580 |
| Financial assets at amortised cost – Debt and other financial instruments |
89,547,952 | 94,485,925 | 297,267,724 | 150,916,604 | 93,717,094 | 725,935,299 | 369,417,889 |
| Financial assets measured at FVOCI | 80,088,485 | 33,978,444 | 1,819,164 | 500,156 | 454,058 | 116,840,307 | 335,013,606 |
| Total interest earning assets as at December 31, 2022 | 763,104,358 | 391,072,795 | 524,232,782 | 261,200,744 | 151,917,796 | 2,091,528,475 | |
| Total Interest earning assets as at December 31, 2021 | 504,672,889 | 360,995,456 | 490,958,838 | 239,453,192 | 186,447,670 | 1,782,528,045 | |
| Non-interest earning financial assets: | |||||||
| Cash and cash equivalents | 132,849,560 | – | – | – | – | 132,849,560 | 54,635,216 |
| Balances with Central Banks | 37,405,931 | 23,122,503 | 1,870,905 | 1,209,067 | – | 63,608,406 | 39,287,491 |
| Placements with banks | 8,540,099 | 12,843,959 | – | – | – | 21,384,058 | – |
| Derivative financial assets | 1,725,935 | 187,116 | – | 6,432,040 | – | 8,345,091 | 3,245,120 |
| Financial assets measured at FVTPL | 2,024,806 | – | – | – | – | 2,024,806 | 1,596,872 |
| Financial assets measured at FVOCI | 150,566 | – | – | 65,367 | – | 215,933 | 449,732 |
| Non-financial assets | |||||||
| Investments in subsidiaries | – | – | – | – | 5,808,429 | 5,808,429 | 5,808,429 |
| Investment in associate | – | – | – | – | 44,331 | 44,331 | 44,331 |
| Property, plant and equipment and right-of-use assets | – | – | – | – | 25,425,452 | 25,425,452 | 23,075,467 |
| Intangible assets | – | – | – | – | 3,563,120 | 3,563,120 | 1,724,864 |
| Deferred tax assets | – | – | 30,301,203 | – | – | 30,301,203 | 9,793,129 |
| Other assets | 32,181,529 | 1,070,568 | 895,910 | 832,908 | 5,718,253 | 40,699,168 | 27,024,475 |
| Total Non-interest earning assets as at December 31, 2022 |
214,848,426 | 37,224,146 | 33,068,018 | 8,539,382 | 40,559,585 | 334,269,557 | |
| Total Non-interest earning assets as at December 31, 2021 | 102,832,820 | 15,641,434 | 12,185,431 | 1,067,926 | 34,957,515 | 166,685,126 | |
| Total assets – As at December 31, 2022 | 977,982,789 | 428,296,941 | 557,300,800 | 269,740,126 | 192,477,381 | 2,425,798,032 | |
| Total assets – As at December 31, 2021 | 607,505,709 | 376,636,890 | 503,144,269 | 240,521,118 | 221,405,185 | 1,949,213,171 | |
| Percentage – As at December 31, 2022 (*) | 40.32 | 17.66 | 22.97 | 11.12 | 7.93 | 100.00 | |
| Percentage – As at December 31, 2021 (*) | 31.17 | 19.32 | 25.81 | 12.34 | 11.36 | 100.00 |
(*) Total assets of each maturity bucket as a percentage of total assets employed by the Bank.
(ii) Remaining contractual period to maturity of the liabilities and share holders' funds employed by the bank as at the date of Statement of Financial Position is detailed below :
| As at December 31, | Up to 3 months | 3 to 12 months | 1 to 3 years | 3 to 5 years | More than 5 years | Total as at December 31, 2022 | Total as at December 31, 2021 |
| Rs. ’000 | Rs. ’000 | Rs. ’000 | Rs. ’000 | Rs. ’000 | Rs. ’000 | Rs. ’000 | |
| Interest-bearing financial liabilities: | |||||||
| Due to banks | 18,223,393 | 8,946,851 | 2,186,883 | 9,175,000 | 8,156,576 | 46,688,703 | 66,930,131 |
| Securities sold under repurchase agreements | 71,828,324 | 25,819,323 | 78,788 | – | – | 97,726,435 | 151,911,842 |
| Financial liabilities at amortised cost – Due to depositors | 933,851,422 | 695,895,201 | 56,306,773 | 36,388,091 | – | 1,722,441,487 | 1,302,312,599 |
| Financial liabilities at amortised cost – Other borrowings | 7,037,987 | 4,581,753 | 703,600 | 1,393,582 | 2,433,434 | 16,150,356 | 32,587,051 |
| Subordinated liabilities | 28,934,544 | 8,587,502 | – | 14,639,440 | 9,239,481 | 61,400,967 | 38,303,466 |
| Total interest-bearing liabilities as at December 31, 2022 |
1,059,875,670 | 743,830,630 | 59,276,044 | 61,596,113 | 19,829,491 | 1,944,407,948 | |
| Total Interest-bearing liabilities as at December 31, 2021 |
1,003,811,825 | 492,974,049 | 57,262,530 | 22,051,108 | 15,945,577 | 1,592,045,089 | |
| Non-interest bearing financial liabilities: | |||||||
| Due to banks | 18,441,358 | – | – | – | – | 18,441,358 | 6,847,289 |
| Derivative financial liabilities | 2,535,879 | 76,692 | 268,096 | – | – | 2,880,667 | 2,092,198 |
| Financial liabilities at amortised cost – Due to depositors | 191,918,007 | – | – | – | – | 191,918,007 | 140,780,854 |
| Non-financial liabilities | |||||||
| Current tax liabilities | 6,118,830 | 18,356,489 | – | – | – | 24,475,319 | 9,294,180 |
| Other liabilities | 20,651,251 | 10,263,179 | 3,804,006 | 2,820,765 | 2,321,372 | 39,860,573 | 33,210,883 |
| Due to subsidiaries | 115,484 | – | – | – | – | 115,484 | 48,699 |
| Equity | |||||||
| Stated capital | – | – | – | – | 58,149,621 | 58,149,621 | 54,566,957 |
| Statutory reserves | – | – | – | – | 11,352,858 | 11,352,858 | 10,204,368 |
| Retained earnings | – | – | – | – | 5,592,121 | 5,592,121 | 9,028,265 |
| Other reserves | – | – | – | – | 128,604,076 | 128,604,076 | 91,094,389 |
| Total non-interest bearing liabilities and equity as at December 31, 2022 |
239,780,809 | 28,696,360 | 4,072,102 | 2,820,765 | 206,020,048 | 481,390,084 | |
| Total non-Interest bearing liabilities and equity as at December 31, 2021 |
165,568,231 | 18,603,946 | 3,170,511 | 1,884,869 | 167,940,525 | 357,168,082 | |
| Total liabilities and equity – as at December 31, 2022 |
1,299,656,479 | 772,526,990 | 63,348,146 | 64,416,878 | 225,849,539 | 2,425,798,032 | |
| Total liabilities and equity – as at December 31, 2021 |
1,169,380,056 | 511,577,995 | 60,433,041 | 23,935,977 | 183,886,102 | 1,949,213,171 | |
| Percentage – as at December 31, 2022 (*) | 53.57 | 31.85 | 2.61 | 2.66 | 9.31 | 100.00 | |
| Percentage – as at December 31, 2021 (*) | 59.99 | 26.25 | 3.10 | 1.23 | 9.43 | 100.00 |
(*) Total liabilities and equity of each maturity bucket as a percentage of total liabilities and equity employed by the Bank.
66.2.2 (b) Non-derivative financial assets and financial liabilities expected to be recovered or settled after 12 months from the reporting date
The table below sets out the carrying amounts of non-derivative financial assets and financial liabilities expected to be recovered or settled after 12 months from the reporting date:
| As at December 31, | 2022 | 2021 |
| Rs. ’000 | Rs. ’000 | |
| Financial assets | ||
| Non-derivative financial assets | ||
| Balances with Central Banks | 3,079,972 | 875,631 |
| Financial assets at amortised cost – Loans and advances to other customers | 392,676,522 | 388,351,016 |
| Financial assets at amortised cost – Debt and other financial instruments | 541,901,422 | 309,346,829 |
| Financial assets measured at fair value through other comprehensive income | 2,838,745 | 219,611,587 |
| Total | 940,496,661 | 918,185,063 |
| Financial liabilities | ||
| Non-derivative financial liabilities | ||
| Securities sold under repurchase agreements | 78,788 | 53,735 |
| Financial liabilities at amortised cost – Due to depositors | 92,694,864 | 32,163,388 |
| Financial liabilities at amortised cost – Other borrowings | 4,530,616 | 12,129,375 |
| Subordinated liabilities | 23,878,921 | 37,269,708 |
| Total | 121,183,189 | 81,616,206 |
66.2.2 (c) Undiscounted cash flow of financial assets and financial liabilities – Bank
The following table shows the expected undiscounted cash flows for financial assets and financial liabilities as at December 31, 2022:
| As at December 31, 2022 | Up to 3 months | 3 to 12 months | 1 to 3 years | 3 to 5 years | More than 5 years | Total |
| Rs. ’000 | Rs. ’000 | Rs. ’000 | Rs. ’000 | Rs. ’000 | Rs. ’000 | |
| Financial assets | ||||||
| Cash and cash equivalents | 149,408,164 | – | – | – | – | 149,408,164 |
| Balances with Central Banks | 40,291,031 | 23,122,503 | 1,870,905 | 1,209,067 | – | 66,493,506 |
| Placements with banks | 83,306,886 | 12,843,959 | – | – | – | 96,150,845 |
| Securities purchased under resale agreements | 1,526,897 | – | – | – | – | 1,526,897 |
| Derivative financial assets | 1,725,935 | 187,116 | – | 6,432,040 | – | 8,345,091 |
| Financial assets recognised through profit or loss – measured at fair value |
19,538,799 | 3,917,471 | 1,952,700 | 494,250 | – | 25,903,220 |
| Financial assets at amortised cost – Loans and advances to other customers |
508,341,068 | 314,036,481 | 296,122,478 | 134,462,520 | 80,297,877 | 1,333,260,424 |
| Financial assets at amortised cost – Debt and other financial instruments |
69,795,202 | 145,582,423 | 433,042,928 | 189,033,833 | 128,656,964 | 966,111,350 |
| Financial assets measured at fair value through other comprehensive income |
82,755,377 | 39,675,232 | 2,076,080 | 561,250 | 723,424 | 125,791,363 |
| Total financial assets | 956,689,359 | 539,365,185 | 735,065,091 | 332,192,960 | 209,678,265 | 2,772,990,860 |
| Financial liabilities | ||||||
| Due to banks | 37,249,363 | 8,946,851 | 2,186,883 | 9,175,000 | 8,156,575 | 65,714,672 |
| Derivative financial liabilities | 2,535,879 | 76,692 | 268,096 | – | – | 2,880,667 |
| Securities sold under repurchase agreements | 73,880,742 | 29,228,507 | 90,479 | – | – | 103,199,728 |
| Financial liabilities at amortised cost – due to depositors | 1,149,550,386 | 749,765,309 | 68,799,168 | 62,074,803 | 5,293 | 2,030,194,959 |
| Financial liabilities at amortised cost – other borrowings | 7,125,093 | 4,827,826 | 969,151 | 2,309,224 | 3,237,045 | 18,468,339 |
| Subordinated liabilities | 29,428,488 | 12,489,469 | 8,362,139 | 22,095,051 | 13,002,303 | 85,377,450 |
| Total financial liabilities | 1,299,769,951 | 805,334,654 | 80,675,916 | 95,654,078 | 24,401,216 | 2,305,835,815 |
| As at December 31, 2021 | Up to 3 months | 3 to 12 months | 1 to 3 years | 3 to 5 years | More than 5 years | Total |
| Rs. ’000 | Rs. ’000 | Rs. ’000 | Rs. ’000 | Rs. ’000 | Rs. ’000 | |
| Financial assets | ||||||
| Cash and cash equivalents | 68,084,097 | – | – | – | – | 68,084,097 |
| Balances with central banks | 39,845,716 | 12,176,561 | 650,505 | 225,126 | – | 52,897,908 |
| Placements with banks | 11,858,941 | – | – | – | – | 11,858,941 |
| Securities purchased under resale agreements | 3,001,958 | – | – | – | – | 3,001,958 |
| Derivative financial assets | 2,034,514 | 881,313 | 18,251 | 311,042 | – | 3,245,120 |
| Financial assets recognised through profit or loss – measured at fair value |
9,432,990 | 7,692,577 | 6,477,941 | 1,298,100 | – | 24,901,608 |
| Financial assets at amortised cost – Loans and advances to other customers |
380,271,862 | 308,776,456 | 265,538,546 | 135,937,878 | 70,913,153 | 1,161,437,895 |
| Financial assets at amortised cost – Debt and other financial instruments |
10,980,792 | 73,994,663 | 164,561,016 | 112,112,000 | 113,091,597 | 474,740,068 |
| Financial assets measured at fair value through other comprehensive income |
38,476,785 | 50,257,331 | 238,394,534 | 58,563,653 | 46,580,770 | 432,273,073 |
| Total financial assets | 563,987,655 | 453,778,901 | 675,640,793 | 308,447,799 | 230,585,520 | 2,232,440,668 |
| Financial liabilities | ||||||
| Due to banks | 43,777,869 | 17,768,093 | 3,941,172 | 5,208,711 | 4,991,742 | 75,687,587 |
| Derivative financial liabilities | 1,353,381 | 609,502 | 129,315 | – | – | 2,092,198 |
| Securities sold under repurchase agreements | 133,583,242 | 21,834,887 | 58,018 | – | – | 155,476,147 |
| Financial liabilities at amortised cost – due to depositors | 969,548,468 | 459,867,397 | 26,171,456 | 9,775,158 | 2,373 | 1,465,364,852 |
| Financial liabilities at amortised cost – other borrowings | 12,881,064 | 7,942,884 | 6,576,688 | 1,928,203 | 5,777,219 | 35,106,058 |
| Subordinated liabilities | 1,092,420 | 2,213,429 | 27,621,931 | 10,661,138 | 7,190,216 | 48,779,134 |
| Total financial liabilities | 1,162,236,444 | 510,236,192 | 64,498,580 | 27,573,210 | 17,961,550 | 1,782,505,976 |
66.2.3 Liquidity reserves
The table below sets out the components of the Bank’s liquidity reserves:
| As at December 31, | 2022 | 2021 | ||
| Carrying amount | Fair value | Carrying amount | Fair value | |
| Rs. ’000 | Rs. ’000 | Rs. ’000 | Rs. ’000 | |
| Balances with central banks | 66,493,499 | 66,493,499 | 52,897,908 | 52,897,908 |
| Balances with other banks | 102,302,920 | 102,302,920 | 37,809,275 | 37,809,275 |
| Coins and notes held | 47,104,381 | 47,104,381 | 30,276,356 | 30,276,356 |
| Unencumbered debt securities issued by sovereigns | 779,714,693 | 530,845,608 | 580,345,153 | 498,220,592 |
| Total | 995,615,493 | 746,746,408 | 701,328,692 | 619,204,131 |
66.2.4 Financial assets available to support future funding
The table below sets out the availability of the Bank’s financial assets to support future funding.
| As at December 31, 2022 | Encumbered | Unencumbered | ||||
| Pledged as collateral | Other | Available as collateral | Other | Total | ||
| Note | Rs. ’000 | Rs. ’000 | Rs. ’000 | Rs. ’000 | Rs. ’000 | |
| Cash and cash equivalents | 28 | – | – | 149,393,611 | – | 149,393,611 |
| Balances with central banks | 29 | – | 35,308,373 | 31,185,126 | – | 66,493,499 |
| Placements with banks | 30 | – | – | 95,899,645 | – | 95,899,645 |
| Securities purchased under resale agreements | – | – | 1,517,308 | – | 1,517,308 | |
| Derivative financial assets | 31 | – | – | 8,345,091 | – | 8,345,091 |
| Financial assets recognised through profit or loss – measured at fair value | 32 | – | – | 24,873,057 | – | 24,873,057 |
| Financial assets at amortised cost – Loans and advances to other customers |
33 | – | – | 1,130,442,579 | – | 1,130,442,579 |
| Financial assets at amortised cost – Debt and other financial instruments (*) |
34 | 102,244,891 | – | 623,690,408 | – | 725,935,299 |
| Financial assets measured at fair value through other comprehensive income (*) | 35 | 9,884,631 | – | 107,171,609 | – | 117,056,240 |
| Total | 112,129,522 | 35,308,373 | 2,172,518,434 | – | 2,319,956,329 | |
| As at December 31, 2021 | Encumbered | Unencumbered | ||||
| Pledged ascollateral | Other | Available as collateral | Other | Total | ||
| Note | Rs. ’000 | Rs. ’000 | Rs. ’000 | Rs. ’000 | Rs. ’000 | |
| Cash and cash equivalents | 28 | – | – | 68,078,076 | – | 68,078,076 |
| Balances with central banks | 29 | – | 32,559,843 | 20,338,065 | – | 52,897,908 |
| Placements with banks | 30 | – | – | 11,584,952 | – | 11,584,952 |
| Securities purchased under resale agreements | – | – | 3,000,490 | – | 3,000,490 | |
| Derivative financial assets | 31 | – | – | 3,245,120 | – | 3,245,120 |
| Financial assets recognised through profit or loss – measured at fair value | 32 | – | – | 23,436,123 | – | 23,436,123 |
| Financial assets at amortised cost – Loans and advances to other customers | 33 | – | – | 1,014,618,580 | – | 1,014,618,580 |
| Financial assets at amortised cost – Debt and other financial instruments |
34 | – | – | 369,417,889 | – | 369,417,889 |
| Financial assets measured at fair value through other comprehensive income (*) | 35 | 170,890,589 | – | 164,572,749 | – | 335,463,338 |
| Total | 170,890,589 | 32,559,843 | 1,678,292,044 | – | 1,881,742,476 | |
(*) Market value of securities pledged as collateral is considered as encumbered.
66.3 Market risk
Market risk is the risk of losses on or off-balance sheet positions arising out of movements in prices affecting foreign exchange exposures, interest rate instruments, equity/debt instruments and commodity exposures. The Bank monitors market risk in both trading and non-trading portfolios on an ongoing basis.
66.3.1 Exposure to market risk - Trading and non-trading portfolio
The table below sets out the allocation of assets and liabilities subject to market risk between trading and non-trading portfolios:
| As at December 31, 2022 | Market risk measurement | |||
| Carrying amount | Trading portfolios | Non-trading portfolios | ||
| Note | Rs. ’000 | Rs. ’000 | Rs. ’000 | |
| Assets subject to market risk | ||||
| Cash and cash equivalents | 28 | 109,917,615 | – | 109,917,615 |
| Balances with central banks | 29 | 30,548,569 | – | 30,548,569 |
| Placements with banks | 30 | 95,899,645 | – | 95,899,645 |
| Securities purchased under resale agreements | 1,517,308 | – | 1,517,308 | |
| Derivative financial assets | 31 | 8,345,091 | 8,345,091 | – |
| Financial assets recognised through profit or loss – Measured at fair value | 32 | 24,873,057 | 24,873,057 | – |
| Financial assets at amortised cost – Loans and advances to other customers | 33 | 1,130,442,579 | – | 1,130,442,579 |
| Financial assets at amortised cost – Debt and other financial instruments | 34 | 725,935,299 | – | 725,935,299 |
| Financial assets measured at fair value through other comprehensive income | 35 | 117,056,240 | – | 117,056,240 |
| Total | 2,244,535,403 | 33,218,148 | 2,211,317,255 | |
| Liabilities subject to market risk | ||||
| Due to banks | 43 | 65,130,061 | – | 65,130,061 |
| Derivative financial liabilities | 44 | 2,880,667 | 2,880,667 | – |
| Securities sold under repurchase agreements | 97,726,435 | – | 97,726,435 | |
| Financial liabilities at amortised cost – Due to depositors | 45 | 1,828,161,718 | – | 1,828,161,718 |
| Financial liabilities at amortised cost – Other borrowings | 46 | 16,150,356 | – | 16,150,356 |
| Subordinated liabilities | 50 | 61,400,967 | – | 61,400,967 |
| Total | 2,071,450,204 | 2,880,667 | 2,068,569,537 | |
| As at December 31, 2021 | Market risk measurement | |||
| Carrying amount | Trading portfolios | Non-trading portfolios | ||
| Note | Rs. ’000 | Rs. ’000 | Rs. ’000 | |
| Assets subject to market risk | ||||
| Cash and cash equivalents | 28 | 40,754,559 | – | 40,754,559 |
| Balances with central banks | 29 | 19,504,371 | – | 19,504,371 |
| Placements with banks | 30 | 11,584,952 | – | 11,584,952 |
| Securities purchased under resale agreements | 3,000,490 | – | 3,000,490 | |
| Derivative financial assets | 31 | 3,245,120 | 3,245,120 | – |
| Financial assets recognised through profit or loss – Measured at fair value | 32 | 23,436,123 | 23,436,123 | – |
| Financial assets at amortised cost – Loans and advances to other customers | 33 | 1,014,618,580 | – | 1,014,618,580 |
| Financial assets at amortised cost – Debt and other financial instruments | 34 | 369,417,889 | – | 369,417,889 |
| Financial assets measured at fair value through other comprehensive income | 35 | 335,463,338 | – | 335,463,338 |
| Total | 1,821,025,422 | 26,681,243 | 1,794,344,179 | |
| Liabilities subject to market risk | ||||
| Due to banks | 43 | 73,777,420 | – | 73,777,420 |
| Derivative financial liabilities | 44 | 2,092,198 | 2,092,198 | |
| Securities sold under repurchase agreements | 151,911,842 | – | 151,911,842 | |
| Financial liabilities at amortised cost – Due to depositors | 45 | 1,381,652,340 | – | 1,381,652,340 |
| Financial liabilities at amortised cost – Other borrowings | 46 | 32,587,051 | – | 32,587,051 |
| Subordinated liabilities | 50 | 38,303,466 | – | 38,303,466 |
| Total | 1,680,324,317 | 2,092,198 | 1,678,232,119 | |
66.3.2 Exposure to interest rate risk – Sensitivity analysis
66.3.2 (a) Exposure to interest rate risk – Non-trading portfolio
The possibility that changes in interest rates will affect future cash flows or the fair values of financial instruments and hence expose the Bank to fluctuations of Net Interest Income (NII) give rise to interest rate risk. The Bank’s policy is to continuously monitor portfolios and adopt hedging strategies to ensure that interest rate risk is maintained within prudent levels.
The table below analyse the Bank’s interest rate risk exposure on financial assets and financial liabilities. The Bank’s assets and liabilities are included at carrying amounts and categorised by the earlier of contractual re-pricing or maturity dates.
| As at December 31, 2022 | Up to 3 months | 3 to 12 months | 1 to 3 years | 3 to 5 years | More than 5 years | Non-sensitive | Total |
| Rs. ’000 | Rs. ’000 | Rs. ’000 | Rs. ’000 | Rs. ’000 | Rs. ’000 | Rs. ’000 | |
| Financial assets | |||||||
| Cash and cash equivalents | 16,544,051 | – | – | – | – | 132,849,560 | 149,393,611 |
| Balances with central banks | 2,885,093 | – | – | – | – | 63,608,406 | 66,493,499 |
| Placements with banks | 74,515,588 | – | – | – | – | 21,384,057 | 95,899,645 |
| Securities purchased under resale agreements | 1,517,308 | – | – | – | – | – | 1,517,308 |
| Financial assets at amortised cost – Loans and advances to other customers |
604,521,842 | 223,583,913 | 134,978,218 | 71,245,328 | 67,257,122 | 28,856,156 | 1,130,442,579 |
| Financial assets at amortised cost – Debt and other financial instruments |
89,547,952 | 94,485,926 | 297,267,724 | 150,916,603 | 93,717,094 | – | 725,935,299 |
| Financial assets measured at fair value through other comprehensive income | 80,088,485 | 33,978,444 | 1,819,164 | 500,156 | 454,058 | 215,933 | 117,056,240 |
| Total financial assets | 869,620,319 | 352,048,283 | 434,065,106 | 222,662,087 | 161,428,274 | 246,914,112 | 2,286,738,181 |
| Financial liabilities | |||||||
| Due to banks | 18,223,394 | 8,946,851 | 2,186,883 | 9,175,000 | 8,156,575 | 18,441,358 | 65,130,061 |
| Securities sold under repurchased agreements | 71,828,324 | 25,819,323 | 78,788 | – | – | – | 97,726,435 |
| Financial liabilities at amortised cost – Due to depositors |
933,851,422 | 695,895,201 | 56,306,773 | 36,388,091 | – | 191,918,007 | 1,914,359,494 |
| Financial liabilities at amortised cost – Other borrowings |
7,037,987 | 4,581,753 | 703,600 | 1,393,582 | 2,433,434 | – | 16,150,356 |
| Subordinated liabilities | 28,934,545 | 8,587,502 | – | 14,639,440 | 9,239,480 | – | 61,400,967 |
| Total financial liabilities | 1,059,875,672 | 743,830,630 | 59,276,044 | 61,596,113 | 19,829,489 | 210,359,365 | 2,154,767,313 |
| Interest rate sensitivity gap | (190,255,353) | (391,782,347) | 374,789,062 | 161,065,974 | 141,598,785 | 36,554,747 | 131,970,868 |
| Cumulative gap | (190,255,353) | (582,037,700) | (207,248,638) | (46,182,664) | 95,416,121 | 131,970,868 |
| As at December 31, 2021 | Up to 3 months | 3 to 12 months | 1 to 3 years | 3 to 5 years | More than 5 years | Non-sensitive | Total |
| Rs. ’000 | Rs. ’000 | Rs. ’000 | Rs. ’000 | Rs. ’000 | Rs. ’000 | Rs. ’000 | |
| Financial assets | |||||||
| Cash and cash equivalents | 13,442,860 | – | – | – | – | 54,635,216 | 68,078,076 |
| Balances with central banks | 13,610,416 | – | – | – | – | 39,287,492 | 52,897,908 |
| Placements with banks | 11,584,952 | – | – | – | – | – | 11,584,952 |
| Securities purchased under resale agreements | 3,000,490 | – | – | – | – | – | 3,000,490 |
| Financial assets at amortised cost – Loans and advances to other customers |
539,387,596 | 216,261,635 | 121,660,524 | 54,429,256 | 56,245,305 | 26,634,264 | 1,014,618,580 |
| Financial assets at amortised cost – Debt and other financial instruments |
3,482,239 | 56,588,821 | 131,508,480 | 81,657,967 | 96,180,382 | – | 369,417,889 |
| Financial assets measured at fair value through other comprehensive income | 69,031,895 | 31,161,778 | 148,971,616 | 45,484,693 | 40,363,624 | 449,732 | 335,463,338 |
| Total financial assets | 653,540,448 | 304,012,234 | 402,140,620 | 181,571,916 | 192,789,311 | 121,006,704 | 1,855,061,233 |
| As at December 31, 2021 | Up to 3 months | 3 to 12 months | 1 to 3 years | 3 to 5 years | More than 5 years | Non-sensitive | Total |
| Rs. ’000 | Rs. ’000 | Rs. ’000 | Rs. ’000 | Rs. ’000 | Rs. ’000 | Rs. ’000 | |
| Financial liabilities | |||||||
| Due to banks | 48,124,365 | 18,805,766 | – | – | – | 6,847,289 | 73,777,420 |
| Securities sold under repurchased agreements | 130,974,904 | 20,883,203 | 53,735 | – | – | – | 151,911,842 |
| Financial liabilities at amortised cost – Due to depositors |
798,029,025 | 450,329,584 | 24,850,880 | 15,818,972 | 13,284,138 | 140,780,854 | 1,443,093,453 |
| Financial liabilities at amortised cost – Other borrowings |
20,947,684 | 4,623,572 | 1,213,704 | 895,691 | 4,906,400 | – | 32,587,051 |
| Subordinated liabilities | 16,030,705 | – | 8,393,840 | 7,914,760 | 5,964,161 | – | 38,303,466 |
| Total financial liabilities | 1,014,106,683 | 494,642,125 | 34,512,159 | 24,629,423 | 24,154,699 | 147,628,143 | 1,739,673,232 |
| Interest rate sensitivity gap | (360,566,235) | (190,629,891) | 367,628,461 | 156,942,493 | 168,634,612 | (26,621,439) | 115,388,001 |
| Cumulative gap | (360,566,235) | (551,196,126) | (183,567,665) | (26,625,172) | 142,009,440 | 115,388,001 |
66.3.2 (b) Exposure to interest rate risk – Non-trading portfolio
The management of interest rate risk against interest rate gap limits is supplemented by monitoring the sensitivity of the Bank’s financial assets and financial liabilities to various interest rate scenarios. A fundamental reform of major interest rate benchmarks is being undertaken globally, replacing some Interbank Offered Rates (IBORs) with alternative nearly Risk Free Rates (RFRs). As at December 31, 2022, the Bank has a portfolio of financial assets and liabilities indexed to IBORs Some of these IBOR related indexes will either cease to be provided or no longer be representative after June 30, 2023, and the Bank has decided to shift to alternate reference rates, such as – Secured Overnight Financing Rate (SOFR), Sterling Overnight Index Average (SONIA), Euro Short Term Rate (ESTR) during the year 2023. Financial risk attached to the transition is limited to the interest rate risk and impact to the financial statements are insignificant based on the initial assessments carried out by the Bank.
Interest rate shocks
The following table demonstrates the sensitivity of the Bank’s Income Statement (net impact) due to change in interest rates by 100bps on rupee denominated assets and liabilities and 25bps on FCY denominated assets and liabilities with all other variables held constant as at the reporting date.
Sensitivity of projected net interest income
| 2022 | 2021 | |||
| Net Interest Income (NII) | Parallel increase | Parallel decrease | Parallel increase | Parallel decrease |
| Rs. ’000 | Rs. ’000 | Rs. ’000 | Rs. ’000 | |
| As at December 31, | 392,200 | (392,737) | 195,232 | (195,288) |
| Average for the period | 369,472 | (369,892) | 258,265 | (200,260) |
| Maximum for the period | 813,181 | (813,616) | 655,218 | (655,219) |
| Minimum for the period | 19,531 | (20,281) | (87,864) | 245,713 |
The impact of changes in interest rates on NII is measured applying interest rate shocks on static balance sheet. In line with the industry practices, interest rate shocks of 100 bps is applied on LKR denominated assets and liabilities and 25 bps is applied on FCY denominated assets and liabilities. The potential impact on the Bank’s profitability due to changes in rupee and foreign currency interest rates is evaluated to ensure that the volatilities are prudently managed within the internal tolerance limits.
[[Graph]]
66.3.3 Exposure to currency risk – Non-trading portfolio
Currency risk arises as a result of fluctuations in the value of a financial instrument due to changes in foreign exchange rates. The Bank has established limits on position by currency and these positions are monitored on a daily basis.
The table below indicates the currencies to which the Bank had significant exposures as at December 31, 2022 and December 31, 2021 and the exposure as a percentage of the total capital funds:
Foreign exchange position as at December 31, 2022
| Currency | Spot | Forward | Net open position | Net position in other exchange contracts | Overall exposure in respective foreign currency | Overall exposure in Rs. | ||||||
| Assets | Liabilities | Net | Assets | Liabilities | Net | |||||||
| 2 | 3 | 4=2-3 | 5 | 6 | 7=5-6 | 8 | 9 | 10=4+7+8 | 11 | |||
| ’000 | ’000 | ’000 | ’000 | ’000 | ’000 | ’000 | ’000 | ’000 | ’000 | |||
| United States Dollar | 15,334 | 11,101 | 4,233 | 76 | 3,084 | (3,008) | 9,815 | – | 11,040 | 4,051,506 | ||
| Great Britain Pound | 135 | 263 | (128) | 70 | – | 70 | 102 | – | 44 | 19,239 | ||
| Euro | 1,002 | 1,180 | (178) | – | – | – | 110 | – | (68) | (26,430) | ||
| Japanese Yen | 10,056 | 1,453 | 8,603 | – | 10,000 | (10,000) | 31,377 | – | 29,980 | 83,070 | ||
| Australian Dollar | 116 | 280 | (164) | – | – | – | 242 | – | 78 | 19,370 | ||
| Canadian Dollar | 31 | 284 | (253) | – | – | – | 249 | – | (4) | (1,070) | ||
| Other currencies in Usd | 263 | 1,097 | (834) | – | – | – | 1,719 | – | 885 | 324,698 | ||
| Total exposure | USD | 12,352 | USD | 12,181 | 4,470,383 | |||||||
| Total capital funds (capital base) as per the audited Basel III computation – Bank |
198,689,451 | |||||||||||
| Total exposure as a percentage of total capital funds (%) |
2.25 | |||||||||||
Foreign exchange position as at December 31, 2021
| Currency | Spot | Forward | Net open position | Net position in other exchange contracts | Overall exposure in respective foreign currency | Overall exposure in Rs. | ||||||
| Assets | Liabilities | Net | Assets | Liabilities | Net | |||||||
| 2 | 3 | 4=2-3 | 5 | 6 | 7=5-6 | 8 | 9 | 10=4+7+8 | 11 | |||
| ’000 | ’000 | ’000 | ’000 | ’000 | ’000 | ’000 | ’000 | ’000 | ’000 | |||
| United States Dollar | 11,424 | 30,554 | (19,130) | 20,320 | 544 | 19,776 | 11,464 | – | 12,110 | 2,421,949 | ||
| Great Britain Pound | 263 | 356 | (93) | 350 | 200 | 150 | (33) | – | 23 | 6,459 | ||
| Euro | 1,435 | 1,448 | (13) | – | – | – | (19) | – | (32) | (7,192) | ||
| Japanese Yen | 6,690 | 419 | 6,271 | – | 5,755 | (5,755) | (859) | – | (343) | (597) | ||
| Australian Dollar | 25 | 48 | (23) | 99 | – | 99 | (39) | – | 37 | 5,287 | ||
| Canadian Dollar | 19 | 38 | (19) | – | – | – | (48) | – | (67) | (10,439) | ||
| Other currencies in Usd | 213 | 194 | 19 | – | – | – | 188 | – | 206 | 41,259 | ||
| Total exposure | USD | 11,513 | USD | 12,284 | 2,456,726 | |||||||
| Total capital funds (capital base) as per the audited Basel III computation – Bank | 173,756,083 | |||||||||||
| Total exposure as a percentage of total capital funds (%) | 1.41 | |||||||||||
The Bank regularly carries out sensitivity analysis on Net Open Position (NOP) to assess the exposure to Foreign Exchange (FX) Risk due to possible changes in the USD/LKR exchange rate. An appropriate shock based on historical USD/LKR exchange rate is applied on the NOP which is measured against the Board approved threshold limits.
[[Graph]]
66.3.4 Exposure to equity price risk
Equity price risk arises as a result of any change in market prices and volatilities of individual equities. The Bank conducts mark-to-market calculations on a daily, quarterly and on a need basis to identify the impact due to changes in equity prices.
The table below summarises the impact (both to Income Statement and to equity) due to a change of 10% on equity prices.
| 2022 | 2021 | |||||
| Financial assets recognised through profit or loss Rs. ’000 |
Financial assets at fair value through other comprehensive income Rs. ’000 |
Total Rs. ’000 |
Financial assets
recognised
through profit
or loss Rs. ’000 |
Financial assets
at fair value
through other
comprehensive
income Rs. ’000 |
Total Rs. ’000 |
|
| Market value of equity securities as at December 31, |
2,024,806 | 150,566 | 2,175,372 | 1,596,872 | 396,346 | 1,993,218 |
| Stress Level | Impact on Income Statement | Impact on OCI | Impact on equity | Impact on Income Statement | Impact on OCI | Impact on equity |
| Shock of 10% on equity prices (upward) | 202,481 | 15,057 | 217,538 | 159,687 | 39,635 | 199,322 |
| Shock of 10% on equity prices (downward) | (202,481) | (15,057) | (217,538) | (159,687) | (39,635) | (199,322) |
66.4 Operational risk
Operational Risk arises due to inadequate or failed internal processes, people and systems or from external events. Operational Risk events which include legal and regulatory implications could lead to financial and reputational losses to the Bank.
The operational risk management framework of the Bank has been defined under the Board approved operational risk management policy. Operational risk is managed by establishing an appropriate internal control system that requires a mechanism for segregation of related responsibilities within the Bank, and a detailed testing and verification of the Bank's overall operational systems, and achieving a full harmony between internal and external systems and establishing a fully independent backup facility for business continuity planning.
66.5 Capital management and Pillar III disclosures as per Basel III
Objective
The Bank is required to manage its capital, taking into account the need to meet the regulatory requirements as well as the current and future business needs, stakeholder expectations and available options for raising capital.
66.5.1 Regulatory capital
Capital Adequacy Ratio (CAR) is calculated based on the CBSL directions stemming from Basel III accord. These guidelines require the Bank to maintain a CAR not less than 10.00% with minimum Tier 1 capital with buffers in relation to total risk weighted assets and a minimum total CAR with buffers of 14.00% in relation to total risk weighted assets.
| As at December 31, | 2022 | 2021 |
| Rs. ’000 | Rs. ’000 | |
| Common equity Tier 1 (CET1) capital after adjustments | 154,397,407 | 132,375,019 |
| Total common equity Tier 1 (CET1) capital | 191,849,110 | 147,698,440 |
| Equity capital (stated capital)/assigned capital | 58,149,621 | 54,566,955 |
| Reserve fund | 11,352,858 | 10,204,369 |
| Published retained earnings/(accumulated retained losses) | 4,755,271 | 3,654,269 |
| Published accumulated other comprehensive income (OCI) | 17,440,828 | (9,597,685) |
| General and other disclosed reserves | 100,150,532 | 88,870,532 |
| Unpublished current year’s profit/(losses) and gains reflected in OCI | – | – |
| Ordinary shares issued by consolidated banking and financial subsidiaries of the Bank and held by third parties | – | – |
| Total adjustments to CET1 capital | 37,451,703 | 15,323,421 |
| Goodwill (net) | – | – |
| Other intangible assets (net) | 3,563,120 | 1,724,864 |
| Revaluation losses of property, plant and equipment | – | – |
| Significant investments in the capital of financial institutions where the Bank owns more than 10% of the issued ordinary share capital of the entity | 3,587,383 | 3,805,427 |
| Deferred tax assets (net) | 30,301,200 | 9,793,130 |
| Additional Tier 1 (AT1) capital after adjustments | – | – |
| Total Additional Tier 1 (AT1) capital | – | – |
| Qualifying Additional Tier 1 capital instruments | – | – |
| Instruments issued by consolidated banking and financial subsidiaries of the Bank and held by third parties | – | – |
| Total adjustments to AT1 capital | – | – |
| Investment in own shares | – | – |
| Others (Specify) | – | – |
| Tier 2 capital after adjustments | 44,292,044 | 41,381,064 |
| Total Tier 2 capital | 44,292,044 | 41,381,064 |
| Qualifying Tier 2 capital instruments | 24,457,057 | 24,075,840 |
| Revaluation gains | 4,245,025 | 4,630,226 |
| General provisions/Eligible impairment | 15,589,962 | 12,674,998 |
| Instruments issued by consolidated banking and financial subsidiaries of the Bank and held by third parties | – | – |
| Total adjustments to Tier 2 capital | – | – |
| Investment in own shares | – | – |
| Others (specify) | – | – |
| CET1 capital | 154,397,407 | 132,375,019 |
| Total Tier 1 capital | 154,397,407 | 132,375,019 |
| Total capital | 198,689,451 | 173,756,083 |
66.5.2 Capital allocation
The Management monitors the capital adequacy ratio on a regular basis and ensure that it operates within the internal limit set by the Bank. The allocation of capital between specific operations and activities, to a large extent, driven by optimisation of return on the capital allocated. The amount of capital allocated to each operation or activity is based primarily on regulatory capital requirements, but in some cases the regulatory requirements do not fully reflect the varying degree of risks associated with different activities. In such cases, the capital requirements may be flexed to reflect differing risk profiles, subject to the overall level of capital to support a particular operation or activity not falling below the minimum required level by the regulator.
66.5.3 Pillar III disclosures as per Basel III
Disclosures under these requirements mainly include the regulatory capital requirements and liquidity, risk weighted assets, discussion on adequacy to meet current and future capital requirements of banks and linkages between financial statements and regulatory exposures. It is required to disclose the templates specified by the Central Bank of Sri Lanka as per Basel III – Minimum disclosure requirements with effective from July 01, 2017. Refer Annex 2.