
| 2012/13 Rs. mn |
2011/12 Rs. mn |
Change % |
2010/11 Rs. mn |
|||||
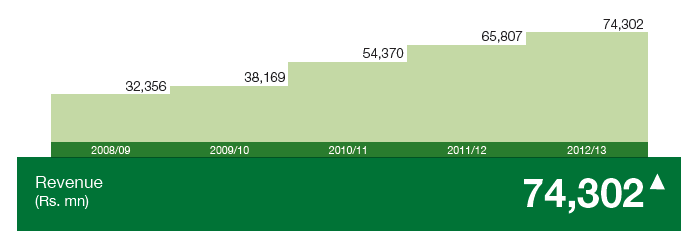
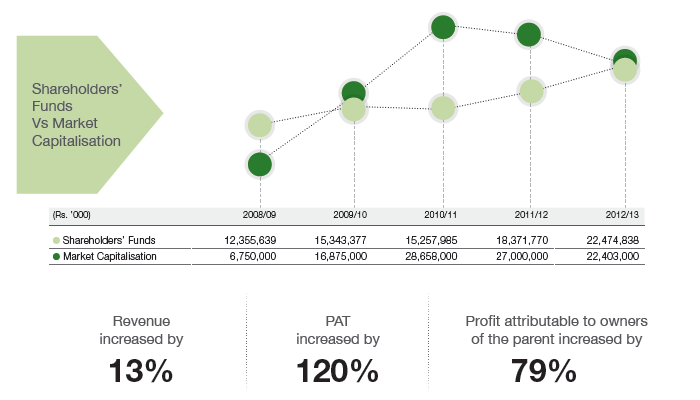
| Revenue | 74,302 | 65,807 | 13 | 54,370 | ||||
| Group Profit Before Tax | 5,025 | 2,561 | 96 | 2,041 | ||||
| Group Profit After Tax | 3,619 | 1,646 | 120 | 1,137 | ||||
| Profit Attributable to Owners of the Parent | 1,854 | 1,038 | 79 | 677 | ||||
| Dividends | 338 | 300 | 13 | 300 | ||||
| Shareholders’ Funds | 22,475 | 18,372 | 22 | 15,258 | ||||
| Company Market Capitalisation | 22,403 | 27,000 | (17) | 28,658 | ||||
| Group Market Capitalisation | 45,710 | 49,361 | (7) | 54,092 | ||||
| Group Investments | 5,364 | 5,171 | 3.7 | 918 | ||||
| Group Value Addition | 18,744 | 13,825 | 36 | 11,090 | ||||
| Revenue to Government | 3,144 | 2,601 | 21 | 1,523 | ||||
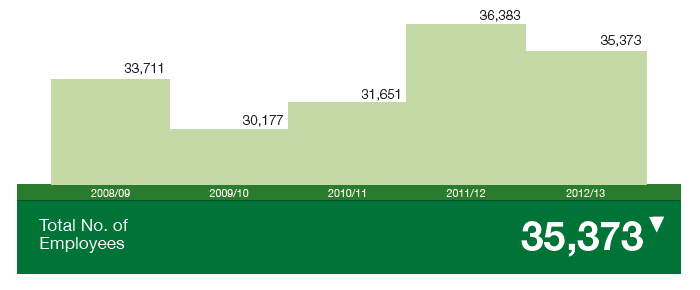
| Group Employment (Persons) | 35,373 | 36,383 | 9 | 31,651 | ||||
| Per Share | ||||||||
| Earnings (Basic) (Rs.) | 24.72 | 13.84 | 79 | 9.03 | ||||
| Market Value (Year-end) (Rs.) | 298.70 | 360.00 | (17) | 382.10 | ||||
| Net assets (Year-end) (Rs.) | 448.94 | 379.32 | 18 | 316.52 | ||||
| Dividend (Rs.) | 4.50 | 4.00 | 13 | 4.00 | ||||
| Price Earnings (Year-end) (Times) | 12.08 | 26.01 | (54) | 42.31 | ||||
| Ratio | ||||||||
| Gross Profit (%) | 23.0% | 20.3% | 20.8% | |||||
| Interest Cover (Times) | 2.2 | 1.9 | 2.5 | |||||
| Dividend Yield (%) | 1.5 | 1.1 | 1.0 | |||||
| Dividend Payout Ratio (%) | 18.2 | 28.9 | 44.3 | |||||
| Current Ratio (Times) | 1.0 | 1.0 | 1.1 |
Highlights