ANNEX 3: Risk Management Report
Prudent Growth Within A Defined Risk Appetite
Further to the Risk Review in the Strategic Report and the Managing Risk: An Overview in the chapter on Governance and Risk Management, this Risk Management Report details the risk management infrastructure, types of risk, risk management framework, and risk mitigation measures. Hence, it is recommended that this be read in conjunction with the Risk Review and the Managing Risk: An Overview write-ups referred to above.
The Board of Directors is responsible for overseeing the risk management function of the Bank. The Board carries out this responsibility directly by determining the desired risk profile of the Bank which is strongly correlated to achieving its strategic goals and indirectly by delegating oversight responsibility to the BIRMC which works closely with the executive level committees to review and assess the effectiveness of the risk management function and report to the Board on a regular basis. These reports provide a comprehensive perspective of the Bank’s risk management efforts and outcomes, enabling the Board to identify the risk exposures, any potential gaps and mitigating actions necessary, on a timely basis. The tone at the top and the corporate culture reinforced by the ethical leadership of the Board play a key role in managing risk at the Bank.
Besides the tone at the top and the three lines of defence, the Bank’s Code of Ethics sets out the Bank’s commitment and expectations of all the employees to undertaking business in a responsible, transparent and disciplined manner and demands honesty, integrity and accountability from all employees. As a financial services intermediary, importance of such behaviour cannot be overemphasised. Accordingly, ethical conduct of the business too plays a significant role in managing risk in the Bank.
Table - 36
Strategic goals and Risk Appetite Statement
| Aspect |
Measure |
Risk appetite
(%) |
2017
(%) |
2016
(%) |
| Returns |
ROA |
> 2 |
1.54 |
1.53 |
|
ROE |
>20 |
17.88 |
19.52 |
| Capital |
CAR |
|
|
|
|
CET 1 |
> 10 |
12.11 |
10.37 |
|
Total Capital |
> 14 |
15.75 |
14.87 |
| Liquidity |
SLAR |
> 22 |
27.28 |
27.41 |
| Asset quality downgrade |
Gross NPA |
4-5 |
1.88 |
2.18 |
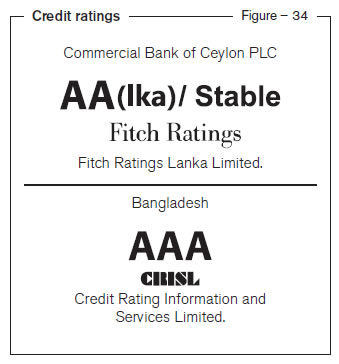
Credit ratings
The Bank’s ability to borrow is significantly dependent on its credit ratings which were as follows:
The rating of AA(lka) is the strongest rating given to a Sri Lankan non-state sector bank. The AAA (Triple A) long-term credit rating accorded to the Bangladesh operations of Commercial Bank of Ceylon PLC has been reaffirmed by CRISL for the 7th consecutive year and is the highest credit rating given to any financial institution in Bangladesh by CRISL. (Figure 34)
In addition to the deposits, the Bank uses low cost international borrowings as a source of funding taking in to consideration the Swap cost of converting such funds in to LKR.
However, such strategy is embedded with the risk of premium volatilities that could result fluctuating marking to market gains or losses.
Summary of key risks
The Bank tracks a number of risks it is exposed to on a day-to-day basis. They include conventional externally driven and internally generated risks as well as emerging risks. Besides the correlations of risks, the dynamic and volatile operating environment and the unprecedented pace of technological advancements have caused the likelihood of occurrence and the impact of risk events themselves to be volatile, making the risk management function highly challenging.
These risks and mitigatory measures taken are summarised below:

Risk management infrastructure
Risk management infrastructure which is an integral part of the Bank’s effective risk management framework encompasses both human and physical resources that enhance the Bank’s preparedness to identify and manage risk including policies and procedures, limits, tools, databases, competencies, communication etc.
The Bank has invested a significant amount of resources to build its risk management infrastructure and to maintain it up to date on an ongoing basis by embracing international best practices. This is as part of the overall risk management system in line with the Board-approved roadmap in the direction of achieving a fully-fledged Enterprise Risk Management System in the near future.
Given that each and every employee in the Bank needs to understand that the Bank is exposed to risk, creating awareness by disseminating risk knowledge and enhancing skills on an on-going basis is essential to inculcate the desired risk culture. In this regard, Risk Management Department provides appropriate training/awareness to the employees, risk owners in particular, on all aspects related to risk based on the relevant policy documents.
Risk management policy, procedures and limits
The Bank has a comprehensive Risk Management Policy that addresses all the risks managed by the Bank, encompassing compliance with the regulatory requirements including the Banking Act Direction
No. 07 of 2011 – Integrated Risk Management Framework for Licensed Commercial Banks based on the Basel Framework. Apart from institutionalising the risk knowledge base, this helps minimise bias and subjectivity in risk decisions.
This key document clearly defines the objectives, outlines priorities and processes and roles of the Board and the Management in managing risk, shaping the risk culture of the Bank. The Risk Assessment Statement (RAS) sets out the limits for risks and forms an integral part of the risk management framework. The RAS and all risk policies are reviewed by the BIRMC at least annually or more frequently depending on the regulatory and business needs.
The overall risk exposure of the Bank including its overseas operations is compliant with the regulatory framework of the CBSL. Additionally, in order to ensure compliance, the risk management framework takes into account the regulatory requirements of the respective countries where the Bank conducts its operations.
Bank has issued detailed operational guidelines to facilitate implementation of the risk management policy and the limits specified in the RAS. These guidelines relate to specification of types of facilities, processes and terms and conditions under which the Bank will conduct business, providing clarity to the employees in their day-to-day work.
Risk management tools
Bank employs a combination of qualitative and quantitative risk management tools for identifying, measuring, managing and reporting risks. The choice of a tool(s) for managing a particular risk depends on the likelihood of occurrence and the impact of the risk as well as the availability of data. These tools vary from risk policies, risk registers, risk maps, heat maps, diversification, SEMS, insurance and benchmarking to limits, gap analysis, NPV analysis, swaps, caps and floors, hedging, risk rating, risk scoring, risk modeling, duration, scenario analysis, marking to market, stress testing, and VaR analysis.
Table – 37
Risk management tools
| Type of risk |
Qualitative tools |
Quantitative tools |
| Credit |
Risk policies, risk registers, risk maps, heat maps, benchmarking, SEMS, diversification, and insurance |
NPV analysis, caps and floors, hedging, risk rating, risk scoring, stress testing, |
| Market |
Risk policies, risk registers, risk maps, heat maps, diversification, and benchmarking |
Limits, gap analysis, swaps, hedging, risk rating, risk modelling, duration, scenario analysis, mark to market, stress testing, VaR, and probabilistic techniques |
| Operational |
Risk policies, risk registers, risk maps, heat maps and benchmarking |
Risk modelling and insurance |
Monitoring and reporting
It is the responsibility of the risk management function of the Bank to identify, measure, monitor and report risk. In order to enhance the effectiveness of its role, staff attached to it undergoes regular training, enabling them to develop and refine their skills. They are well aided by IT systems which enable extraction of data, analysis and modelling. Regular and ad hoc reports are generated for review by the Senior Management, management committees and the Board which rely on such reports for evaluating performance and providing strategic direction. The reports provide information on aggregate measures of risks across products, portfolios, and geographies which are compared against agreed policy parameters providing a clear representation of the risk profile and sensitivities of the risks assumed by the Bank.
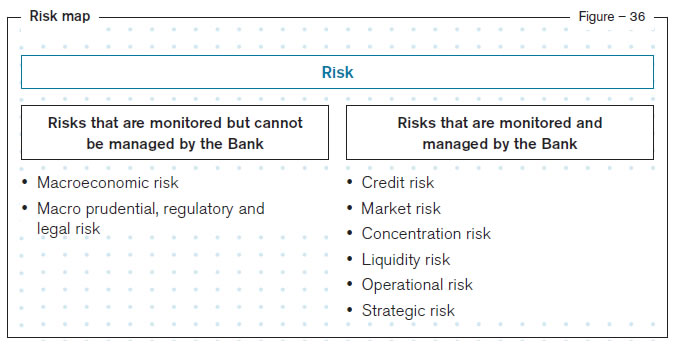
Risk map
Based on the likelihood of occurrence and the impact of such risks on achieving strategic goals including the financial performance, the Bank has broadly categorised its risk exposures as shown in the risk map below [Figure 38]. While most of the risks are within the purview of the Bank and hence can be managed, there are a few other key risks that are beyond the purview of the Bank and hence can only be monitored to assess their impact.
Credit risk
Credit Risk is the risk of potential loss resulting from the failure of a customer/borrower or counterparty to honour its financial or contractual obligations to the Bank. It arises mainly from direct lending activities which are reflected in on-balance sheet assets as well as off-balance sheet transactions such as letters of credit, guarantees, documents against acceptance etc. Counterparty risk, concentration risk and settlement risk together constitute the total Credit risk of the Bank.
Table – 38
Maximum credit risk exposure
|
Maximum exposure
2017 |
Maximum exposure
2016 |
|
Rs. Mn. |
% |
Rs. Mn. |
% |
| Carrying amount of credit exposures |
|
|
|
|
| Loans and receivables to other customers |
737,447 |
46.9 |
616,018 |
44.3 |
| Loans receivables to banks |
641 |
0.0 |
624 |
0.0 |
| Financial investments |
271,400 |
17.3 |
277,817 |
20.0 |
|
1,009,488 |
|
894,459 |
|
| Off-balance sheet maximum exposures |
|
|
|
|
| Lending commitments |
124,595 |
7.9 |
131,382 |
9.4 |
| Contingencies |
438,454 |
27.9 |
365,854 |
26.3 |
|
563,049 |
|
497,236 |
|
| Maximum credit exposure |
1,572,537 |
100.0 |
1,391,695 |
100.0 |
| Individually Impaired loans |
23,043 |
|
22,102 |
|
Impaired loans as a % of gross
loans and receivables |
3.05 |
|
3.49 |
|
Provisions for impairment
(individual and collective) |
17,261 |
|
17,373 |
|
Net carrying amount of loans
and receivables |
737,447 |
|
616,018 |
|
Provisions as a % of gross loans
and receivables |
2.29 |
|
2.74 |
|
Loan impairment charge
(individual and collective) |
1,957 |
|
1,511 |
|
Overall credit exposure
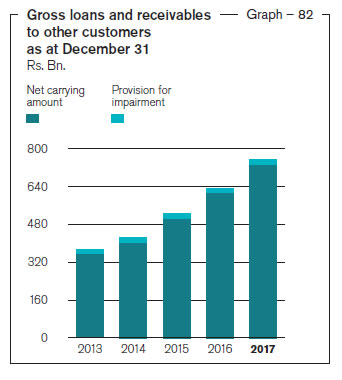
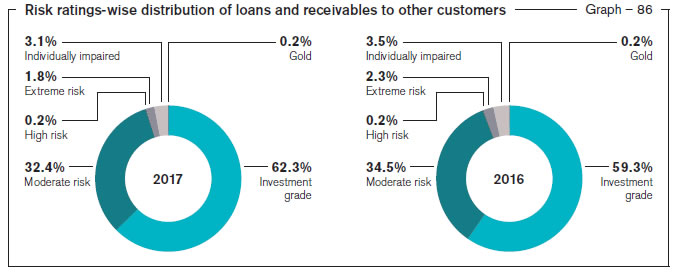
The Bank’s maximum credit exposure has increased by 12.99% in 2017 compared to the previous year. Both retail banking and corporate banking portfolios have contributed to this growth. Individually impaired loans have increased by 4.26% as a result of a policy decision of the Bank to lower the threshold for recognition of individually significant loans and the growth in loan book during the year.
Since a large number of individually significant loans are subject to rigorous evaluation at the time of being subjected to impairment trigger tests, final provisioning figures reflect a more realistic picture of the quality of the advances portfolio of the Bank.
During the year, an increase of 29.5% is observed in impairment charges compared to the previous year. Due to the revision of thresholds for identifying the loans to be subjected to individual impairment in 2016 and the resultant shift of a sizable portfolio from collective impairment to individual impairment has contributed to this increase in impairment charges. A detailed clarification in this regard is given in the section on Capital Management under Management Discussion and Analysis.
Managing credit risk

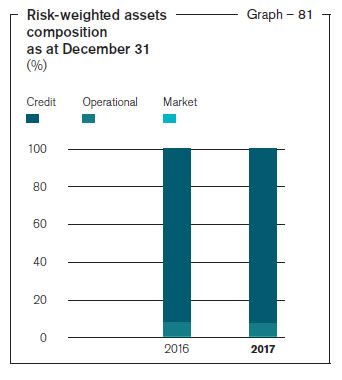
Given that credit risk accounts for 91.9% of the risk-weighted assets as at December 31, 2017 (91.6% as at December 31, 2016), management of credit risk is critical to the Bank. Our objective is to enhance value through credit risk management going beyond mere regulatory compliance. It is managed through the Credit Risk Management Framework approved by the Board, which is summarised graphically in the Figure 38 below.
- A robust risk governance structure –
Credit risk is monitored by the Board, BCC and BIRMC which are responsible for formulating policy including setting the parameters of the RAS. EIRMC, CPC and ECMN are the principal management committees responsible for monitoring credit risk exposure and initiating appropriate action to maintain the overall credit risk exposures within the defined risk appetite. Credit Risk Management Unit, Credit Risk Review Unit and Social and Environmental Risk Review Unit of the IRMD are responsible for daily credit risk management activities including measuring, monitoring and reporting of credit risk exposures and facilitating review of the Bank’s credit risk-related policies and exposure limits at least annually. It also provides independent reviews on credit risk associated with new products/product relaunches and process changes to optimise risk-return trade-off.
- A comprehensive suite of risk management processes comprising the following:

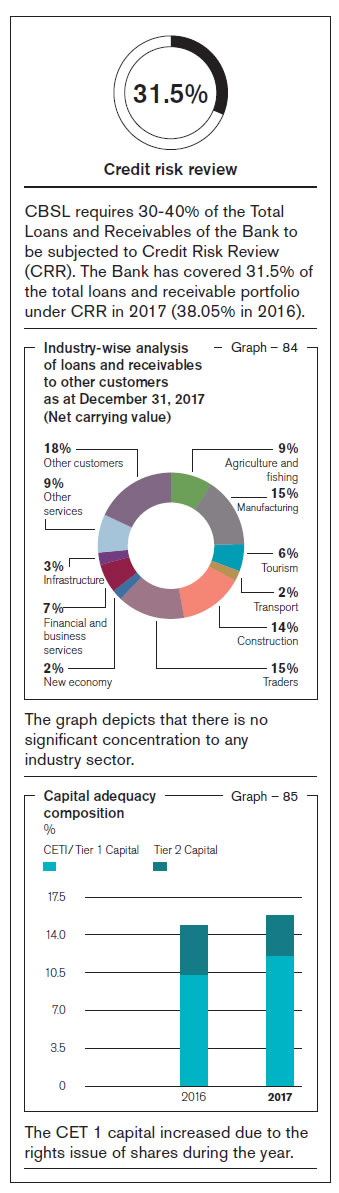
Review of credit risk
Elevated levels of attention given to loan approvals and disbursements coupled with concerted efforts in keeping the NPA levels in tandem with the established policy parameters paved the way to improve the asset quality of the Bank.
The effective Credit Risk Management Framework referred to above that guides the Bank throughout the process of on-boarding new exposure and monitoring existing exposure contributes immensely to preserve the quality of the loan book. In addition, the Bank is cautious and exercises restraint in the choice of customers, products, segments and geographies it caters to. Continuous monitoring of age analysis and the underlying movement across arrears buckets of past due loans enabled the Bank to swiftly take action, thereby moderating default risk during the year.
The allowance for individually impaired loans decreased by 7.1% whilst the allowance for collective impairment increased by 5.5% during the year, distribution of which is given Note 33.5 to the Financial Statements.
Table – 39
Individual/collective impairment distribution – Sri Lanka operation
| Industry sector |
Past due and
individually
impaired
advances
Rs. ’000 |
Allowance
for collective
impairment
Rs. ’000 |
Allowance for
individually
impaired loans
Rs. ’000 |
Amount
written off
Rs. ’000 |
| Exports |
3,318,650 |
471,706 |
583,982 |
5,717 |
| Imports and trading |
3,862,404 |
948,398 |
1,482,820 |
2,494 |
| Wholesale and retail trading |
1,331,525 |
377,490 |
267,397 |
1,871 |
| Construction industry |
1,945,727 |
199,382 |
376,267 |
53,182 |
| Any other commercial activity |
1,296,311 |
290,014 |
156,438 |
6,762 |
| Industries – MFG for local market |
6,591,036 |
802,929 |
1,312,957 |
6,544 |
| Agricultural activity |
1,794,354 |
644,642 |
247,302 |
19,412 |
| Housing and property development |
830,748 |
255,699 |
447,870 |
123 |
| Tourism and hospitality trade |
7,769,395 |
385,719 |
1,534,875 |
213 |
| Personal |
5,158,044 |
2,013,335 |
918,743 |
26,914 |
| Services |
1,978,533 |
696,474 |
233,399 |
4,959 |
| Holding companies |
41,417 |
65,691 |
1,619 |
– |
| Finance and insurance industry |
82,694 |
161,324 |
35,235 |
– |
| State institutions |
– |
11,429 |
– |
1,588 |
| Others |
1,249,650 |
1,045,854 |
53,066 |
690 |
| Total |
37,250,489 |
8,370,086 |
7,651,971 |
130,468 |
Table – 40
Individual/collective impairment distribution – Outside of Sri Lanka
| Industry sector |
Past due and
individually
impaired
advances
Rs. ’000 |
Allowance
for collective
impairment
Rs. ’000 |
Allowance for
individually
impaired loans
Rs. ’000 |
Amount
written off
Rs. ’000 |
Exports |
– |
224,379 |
– |
– |
Imports and trading |
– |
– |
– |
– |
Wholesale and retail trading |
255,513 |
129,553 |
– |
– |
Construction industry |
– |
– |
– |
– |
Any other commercial activity |
74,433 |
70,923 |
– |
– |
Industries – MFG for local market |
427,732 |
451,739 |
78,916 |
– |
Agricultural activity |
– |
18,282 |
– |
– |
Housing and property development |
102,252 |
12,058 |
– |
– |
Tourism and hospitality trade |
– |
1,742 |
– |
– |
Personal |
14,333 |
13,866 |
– |
– |
Services |
10,158 |
20,483 |
73,007 |
– |
Holding companies |
– |
– |
49,755 |
– |
Finance and insurance industry |
– |
56,409 |
– |
– |
State institutions |
– |
– |
– |
– |
Others |
– |
38,236 |
– |
– |
Total |
884,421 |
1,037,670 |
201,678 |
– |
Concentration risk
Concentration risk is managed by diversification of risk across industry sectors, products, counterparties and geographies. The Bank’s RAS defines the limits for these segments and exposures are monitored by the Board, BIRMC, EIRMC and the CPC to ensure compliance. They also make recommendations on modifications to specified limits taking into consideration trends and events shaping the business environment.
Individual and collective impairment distribution to identified industry sectors as at year end is given in Tables 39 and 40.
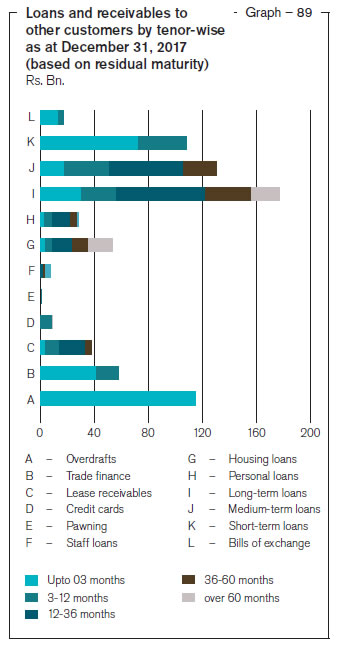
The below graph depicts that the tenor-wise breakdown of the portfolio of total loans & receivables to other customers is within the risk appetite of the Bank.
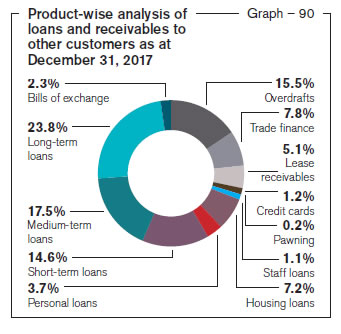
An analysis of loans and receivables by product (Graph 90) also reflects the effectiveness of the Bank’s credit policies with risk being well-diversified across the Bank’s range of credit products.
The relatively high exposure of 23.8% to long-term loans is rigorously monitored and mitigated with collateral.
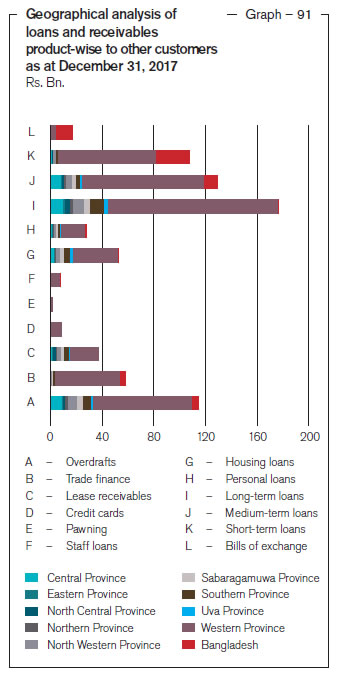
A geographical analysis reflects a high concentration of loans (Graph 91) in the Western Province which is due to concentration of economic activities in the Province and the head offices of most borrowing entities being located there.
Counterparty risk
The Bank has laid down policies/procedures and limit structures including single borrower limits and group exposure limits with sub-limits for products etc. to manage the counterparty risks. The limits set by the Bank are far more stringent than those stipulated by the regulator. This provides the Bank with a greater leeway in managing its concentration levels with regard to the counterparty exposures.
A key component in managing counterparty risk is the loans and receivables to banks both local and foreign which is being monitored through a specific set of policies, procedures and a limit structure. At frequent intervals the counterparty bank exposures are monitored against the established prudent limits whilst market information on the financial/economic performance of these counterparties are subject to a rigorous scrutiny throughout the year and the limits are revised to reflect the latest information where deemed necessary.
*Equal CRISL/Alpha ratings are given where CRAB ratings are unavailable
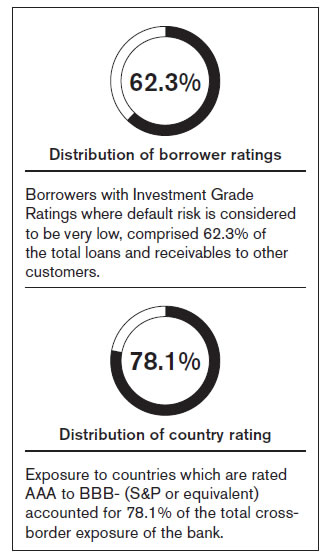
The analysis uses Fitch Ratings for local banks in Sri Lanka and Credit Ratings Agency in Bangladesh (CRAB) for local banks in Bangladesh (Equivalent CRISL/Alpha ratings have been used where CRAB ratings are not available). Exposures for local banks in Sri Lanka rated AAA to A category stood at 96% (Graph 92) whilst 97% of exposure of local banks in Bangladesh consisted of AAA to A rated counterparty banks (Graph 93).
Cross-border risk
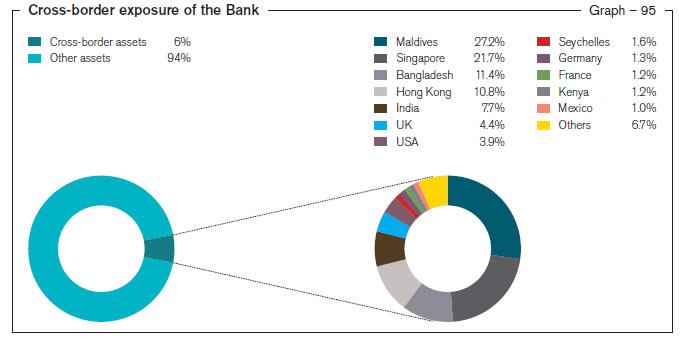
The risk that the Bank will be unable to obtain payment from its customers or third parties on their contractual obligations as a result of certain actions taken by foreign Governments, mainly relating to convertibility and transferability of foreign currency is referred to as the Cross-border Risk. Cross-border assets comprise loans and advances, interest-bearing deposits with other banks, trade and other bills and acceptances and predominantly relate to short-term money market activities.
In addition to the limit structure in place to minimise risk arising from over concentration, the Bank continuously monitors macro-economic and market developments of the countries with exposure to counterparties besides stringent evaluations of counterparties and maintaining frequent dialogue with them. Timely action is taken to suspend limits to countries with adverse economic/political developments.
Note: Excluding the investment in Bangladesh operation and Direct lending in Maldives and Bangladesh
Total cross-border exposure is only 6% of total assets of the Bank (Graph 95). The Bank has exposures to cross-border through a spread of countries which primarily include Maldives, Singapore, Hong Kong, USA, India, etc.
With the start of operations in the Maldives through our subsidiary “Commercial Bank of Maldives Limited (CBM)”, the Group level cross-border exposure measurements are now analysed and monitored. However, as of year-end there are no additional exposures to this entity, other than the capital investment.
Market risk
Market risk is the risk of loss arising from movements in interest rates, foreign exchange rates, commodity prices, equity and debt prices and their correlations. Most of the Bank's operations are subject to at least one or more elements of market risk.
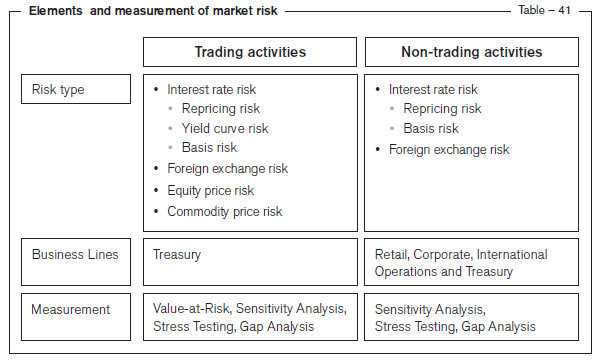
Table – 42
Market risk categories
| Major market risk category |
Risk components |
Description |
Tools to monitor |
Severity |
Impact |
Exposure |
| Interest rate |
|
Risk of loss arising from movements or volatility in interest rates |
|
|
|
|
|
Re-pricing |
Differences in amounts of interest earning assets and interest-bearing liabilities getting re-priced at the same time or due to timing differences in the fixed rate maturities and appropriately re-pricing of floating rate assets, liabilities and off-balance sheet instruments |
Re-pricing gap limits and interest rate sensitivity limits |
High |
High |
High |
|
Yield curve |
Unanticipated changes in shape and gradient of the yield curve |
Rate shocks and reports |
High |
High |
High |
|
Basis |
Differences in the relative movements of rate indices which are used for pricing instruments with similar characteristics |
Rate shocks and reports |
High |
Medium |
Medium |
| Foreign exchange |
|
Possible impact on earnings or capital arising from movements in exchange rates arising out of maturity mismatches in foreign currency positions other than those denominated in base currency, Sri Lankan Rupee (LKR) |
Risk tolerance limits for individual currency exposures as well as aggregate exposures within regulatory limits for NOP |
High |
Medium |
Medium |
| Equity |
|
Possible loss arising from changes in prices and volatilities of individual equities |
Mark-to-market calculations are carried out daily and quarterly for Held for Trading (HFT) and Available for Sale (AFS) portfolios respectively |
Low |
Low |
Negligible |
| Commodity |
|
Exposures to changes in prices and volatilities of individual commodities |
Mark to market calculations |
Low |
Low |
Negligible |
Managing market risk
The Market risk is managed through the Market Risk Management Framework approved by the Board, which is summarised graphically in the Figure 40 below.
- A robust risk governance structure –
Market risk is monitored by the Board, BIRMC and EIRMC which are responsible for formulating policy including setting the parameters of the RAS. ALCO is the principal Management Committee responsible for monitoring market risk exposure and initiating appropriate action to optimise overall market risk exposures within the defined risk appetite. Market Risk Management Unit (MRMU) of the IRMD is responsible for daily Market Risk Management activities including measuring, monitoring and reporting of market risk exposures and facilitating review of the Bank’s market risk-related policies and exposure limits at least annually. It prepares and presents Key Market Risk Indicators (KMRIs) on a monthly basis to EIRMC in which they are extensively discussed and considered for appropriate actions. It also provides independent reviews on market risks associated with new investment proposals and products to optimise risk-return trade-off. The Treasury Middle Office (TMO) is an integral part of MRMU and functions independently from both the Treasury Front Office (i.e. trading unit) and Treasury Back Office (i.e. settlement unit). TMO independently monitors, measures and analyses exposures as per the comprehensive limit framework pertaining to Treasury transactions. Further it reports on Management Action Triggers (MATs), which alert of imminent limit breaches and recurring loss events, to initiate preventive measures to mitigate potential losses.

- A comprehensive suite of risk management processes comprising the following:
- Policies – In addition to the Bank Risk Management Policy, policies covering various aspects of market risk which include Market Risk Management Policy, Asset and Liability Management (ALM) Policy, Foreign Exchange (FX) Risk Management Policy, Derivative Policy, Treasury Policy, Stress Testing Policy Code of Ethics for Dealers define exposure limits and procedures for transactions.
- Market risk limits – These are regularly reviewed by ALCO and EIRMC which are revised to narrower bands than specified in the RAS if market dynamics indicate elevated risk levels.
- MATs – These are risk thresholds determined based on the risk appetite of the Bank, that trigger specific actions to safeguard the market risk exposures of the Bank within the levels specified in the RAS.
- Risk monitoring – ALCO monitors asset and liability gaps and market trends to determine strategy, pricing of risk and funding requirements while also guiding Treasury on management of IRR. Tools such as gap analysis (income perspective) and duration analysis (value perspective) are used to monitor IRR on an ongoing basis factoring the re-pricing characteristics of all assets and liabilities of the Bank’s balance sheet. The Bank assesses IRR exposure based on both the Earnings at Risk (EAR) approach focusing on the impact of interest rate changes on its near-term earnings and the Economic Value of Equity (EVE) approach, focusing on the time value of the Bank’s net cash flows over longer time horizons. Exchange Rate Risk (ERR) is monitored through variance analysis, SWAP exposures, Counter party limits, and Net Open Positions.
- Risk assessment – A range of techniques including sensitivity analysis, stress testing, Mark to Market and Value at Risk (VaR) calculations are used to assess market risk across portfolios.

Review of market risk
Market risk arises mainly from the
Non-Trading Portfolio (Banking Book) which accounts for 91.52% of the total assets and 93.32% of the total liabilities subject to market risk. Exposure to market risk arises mainly from IRR and FX risk as the Bank has negligible exposure to commodity related price risk and equity and debt price risk which was less than 12% of the total risk weighted exposure for market risk.
The Bank’s exposure to market risk analysed by Trading Book and Non-Trading Portfolios (or Banking Book) are set out in the Table 43 below:
Table – 43
Bank’s exposure to market risk
| as at December 31, 2017 |
|
|
Market risk measurement |
|
Note |
Carrying
amount |
Trading
portfolio |
Non-trading
portfolio |
| Assets subject to market risk |
|
|
|
|
| Cash and cash equivalents |
27 |
12,387,967 |
|
12,387,967 |
| Balances with central banks |
28 |
4,601,606 |
|
4,601,606 |
| Placements with banks |
29 |
17,633,269 |
|
17,633,269 |
| Securities purchased under resale agreements |
|
– |
|
– |
| Derivative financial assets |
30 |
2,334,536 |
2,334,536 |
|
| Other financial instruments –Held for trading |
31 |
4,410,913 |
4,410,913 |
|
| Loans and receivables to banks |
32 |
640,512 |
|
640,512 |
| Loans and receivables to other customers |
33 |
737,446,567 |
|
737,446,567 |
| Financial investments – Available for sale |
34 |
154,714,132 |
|
154,714,132 |
| Financial investments – Held to maturity |
35 |
63,562,752 |
|
63,562,752 |
| Financial investments – Loans and receivables |
36 |
48,712,477 |
|
48,712,477 |
|
|
1,046,444,731 |
6,745,449 |
1,039,699,282 |
| Liabilities subject to market risk |
|
|
|
|
| Due to banks |
43 |
57,120,991 |
|
57,120,991 |
| Derivative financial liabilities |
44 |
3,678,494 |
3,678,494 |
|
| Securities sold under repurchase agreements |
– |
49,676,767 |
|
49,676,767 |
| Due to other customers/deposits from customers |
45 |
807,630,072 |
|
807,630,072 |
| Other borrowings |
46 |
23,786,094 |
|
23,786,094 |
| Subordinated liabilities |
52 |
25,165,924 |
|
25,165,924 |
|
|
967,058,342 |
3,678,494 |
963,379,848 |
Market risk portfolio analysis
The gap report is prepared by stratifying Rate Sensitive Assets (RSA) and Rate Sensitive Liabilities (RSL) into various time bands according to maturity (if fixed rates) or time remaining to their next re-pricing (if floating rate). Savings Deposits balances are distributed in line with the findings of behavioural analysis conducted by the Bank. Vulnerability of the Bank to interest rate volatility is indicated by the gap between RSA and RSL.
Table – 44
Interest rate sensitivity gap analysis of assets of the banking book as at December 31, 2017 – Bank
|
|
0-90
days |
|
3-12
months
Rs. ’000 |
|
1-3
years
Rs. ’000 |
|
3-5
years
Rs. ’000 |
|
Over 5
years
Rs. ’000 |
|
Non-
sensitive
Rs. ’000 |
|
Total
Rs. ’000 |
| Financial assets |
|
|
|
|
|
|
|
|
|
|
|
|
|
|
| Total financial assets |
|
541,347,702 |
|
216,019,552 |
|
130,748,898 |
|
96,641,458 |
|
38,604,415 |
|
77,373,750 |
|
1,100,735,775 |
| Financial liabilities |
|
|
|
|
|
|
|
|
|
|
|
|
|
|
| Total financial liabilities |
|
323,590,213 |
|
344,150,761 |
|
88,233,157 |
|
90,783,854 |
|
85,195,402 |
|
73,923,900 |
|
1,005,877,287 |
| Period gap |
|
217,757,488 |
|
(128,131,209) |
|
42,515,741 |
|
5,857,604 |
|
(46,590,987) |
|
|
|
|
| Cumulative gap |
|
217,757,488 |
|
89,626,279 |
|
132,142,020 |
|
137,999,624 |
|
91,408,637 |
|
|
|
|
| RSA/RSL |
|
1.67 |
|
0.63 |
|
1.48 |
|
1.06 |
|
0.45 |
|
|
|
|
Interest Rate Risk (IRR)
Extreme movements in interest rates expose the Bank to fluctuations in Net Interest Income (NII) and have the potential to impact the underlying value of interest earning assets and inherent liabilities and off-balance sheet items. The main types of IRR to which the Bank is exposed to are re-pricing risk, yield curve risk and basis risk.
Sensitivity of projected NII
Regular stress tests are carried out on Interest Rate Risk in Banking Book (IRRBB) encompassing changing positions and new economic variables together with systemic and specific stress scenarios. Change in value of the Fixed Income Securities (FIS) portfolio in HFT and AFS categories due to abnormal market movements is measured using both EVE and EAR perspectives. Results of stress test on IRR are analysed to identify the impact of such scenarios on Bank’s profitability and capital.
Impact on NII due to rate shocks on LKR and FCY is continuously monitored to ascertain the Bank’s vulnerability to sudden interest rate movements [Refer Note 69.3.2 (b) to the Financial Statements].
Table – 45
Sensitivity of NII to rate shocks
|
2017 |
2016 |
|
Parallel
increase
Rs. ’000 |
Parallel
decrease
Rs. ’000 |
Parallel
increase
Rs. ’000 |
Parallel
decrease
Rs. ’000 |
| As at December 31, |
1,243,611 |
(1,241,623) |
670,859 |
(668,620) |
| Average for the year |
920,414 |
(918,225) |
634,306 |
(632,375) |
| Maximum for the year |
1,243,611 |
(1,241,623) |
827,488 |
(824,962) |
| Minimum for the year |
706,442 |
(704,325) |
366,432 |
(365,569) |
Foreign exchange risk
Stringent risk tolerance limits for individual currency exposures as well as aggregate exposures within the regulatory limits ensure that potential losses arising out of fluctuations in FX rates are minimised and maintained within the Bank’s risk appetite.
USD/LKR exchange rate fluctuated between a low of Rs. 149.65 and a high of Rs. 153.85 (source: Bloomberg) during the year under review and the annual rupee depreciation was recorded at approximately 2.46%. The Table 46 below indicates the Bank’s exposure to FX risk as at end 2017.
Table – 46
Bank’s exposure to FX risk
| Currency |
Net open position (NOP) |
Overall exposure in respective foreign currency |
Overall exposure in Rs. |
|
’000 |
’000 |
’000 |
| United States Dollar |
2,734.00 |
7,162.00 |
1,100,083.20 |
| Great Britain Pound |
20.00 |
(29.00) |
(5,990.50) |
| Euro |
(52.00) |
(269.00) |
(49,344.50) |
| Japanese Yen |
372.00 |
(2,965.00) |
(4,039.22) |
| Indian Rupee |
0.00 |
0.00 |
0.00 |
| Australian Dollar |
10.00 |
(51.00) |
(6,105.51) |
| Canadian Dollars |
(34.00) |
18.00 |
2,200.75 |
| Other currencies in USD |
(88.00) |
93.00 |
14,284.80 |
| Total exposure USD |
2,595 |
6,843 |
1,051,089.02 |
Total capital funds as
at December 31, 2017 |
|
|
122,415,881.71 |
Total exposure as a % of capital
funds as at December 31, 2017 |
|
|
0.86% |
Stress testing is conducted on NOP by applying rate shocks ranging from 6% to 15% in order to estimate the impact on profitability and capital adequacy of the Bank (Refer Note 69.3.3 to the Financial Statements). The impact of a 1% change in exchange rate on the NOP indicates a loss of Rs. 171.27 Mn. on the positions as at December 31, 2017.
Equity price risk
Although the Bank’s exposure to equity price risk is negligible, mark-to-market calculations are conducted daily on HFT and AFS portfolios. The Bank has also commenced VaR calculations on equity portfolio. The Table 47 below summarises the impact of a shock of 10% on equity price on profit, other comprehensive income (OCI) and equity.
Table – 47
Impact of 10% shocks on equity portfolio
|
2017 |
2016 |
|
Held for trading
Rs. ’000 |
Available for sale
Rs. ’000 |
Total
Rs. ’000 |
Held for trading
Rs. ’000 |
Available for sale
Rs. ’000 |
Total
Rs. ’000 |
Market value of Equity Securities
as at December 31, |
314,745 |
500,278 |
815,023 |
293,809 |
246,548 |
540,357 |
|
Impact on P&L
Rs. ’000 |
Impact on OCI
Rs. ’000 |
Impact on equity
Rs. ’000 |
Impact on P&L
Rs. ’000 |
Impact on OCI
Rs. ’000 |
Impact on equity
Rs. ’000 |
Shock of 10% on equity price
(upward) |
31,475 |
50,028 |
81,503 |
29,381 |
24,655 |
54,036 |
Shock of 10% on equity price
(downward) |
(31,474) |
(50,028) |
(81,502) |
(29,381) |
(24,655) |
(54,036) |
Commodity price risk
The Bank has a negligible exposure to commodity price risk which is limited to the extent of the fluctuations in gold price on the Pawning portfolio. The portfolio is less than 0.177% of total market risk exposure.
Liquidity risk
Liquidity Risk is the Bank’s inability to meet “on” or “off” balance sheet contractual and contingent financial obligations as they fall due, without incurring unacceptable losses.
Banks are vulnerable to liquidity and solvency problems arising from asset and liability mismatches. Consequently, the primary objective of liquidity risk management is to assess and ensure availability of funds required to meet obligations at appropriate times, both under normal and stressed conditions.
The Bank has maintained the following liquid asset ratios as at December 31, 2017:
Table – 48
Liquid asset ratios
|
Domestic Banking
Unit (DBU)
% |
Off-shore Banking
Unit (OBC)
% |
| Statutory Liquid Assets Ratio (SLAR) |
27.28 |
30.95 |
|
Local currency
% |
All currencies
% |
| Liquidity Coverage Ratio (LCR) |
272.15 |
209.17 |
Managing liquidity risk
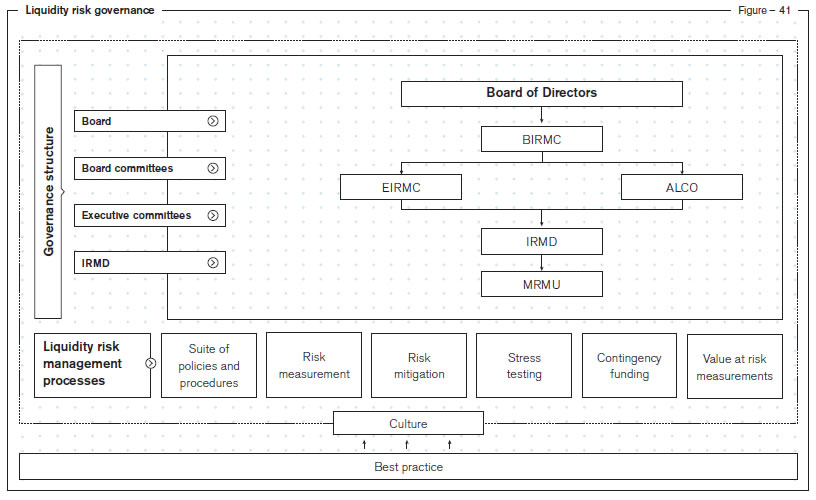
The Bank manages liquidity risk through the Liquidity Risk Management Framework on a continuous basis to ensure that it is managed within the parameters of the risk appetite.
- A robust risk governance structure – ALCO is mandated with the implementation of liquidity risk management policies and procedures which encompass establishing and monitoring liquidity targets, determining strategies and tactics to meet those targets and ensuring availability of sufficient liquidity for unanticipated contingencies. Strategies include effective diversification of sources and tenors of funding, monitoring off-balance sheet activity related liquidity impact and diversifying deposit maturity base avoiding concentrations. The Board, BIRMC, ALCO and EIRMC regularly review reports of key liquidity risk indicators to ensure that they are within the agreed parameters.
- A comprehensive suite of risk management processes comprising policies and procedures, measurement approaches, mitigation measures, stress testing methodologies, contingency funding arrangements and VaR measurements, as detailed below:
- Measurement – Liquidity is monitored within both stock (based on key ratios) and flow (based on cash inflows and outflows in time bands) approaches. Key liquidity risk indicators used by the Bank to assess adequacy of its liquidity position include Statutory Liquid Assets Ratio (SLAR), Liquidity Coverage Ratio (LCR), Net Advances to Deposits Ratio, Dynamic and Static (Structural) Liquidity Gap Summary, Net Stable Funding Ratio, Funding Concentration and Commitments in relation to funding sources. A more stringent internal limit has been set for SLAR compared to the statutory requirement of 20% of total liabilities excluding contingent liabilities as well as LCR as per the Basel III Guidelines.
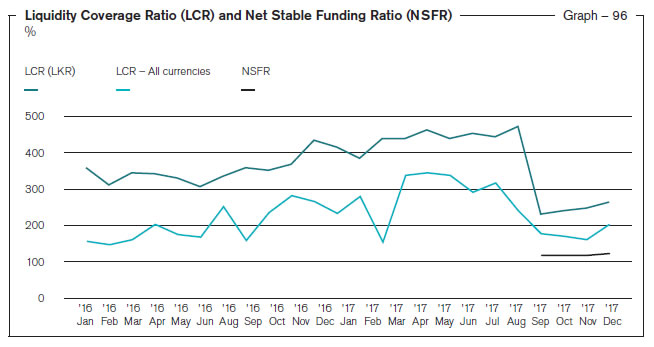
209.17%
Liquidity Coverage Ratio (LCR) |
| Liquidity Coverage Ratio of the
Bank which stood at 209.17% was
well above the minimum statutory
requirement of 100%. |
127.87%
Net Stable Funding Ratio (NSFR) |
NSFR, requires banks to maintain
a stable funding profile by creating
additional incentives for banks to fund
their activities with more stable sources
of funding on an ongoing basis, over
a longer time horizon, in relation to the
composition of their assets and
off-balance sheet exposures.
Compliance for NSFR to be made with
effect from April 1, 2018 as per the
Consultation paper issued by CBSL in
November 2017 and banks are required
to maintain a minimum NSFR of 100%. |
- Risk mitigation – An adequate margin is maintained in high quality liquid assets and access to diverse funding sources such as inter-bank market, wholesale and retail repurchase agreements, assets and investments available-for-sale. Additionally, contingency funding agreements with peer banks are in place ensuring availability of adequate liquidity to fund its existing asset base and growth whilst maintaining sufficient liquidity buffers to operate smoothly under varying market conditions in the short-term.
- Stress testing – Liquidity stress tests and scenario analysis are carried out on an annual basis in line with the guidelines on stress testing of LCBs and LSBs issued by the CBSL in September 2014 to evaluate the potential impact of sudden and severe stress events on the Bank’s liquidity position. This enables the Bank to proactively identify appropriate funding arrangements that can be used to manage such stress situations with a minimum financial and/or reputational impact.
- Contingency funding – The Contingency Funding Plan provides guidance in managing liquidity in Bank specific or market specific scenarios. It outlines how assets and liabilities of the Bank are to be monitored, emphasising avoidance of a liquidity crisis. These procedures address unlikely but possible events of either short or long-term funding crisis, forecast funding needs as well as funding sources under different market situations including aggressive asset growth or loan rollover and rapid liability erosion or sharp decline in deposits during a 3-month period which is considered the most critical time span in a liquidity crisis. The Management and reporting framework identifies early warning signals and enumerates means to avoid and mitigate possible crises promptly. A Management Action Plan with alternative sources of inflows and trigger levels for action, a communication plan to prevent further escalation or contagion and regular sources of liquidity supplemented with contingent sources in detail are among other things covered in this important plan.
- Value at Risk (VaR) – The Bank carries out VaR calculations based on the historical simulation method on four portfolios categorised as HFT, using a market risk software solution (which has the capability to compute VaR based on Monte Carlo Simulation and Variance-Covariance as well) in order to measure its market risk exposure. VaR is computed in line with Basel II Market Risk Framework, considering a 99% “Confidence Interval” and a 10-trading-days Holding Period. VaR, a quantitative measure, depicts the maximum loss the Bank may incur, under specific conditions during a period of 250 days due to changes in interest rates, exchange rates, debt and equity prices as well as price of financial products. During the year, the Bank obtained validation on its VaR model through an external consultant. Recommendations have been deployed for effective decision-making.
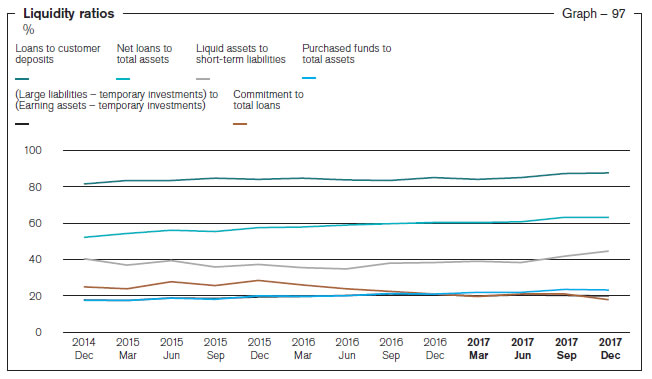
Liquidity risk review
The net loans to deposits ratio is regularly monitored by ALCO to ensure that the asset and liability portfolios of the Bank are geared to maintain a healthy liquidity position. Net stable funding ratio indicating stability of funding sources compared to loans and advances granted was maintained well above the policy threshold of 100%, which is considered healthy to support the Bank’s business model and growth.
The key ratios used for measuring liquidity under the stock approach are depicted below (Graph 97):
Maturity gap analysis of assets and liabilities as at December 31, 2017 – Bank
Maturity analysis of financial assets and liabilities of the Bank (Table 49) indicates sufficient funding for foreseeable adverse situations based on prescribed behavioural patterns observed.
Table – 49
| As at December 31, |
Up to 3
months |
3 to 12
months |
1 to 3
years |
3 to 5
years |
More than
5 years |
Total as at
31.12.2017 |
Total as at
31.12.2016 |
|
Rs. ’000 |
Rs. ’000 |
Rs. ’000 |
Rs. ’000 |
Rs. ’000 |
Rs. ’000 |
Rs. ’000 |
| Interest earning assets |
|
|
|
|
|
|
|
| Financial assets |
|
|
|
|
|
|
|
| Cash and cash equivalents |
3,457,539 |
– |
– |
– |
– |
3,457,539 |
7,930,050 |
| Balances with central banks |
887,551 |
263,830 |
– |
4,607 |
– |
1,155,988 |
498,616 |
| Placements with banks |
17,633,269 |
– |
– |
– |
– |
17,633,269 |
11,718,499 |
| Securities purchased under resale agreements |
– |
– |
– |
– |
– |
– |
– |
| Derivative financial assets |
– |
– |
– |
– |
– |
– |
– |
| Other financial instruments – Held fo trading |
4,096,168 |
|
|
|
|
4,096,168 |
4,693,989 |
| Loans and receivables to banks |
– |
– |
– |
– |
– |
– |
– |
| Loans and receivables to other customers |
231,342,860 |
198,426,781 |
169,978,799 |
93,774,191 |
43,923,936 |
737,446,567 |
616,018,228 |
| Financial investments – Available for sale |
13,025,195 |
67,787,547 |
59,124,910 |
14,229,518 |
– |
154,167,170 |
159,573,316 |
| Financial investments – Held to maturity |
4,077,407 |
9,871,844 |
12,885,249 |
29,661,652 |
7,066,600 |
63,562,752 |
60,981,298 |
| Financial investments – Loans and receivables |
2,521,780 |
5,188,975 |
16,430,329 |
24,571,393 |
– |
48,712,477 |
51,824,026 |
| Total interest earning assets as at December 31, 2017 |
277,041,769 |
281,538,977 |
258,419,287 |
162,241,361 |
50,990,536 |
1,030,231,930 |
|
| Total interest earning assets as at December 31, 2016 |
276,268,527 |
174,556,015 |
269,347,751 |
113,511,379 |
79,554,350 |
|
913,238,022 |
| Non-interest earning assets |
|
|
|
|
|
|
|
| Financial assets |
|
|
|
|
|
|
|
| Cash and cash equivalents |
29,767,080 |
– |
– |
– |
– |
29,767,080 |
22,263,539 |
| Balances with central banks |
26,999,348 |
14,321,349 |
783,669 |
730,063 |
811,029 |
43,645,458 |
43,374,589 |
| Placements with banks |
– |
– |
– |
– |
– |
– |
– |
| Securities purchased under resale agreements |
– |
– |
– |
– |
– |
– |
– |
| Derivative financial assets |
959,937 |
1,374,599 |
– |
– |
– |
2,334,536 |
1,052,829 |
| Other financial instruments – Held for trading |
314,745 |
|
|
|
|
314,745 |
293,809 |
| Loans and receivables to banks |
– |
– |
640,512 |
– |
– |
640,512 |
624,458 |
| Loans and receivables to other customers |
– |
– |
– |
– |
– |
– |
– |
| Financial investments – Available for sale |
– |
– |
– |
17,491 |
529,471 |
546,962 |
450,155 |
| Financial investments – Held to maturity |
– |
– |
– |
– |
– |
– |
– |
| Financial investments – Loans and receivables |
– |
– |
– |
– |
– |
– |
– |
| Non-financial assets |
|
|
|
|
|
|
|
| Investments in subsidiaries |
– |
– |
– |
– |
3,065,935 |
3,065,935 |
2,435,392 |
| Investments in associates |
– |
– |
– |
– |
44,331 |
44,331 |
44,331 |
| Property, plant and equipment |
– |
– |
– |
– |
14,634,710 |
14,634,710 |
10,307,825 |
| Intangible assets |
– |
– |
– |
– |
776,810 |
776,810 |
640,645 |
| Leasehold property |
– |
– |
– |
– |
72,594 |
72,594 |
73,536 |
| Deferred tax assets |
– |
– |
– |
– |
– |
– |
963,935 |
| Other assets |
12,270,707 |
257,173 |
1,245,002 |
506,177 |
3,019,103 |
17,298,162 |
16,438,166 |
| Total non-interest earning assets as at December 31, 2017 |
70,311,817 |
15,953,121 |
2,669,183 |
1,253,731 |
22,953,983 |
113,141,835 |
|
| Total non-interest earning assets as at December 31, 2016 |
62,243,958 |
14,616,440 |
3,826,664 |
991,974 |
17,284,173 |
|
98,963,209 |
| Total assets – as at December 31, 2017 |
347,353,586 |
297,492,098 |
261,088,470 |
163,495,092 |
73,944,519 |
1,143,373,765 |
|
| Total assets – as at December 31, 2016 |
338,512,485 |
189,172,455 |
273,174,415 |
114,503,353 |
96,838,523 |
|
1,012,201,231 |
| Percentage – as at December 31, 2017 (*) |
30.38 |
26.02 |
22.83 |
14.30 |
6.47 |
100.00 |
|
| Percentage – as at December 31, 2016 (*) |
33.44 |
18.69 |
26.99 |
11.31 |
9.57 |
|
100.00 |
(*) Total assets of each maturity bucket as a percentage of total assets employed by the Bank.
| As at December 31, |
Up to 3
Months |
3 to 12
Months |
1 to 3
Years |
3 to 5
Years |
More than
5 Years |
Total as at
31.12.2017 |
Total as at
31.12.2016 |
|
Rs. ’000 |
Rs. ’000 |
Rs. ’000 |
Rs. ’000 |
Rs. ’000 |
Rs. ’000 |
Rs. ’000 |
| Interest-bearing liabilities: |
|
|
|
|
|
|
|
| Financial liabilities |
|
|
|
|
|
|
|
| Due to banks |
32,840,250 |
3,840,696 |
12,232,304 |
– |
41,224 |
48,954,474 |
63,523,388 |
| Derivative financial liabilities |
– |
– |
– |
– |
– |
– |
– |
| Securities sold under repurchase agreements |
35,951,132 |
10,978,972 |
2,746,663 |
– |
– |
49,676,767 |
69,867,469 |
| Other financial liabilities – Held for trading |
– |
– |
– |
– |
– |
– |
– |
| Due to other customers/deposits from customers |
455,218,755 |
288,988,744 |
18,492,159 |
13,050,348 |
13,783,280 |
789,533,286 |
683,569,052 |
| Other borrowings |
657,813 |
2,091,720 |
5,021,093 |
7,503,789 |
8,511,679 |
23,786,094 |
9,270,154 |
| Subordinated liabilities |
203,326 |
314,552 |
– |
9,477,720 |
15,170,326 |
25,165,924 |
24,849,539 |
| Total interest-bearing liabilities as at December 31, 2017 |
524,871,276 |
306,214,684 |
38,492,219 |
30,031,857 |
37,506,509 |
937,116,545 |
|
| Total interest-bearing liabilities as at December 31, 2016 |
504,725,495 |
263,099,940 |
31,662,332 |
21,783,917 |
29,807,918 |
|
851,079,602 |
Maturity analysis of financial assets and financial liabilities of the Bank (Table 49) does not indicate any adverse situation when due cognisance is given to the fact that cash outflows include savings deposits which can be considered as a quasi stable source of funds based on historical behavioural patterns of such depositors as explained below.
Behavioural analysis on savings accounts
Savings accounts are treated as a non-maturing demand deposit as the customers do not enter into a contractual agreement with the Bank about the maturity of same. There is no exact re-pricing frequency for the product and the Bank resets rate offered to these deposits considering the factors such as re-pricing gap, liquidity and profitability etc. Since, there is no exact re-pricing frequency could be identified for the product, for the purpose of gap analysis of the Bank 100% of the LKR and FCY denominated Savings accounts were considered under the overnight category. This has created a significant mismatch in the overnight bucket of the re-pricing gap report of the Bank.
In 2017, the Bank carried out a behavioural analysis of savings accounts with the support of an external party in order to identify a mechanism to segregate the portfolio into re-pricing buckets.
It was revealed from the analysis that the Bank’s Savings Accounts Portfolio is not sensitive to market interest rates movements. Hence, the liquidity approach is considered to segregate the portfolio between the buckets.
Segregation of the savings products, among the predefined maturity buckets in Maturity Gap report is currently done based on the regular simulations carried out by the Bank in line with the behavioural study.
The liquidity position is measured in all major currencies at both individual and aggregate levels to ensure that potential risks are within specified threshold limits. Additionally, potential liquidity commitments resulting from loan disbursements and undrawn overdrafts are also monitored to ensure sufficient funding sources.
Funding diversification by product
The Bank’s primary sources of funding are deposits from customers. The Graph 98 provides a product-wise analysis of the Bank’s funding diversification as at year end.

Operational risk
Operational risk is the risk of losses stemming from inadequate or failed internal processes, people and systems, or from external events such as natural disasters, social or political events. It is inherent in all banking products and processes and our objective is to control it in a cost-effective manner. Operational risk includes legal risk but excludes strategic and reputational risk.
Managing operational risk
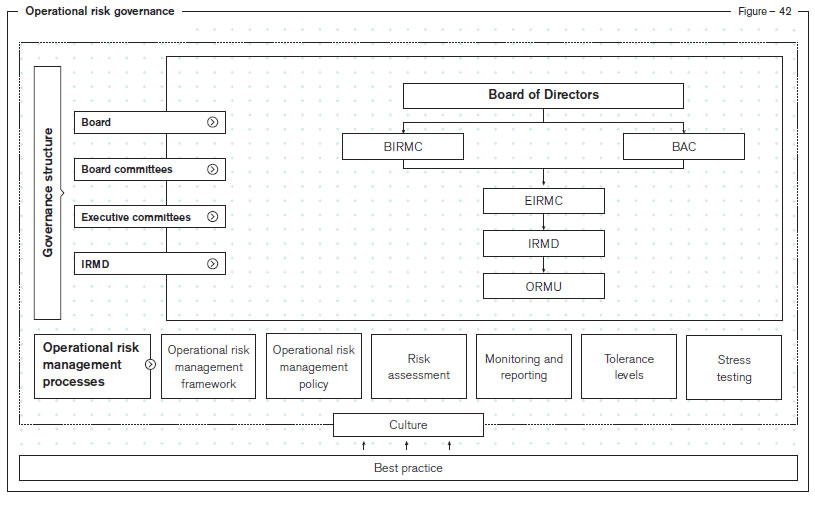
The Bank manages operational risk through the Operational Risk Management Framework which is summarised graphically in the Figure 43 below. It enables the Bank to determine the operational risk profile in relation to its risk appetite and systematically identify operational risk themes and concentrations to define risk mitigating measures and priorities, as described below.
- A robust risk governance structure –
The Board of Directors aided by the BIRMC ensures that a sufficiently robust framework for managing operational risks is established. The Bank’s first line of defence is the Management and staff of the Bank and a rigorous system of review is in place to identify operational risks within the strategic business units. An independent Operational Risk Management Unit (ORMU) reporting to the Chief Risk Officer (CRO) supports the EIRMC in monitoring operational risk providing independent oversight of the first line of defence. Internal Audit provides assurance on the effectiveness and integrity of the first and second lines of defence independently to the BAC.
- A comprehensive suite of risk management processes comprising the following:
- Policies – The Bank’s Operational Risk Management Framework defines the Bank’s approach in identifying, assessing, mitigating, monitoring and reporting the operational risks which may impact the achievement of the Bank’s business objectives. The risk management responsibilities and obligations of the Board of Directors, Corporate Management, ORMU and all other Risk Owners are clearly specified in the Operational Risk Management Policy which is reviewed annually.
- Risk assessment – Each business function proactively identifies and assesses its significant operational risks and the controls in place to manage those risks in a semi-annual RCSA process which is automated via the Operational Risk Management System (ORMS). Findings from the RCSA exercise is used to formulate appropriate action plans to address identified control gaps which are monitored as part of the overall Operational Risk Management exercise. The Bank also conducts reviews of new products, processes, services, operations, etc., to assess risk on a regular basis.
- Risk mitigation – Risk mitigation is planned in accordance with the ‘as low as reasonably practicable’ principle by balancing the cost of mitigation with the benefits thereof and formally accepting the residual risk. Several risk mitigation policies and programmes, including a robust internal control framework are in place to maintain a sound operating environment within the established risk appetite of the Bank.
- Insurance coverage is used as an external mitigant for ‘low probability – high impact’ events and uncontrollable operational risk events such as damage to physical assets by natural disasters, fire etc. Insurable risks are transferred to reputed insurance providers, which are periodically reviewed comprehensively by the ORMU for adequacy.
- Policies and procedures relating to outsourcing of business activities of the Bank ensure that all significant risks arising from outsourcing arrangements of the Bank are identified and effectively managed on a continuous basis. Details of all outsourced functions are reported to CBSL annually. Due diligence tests of outsourced vendors are carried out by respective risk owners prior to executing new agreements and renewal of existing agreements. Assistance of Information Systems Audit Unit is obtained when conducting due diligence tests of outsourced parties which provide IT services. Further, bi-annual review meetings are conducted with key IT service providers to monitor service performance levels and to verify adherence to the agreements.
- Technology risk is managed in a systematic and consistent manner to avoid potential operational losses to the Bank resulting from technological obsolescence. Accordingly, existing Information Technology Systems including the core-banking systems are upgraded and new software solutions implemented in a timely and appropriate manner. Further, in order to prevent information and communications systems failures, the Bank maintains redundancies and backup facilities.
- The Bank has a comprehensive Business Continuity Plan (BCP) and Disaster Recovery Plan (DRP) to assure the immediate continuity of all essential operations in case of a disaster and the eventual continuity of all other operations, which are continuously updated and tested to ensure ongoing readiness. These plans are reviewed independently by the ORMU and the Internal Audit Department in line with CBSL requirements.
- Creating a culture of risk awareness across the Bank through comprehensive training programmes together with high standards of ethics and integrity is also a key component of the Bank’s risk mitigatory measures.
- Monitoring and reporting of operational risk – Key Operational Risk Indicators (KORIs) and corresponding tolerance levels are reported to designated Committees and the Board. KORIs comprise both financial and non-financial indicators. A database of operational risk events and losses, including losses without any financial impact and ‘near-misses’ has been established through the ORMS to facilitate the analysis of loss trends and root causes as prescribed in Basel II. This is a key component in progressing towards advanced approaches in operational risk capital calculations.
- Stress testing of operational risk –
The Bank commenced conducting of stress testing on operational losses during the year 2014 by considering the historical data as per the scenarios proposed in the Stress Testing Policy of the Bank. This exercise is being carried out quarterly by the Bank as an additional measure to confirm its sound position.

Review of operational risk
In the absence of any upside unlike in the case of credit and market risks, the Bank has a low appetite for operational risks and has established tolerance levels for all material operational risk loss types based on historical loss data, budgets and forecasts, performance of the Bank, existing systems and controls governing Bank operations etc. Following thresholds have been established based on audited financials for monitoring purposes:
- Alert level – 3% of the average gross income for the past three years
- Maximum level – 5% of the average gross income for the past three years
Operational losses for the financial year 2017 were below the internal alert level at 2.85% (of average audited gross income for past three years). The Bank has been consistently maintaining operational losses below the alert level for the past eight years, reflecting the “tone at the top”, effectiveness of the governance structures and the rigour of processes and procedures in place to manage operational risk.
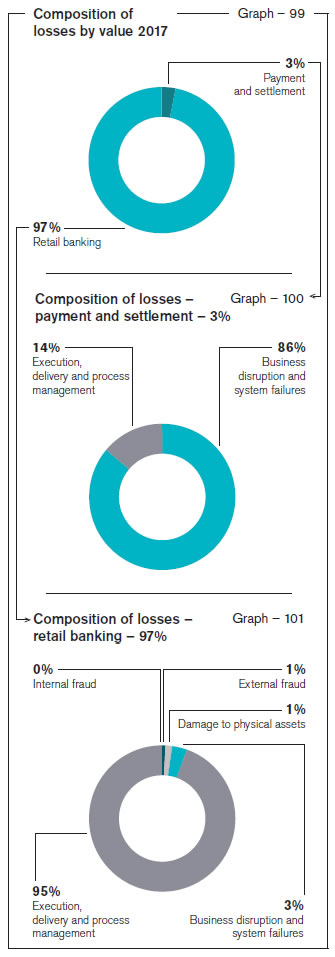
The Graph 99 analyses the operational risk losses incurred by the Bank under each business line/category during the year 2017.
When analysing the losses incurred during 2017 under the Basel II defined business lines, it is evident that the majority (97%) of losses with financial impact falls under the business line of “Retail Banking”, followed by the losses reported under the ‘‘Payment and Settlement” business line. Losses relating to other business lines remain negligible.
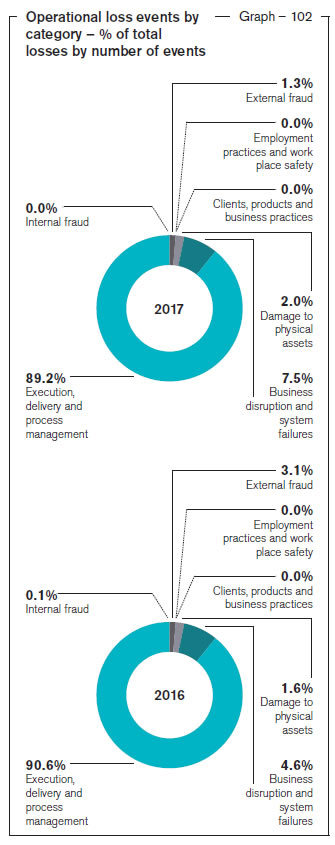
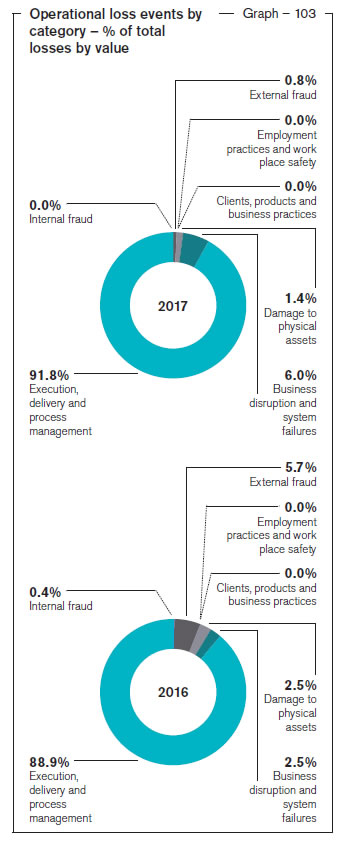
The Graphs 102 and 103 depict the comparison of operational losses reported during the last two years (2017 and 2016) under each Basel II loss event type both in terms of number of occurrences and value.
As typical with operational risk losses, majority of the losses encountered by the Bank during 2017 consists of high frequency/low financial impact events mainly falling under the loss category “Execution, Delivery and Process Management”. These low value events are mainly related to cash and ATM operations of the Bank’s service delivery network consisting of over 1,000 points across Sri Lanka and Bangladesh. Individual events with monetary values less than Rs. 100,000 account for more than 89% of the total loss events for the year. Also, the number of loss events for the year when compared to the number of transactions performed during the year stands at a mere 0.0079%.
When considering the values of the losses incurred by the Bank during the period under review (2017), they can be mainly categorised under Execution, Delivery and Process Management related and Business Disruption and System Failures. The losses for the year were primarily driven by a limited number of events in Execution, Delivery, and Process Management category, majority of which the Bank managed to resolve through subsequent recovery/rectification with minimum financial impact to the Bank. Further, necessary process improvements have been introduced to prevent recurrence. After the recovered amounts are discounted, the net loss amounts to a mere 0.08% of the average audited gross income for the last three years, as compared to the capital allocation of 15% under the Basic Indicator Approach of capital computation as per Basel II. This trend of exceptionally low levels of operational risk losses of the Bank bears testimony to the effectiveness of the Bank’s Operational Risk Management Framework and the internal control environment.
IT risk
Defined as the business risk associated with use, ownership, operation, involvement, influence and adoption of IT within an organisation, IT risk is a key area of concern globally as threats continue to escalate in scale, speed, and sophistication. A major component of operational risk, IT risk comprises IT-related events such as system interruptions, errors, frauds through system manipulations, cyber attacks, obsolescence in applications, falling behind competitors concerning the technology, etc., that could potentially impact the business as a whole. Occurrence is uncertain with regard to frequency and magnitude, posing challenges in managing this vital aspect. In such a backdrop, addressing this emerging IT risk category has become a top priority of the Bank, with the IT risk function giving more focus to cyber security strategies.
Year 2017 saw the number of cyber attacks directed at global financial institutions of all sizes growing, including several high profile attacks involving fraudulent fund transfers, data breaches, ransom demands and other hacks. Being a key player in the local financial sector, Commercial Bank too realises that it is a likely target for various evolving and adaptive cyber attacks, akin to any other organisation. We maintain a relentless focus on cyber security and continually invest on improving the Bank’s cyber security capabilities. Our cyber security strategy is focused on securely enabling new technology and business initiatives while maintaining a persistent focus on protecting the Bank and its customers from cyber threats.
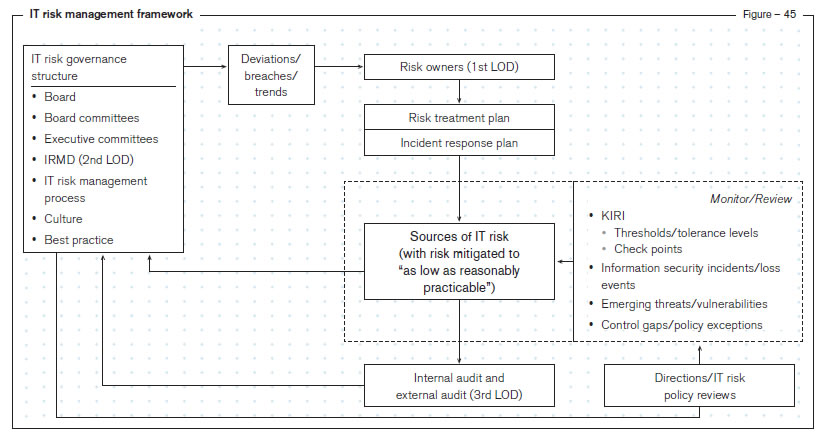
Established in 2012, the IT risk function operating under the CRO is responsible for implementing the IT Risk Management Framework for the Bank, ensuring that the appropriate governance framework, policies, processes and technical capabilities are in place to manage all significant IT risks in a consistent and effective manner across the organisation. The IT Risk Management Policy, aligned with the Operational Risk Management Policy of the Bank complements the Information Security Policy, the related processes, objectives and procedures relevant for managing risk and improving information security of the Bank.
With regard to the overall IT Risk Management process, RCSA is used as one of the core mechanisms for IT risk identification and assessment, while the IT Risk Unit carries out independent IT risk reviews both separately and in conjunction with regular operational risk reviews, in line with the established structure of the Operational risk management process. Results of these independent IT risk assessments together with audit findings, analysis of information security incidents, internal and external loss data are also employed for IT risk identification and assessment purposes.
IT risk mitigation involves prioritising, evaluating and implementing the appropriate risk-reducing controls or risk treatment techniques recommended from the risk identification and assessment process. The Bank seeks to operate within a highly secure environment which protects its data, systems, people and other information assets from various threats, through a multilayered approach of building controls in to each layer of technology, including data, applications, devices, network, etc. This ensures robust end-to-end protection, while enhancing the cyber threat detection, prevention, response and recovery opportunities. Being the first local Bank in the country to be certified under the ISO/IEC 27001 information security standard way back in 2010, the Bank has continued to demonstrate its commitment towards information security by maintaining the certification throughout, by successfully under-going the annual audits.

The Bank continues to make significant investments in cyber security to enhance its resilience towards the cyber threats.
- A key initiative during the year was enhancing the endpoint security capabilities of the network and improvements made to the network architecture through finer segregations and adoption of additional network security technologies.
- The Network Operations Centre established with the objective to improve the cyber incident response capabilities expanded its security incident and event monitoring functions with a view towards a fully-fledged Security Operations Centre.
- The Information Security Policy Framework, which includes information security principles and detailed information security policies and procedures, was further enhanced during the year with the introduction of the Commercial Bank Group Information Security Policy Framework with the aim of maintaining an appropriate level of information security protection Group-wide.
- The Bank is proactively involved in industry cyber security efforts and working with other parties, including third-party service providers and governmental agencies, to continue to enhance defenses and improve resiliency to cyber security threats.
Given that risk management relies heavily on an effective monitoring mechanism, the IT Risk Function carries out continuous, independent monitoring of the Bank’s IT risk profile. A range of tools and techniques including Key IT Risk Indicators (KIRIs) are used in this regard, where deviations from set thresholds receive a differential level of management attention in order to initiate appropriate corrective action.
Legal risk
Defined as the exposure to the adverse consequences resulting from inaccurately drafted contracts, their execution, the absence of written agreements or inadequate agreements, Legal Risk is an integral part of operational risk. It includes, but is not limited to, exposure to fines, penalties, or punitive damages resulting from supervisory actions, as well as cost of private settlements.
Legal risk is managed by ensuring that applicable regulations are fully taken into consideration in all relations and contracts with individuals and institutions who maintain business relationships with the Bank, and that they are supported by required documentation whereas risk of breaching the rules and regulations is managed by establishing and operating a sufficient mechanism for verification of conformity of operations with applicable regulations.
Compliance and regulatory risk
Compliance and regulatory risk refers to the potential risk to the Bank arising from failure to comply with applicable laws, rules and regulations and codes of conduct and may lead to regulatory sanctions, financial losses, disruptions to business activities and reputational damage. A compliance function reporting directly to the Board of Directors is in place to assess the Bank’s compliance with external and internal regulations.
A comprehensive compliance policy specifies how this key risk is identified, monitored and managed by the Bank in a structured manner. Bank’s culture and the code of ethics too play a key role in managing this risk.
Other related risks
Strategic risk
Strategic risks are the risks that are associated with the strategic decisions and may manifest in the Bank not been able to keep up with the changing market dynamics, leading to loss of market share and failure to achieve strategic goals. Strategic risk has gained an added importance in the context of the emerging risks referred to in the section on Managing Risk: An Overview under Governance and Risk Management. Corporate planning and budgeting process and critical evaluation of their alignment with the Bank’s vision, mission and the risk appetite facilitate management of strategic risk. The detailed scorecard-based qualitative model aligned to ICAAP is used to measure and monitor strategic risk of the Bank. This scorecard-based approach takes into consideration a range of factors, including the size and sophistication of the organisation, the nature and complexity of its activities in measuring strategic risk and highlights the areas that need emphasis to mitigate potential strategic risks.
Reputational risk
Reputational risk is the risk of adverse impact on earnings, assets and liabilities or brand value arising from negative stakeholder perception of the Bank’s business practices, activities and financial condition. The Bank recognises that reputational risk is driven by a wide range of other business risks that must all be actively managed. In addition, the exponential growth in channels of communication such as social media has widened the stakeholder base and expanded the sources of reputational risk. Accordingly, reputational risk is broadly managed through the systems and controls adopted for all other risk types such as credit, market, operational risk etc., which are underpinned by the code of conduct, communication policy and business ethics. Further, reputational risk is measured through the detailed scorecard-based model developed by the Bank to measure and monitor reputational risk under ICAAP. Timely actions are initiated to mitigate potential reputational risks by critically evaluating the criteria given in the said scorecard.
Capital management
The ICAAP framework in line with Basel requirements sets out the process for assessing total overall capital adequacy in relation to its risk profile. Internal limits which are more stringent than the regulatory requirement provide early warnings with regard to capital adequacy.
Table – 50
Target and actual capital levels
| Capital ratios |
Goal
(internal limit) |
2017
(%) |
2016
(%) |
| CET 1 (regulatory minimum 6.25%) |
> 10% |
12.12 |
10.47 |
| Total capital (regulatory minimum 11.75%) |
> 14% |
15.70 |
14.91 |
Table – 51
Summary of capital adequacy computation
| Capital |
2017
Rs. ’000 |
2016
Rs. ’000 |
| CET 1 capital |
96,980,344 |
69,996,519 |
| Deductions and adjustments |
1,255,038 |
1,132,669 |
| Eligible CET 1 capital |
95,725,306 |
68,863,850 |
| Tier 2 capital |
28,264,629 |
29,232,514 |
| Deductions and adjustments |
– |
– |
| Total capital base |
123,989,935 |
98,096,364 |
| Risk-weighted assets |
789,711,397 |
657,951,630 |
We are compliant with both regulatory and our own prudential requirements. We are also well positioned to meet future expected requirements as we continue to generate sufficient cash flows to support our growth aspirations and business needs.
Capital management process
ICAAP supports the regulatory review process providing valuable inputs for evaluating the required capital in line with future business plans. It integrates strategic plans and risk management plans with the capital plan in a meaningful manner with inputs from Senior Management, Management Committees, Board Committees and the Board. It also supports profit optimisation through proactive decisions on exposures both current and potential through measurement of vulnerabilities by carrying out stress testing and scenario-based analysis. The ICAAP process also identifies gaps in managing qualitative and quantitative aspects of reputational risk and strategic risk which are not covered under Pillar 1 of Basel II.
Basel III minimum capital requirements and buffers
The Banking Act Direction No. 01 of 2016 introduced capital requirements under Basel III for licensed commercial banks commencing from July 1, 2017 with specified timelines to increase minimum capital ratios to be fully-implemented by January 1, 2019.
A comparison of the position as at December 31, 2017 and the minimum capital requirement prescribed by the CBSL effective from January 1, 2019 as given below demonstrates the capital strength of the Bank and bears testimony to the ability to meet stringent requirements imposed by the regulator.
Table – 52
Basel III readiness
| Ratios (%) |
Bank’s position as
at 31.12.2017 |
Minimum capital
ratio prescribed
by CBSL by
01.01.2019 |
Common Equity Tier 1 (CETI ) including Capital
Conservation Buffer (CCB) and Capital Surcharge on
Domestic Systemically Important Banks (D-SIBs) |
12.12 |
8.50 |
| Total Tier 1 including CCB and Capital Surcharge on D-SIBs |
12.12 |
10.00 |
Total Capital including CCB and Capital Surcharge
on D-SIBs |
15.70 |
14.00 |
Through a rights issue of shares, the Bank raised Rs. 10 Bn. in CET 1 capital during the year. However, the Bank foresees challenges in meeting the increasing capital requirements in the years to come. In this regard, it is relevant to mention here that both the SLFRS 9 implementation and the Debt Repayment Levy proposed in the Government budget 2018 which is to be borne by the financial institutions are expected to have a significant impact on the internal capital generation capabilities of the Bank.
Going forward, the Bank will explore the possibility of raising capital by issuing Basel III compliant debt securities. Details of the debentures that were issued prior to Basel III guidelines (effective from July 1, 2017), and considered as qualifying instruments during the transition period are given in the Note 52 to the Financial Statements.
‘Basel Workgroup’ of the Bank consists of representation from members from a cross-section of business units and supporting units that work as a team to ascertain levels of capital adequacy in line with strategic direction of the Bank. While ICAAP acts as a foundation for such assessment, the Basel Workgroup is constantly on the lookout for improvements amidst changing landscape in different frontiers, to recommend to the ALCO on the desired way forward including indications on current and future capital needs, anticipated capital expenditure based assessments and desirable capital levels, etc. The Bank is aware of the importance of capital as a scarce and valuable resource. The Bank has access to contributions from shareholders as well as to built up capital over a period of time by adopting prudent dividend policies, ploughing back a portion of the profits, etc. In addition, the Bank is continuously finding ways to improve judicious allocation of capital to requirements associated with the day-to-day activities so that an optimised level of capital allocation can be achieved. The challenges associated with mobilising capital from external sources are also given due cognisance, but not excluded as a sustainable option to boost the capital in the long run. The Bank is reasonably comfortable with the current and future availability of capital buffer to withstand an ambitious growth/ stressed market conditions, but not complacent with current comfort levels and believe in providing stakeholder confidence that the Bank is known for, through sound capital buffer levels.
Stress testing
An integral part of ICAAP under Pillar II, stress testing is used to evaluate the sensitivity of the current and forward risk profile relative to risk appetite. It also supports a number of business processes, including strategic planning, the ICAAP including capital management, liquidity management, setting of risk appetite triggers and risk tolerance limits, mitigating risks through actions such as reviewing and changing limits, limiting or reducing exposures and hedging thereof, facilitating the development of risk mitigation or contingency plans across a range of stressed conditions supporting communication with internal and external stakeholders.
The Bank’s Stress Testing Governance Framework sets out the responsibilities for and approaches to stress testing activities which are conducted at Bank, business line and risk type level. The Bank’s stress testing programme uses one or a combination of stress testing techniques, including scenario analysis, sensitivity analysis and reverse stress testing to perform stress testing for different purposes.
The framework covers all the material risks such as credit risk, credit concentration risk, operational risk, liquidity risk, FX risk, IRRBB using EVE and EAR perspectives. The Bank looks at different degrees of stress levels which are defined as Minor, Moderate and Severe stress levels in the Stress Testing Policy. The resultant impact on the capital through these stress tests is carefully analysed. If the stress tests bring about a deterioration of the capital which has no impact on the policy level on capital maintenance, same is defined as minor risk, while a deterioration of up to 1% is considered moderate risk. If the impact results in the capital falling below the statutory requirement such a level
will be considered severe risk, warranting immediate attention of the Management to rectify the situation.
As it provides a broader view of all risks borne by the Bank in relation to its risk tolerance and strategy in a hypothetical stress situation, stress testing has become an effective communication tool to Senior Management, risk owners and risk managers as well as supervisors and regulators. The results of the stress testing are reported to the EIRMC and BIRMC on a quarterly basis for appropriate, proactive decision making. Extracts from the stress testing results are set out in Table 53.
Table – 53
Impact on CAR at minor, moderate and severe stress levels
|
|
2017 |
2016 |
| Particulars |
Description |
Minor
% |
Moderate
% |
Severe
% |
Minor
% |
Moderate
% |
Severe
% |
| Credit risk – asset
quality downgrade |
Increasing the direct non-performing facilities over the direct performing facilities for the entire portfolio |
-0.15 |
-0.37 |
-0.73 |
-0.14 |
-0.36 |
-0.71 |
| Operational risk |
Impact of;
1. Top five operational losses during last five years
2. Average of yearly operational risk losses during last three years
whichever is higher |
-0.07 |
-0.17 |
-0.34 |
-0.01 |
-0.03 |
-0.05 |
| Foreign exchange risk |
% shock in the exchange rates for the Bank and Maldives operations (gross positions in each book without netting) |
-0.05 |
-0.09 |
-0.13 |
-0.06 |
-0.10 |
-0.15 |
Liquidity risk (LKR) –
Sri Lanka |
1. Withdrawal of % of the clients, banks and other banking institution deposits from the Bank within a period of three months
2. Rollover of loans to a period greater than three months |
-0.09 |
-0.25 |
-0.50 |
-0.24 |
-0.53 |
-0.83 |
Interest rate risk –
EAR and EVE (LKR) –
Sri Lanka |
To assess the long-term impact of changes in interest rates on Bank’s EVE through changes in the economic value of its assets and liabilities and to assess the immediate impact of changes in interest rates on Bank’s earnings through changes in its Net Interest Income |
-0.05 |
-0.09 |
-0.14 |
-1.33 |
-2.45 |
-3.42 |
Capital adequacy computation – Group
1. Capital Adequacy Ratios
1.1 Common equity Tier 1 (CET 1 ) capital ratio
| As at December 31, |
2017
Rs. ’000 |
2016
Rs. ’000 |
| Common equity Tier 1 (CET 1 ) Capital (Refer Note 2.1) |
95,725,306 |
68,863,850 |
| Total risk weighted amount (Refer Note 3) |
789,711,397 |
657,951,630 |
| Common equity Tier 1 (CET 1 ) capital ratio (minimum requirement 6.25%) (%) |
12.12 |
10.47 |
1.2 Total Tier 1 capital ratio
| As at December 31, |
2017
Rs. ’000 |
2016
Rs. ’000 |
| Total Tier 1 capital [Refer Note 2.2] |
95,725,306 |
68,863,850 |
| Total risk weighted amount [Refer Note 3] |
789,711,397 |
657,951,630 |
| Total Tier 1 capital ratio (minimum requirement 7.75%) (%) |
12.12 |
10.47 |
1.3 Total capital ratio
| As at December 31, |
2017
Rs. ’000 |
2016
Rs. ’000 |
| Total capital [Refer Note 2.3] |
123,989,935 |
98,096,364 |
| Total risk-weighted amount [Refer Note 3] |
789,711,397 |
657,951,630 |
| Total capital ratio (Minimum requirement 11.75%) (%) |
15.70 |
14.91 |
2. Computation of Capital
2.1 Computation of common equity Tier 1 (CET 1) capital
| As at December 31, |
2017
Rs. ’000 |
2016
Rs. ’000 |
| Common Equity Tier 1 (CET 1) capital |
95,725,306 |
68,863,850 |
| Total Common Equity Tier 1 (CET 1) capital |
96,980,344 |
69,996,519 |
| Equity capital or stated capital/assigned capital |
37,143,541 |
24,977,700 |
| Reserve fund |
6,492,552 |
5,647,993 |
| Published retained earnings/(Accumulated retained losses) |
1,783,969 |
1,518,984 |
| Accumulated other comprehensive income (OCI) |
(1,501,321) |
(6,692,495) |
| General and other disclosed reserves |
52,799,820 |
43,910,281 |
| Ordinary shares issued by consolidated banking and financial subsidiaries and held by third parties |
261,783 |
634,056 |
| Total Adjustments to CET 1 capital |
1,255,038 |
1,132,669 |
| Goodwill (net) |
400,045 |
400,045 |
| Other intangible assets (net) |
851,180 |
732,624 |
| Revaluation losses of property, plant and equipment |
3,813 |
– |
2.2 Computation of additional Tier 1 (AT1) capital
| As at December 31, |
2017
Rs. ’000 |
2016
Rs. ’000 |
| Common Equity Tier 1 (CET 1 ) capital [Refer Note 2.1] |
95,725,306 |
68,863,850 |
| Total additional Tier 1 (AT1) capital |
– |
– |
| Qualifying additional Tier 1 capital instruments |
– |
– |
| Instruments issued by consolidated banking and financial subsidiaries of the Bank and held by third parties |
– |
– |
| Total sdjustments to AT1 capital |
– |
– |
| Investment in own shares |
– |
– |
| Reciprocal cross holdings in AT1 capital instruments |
– |
– |
Investments in the capital of banking and financial institutions where the bank does not own more than
10 per cent of the issued ordinary share capital of the entity |
– |
– |
Significant investments in the capital of banking and financial institutions where the bank own more than
10 per cent of the issued ordinary share capital of the entity |
– |
– |
| Regulatory adjustments applied to AT1 due to insufficient Tier 2 capital to cover adjustments |
– |
– |
| Total Tier 1 Capital |
95,725,306 |
68,863,850 |
2.3 Computation of total capital
| As at December 31, |
2017
Rs. ’000 |
2016
Rs. ’000 |
| Common equity Tier 1 capital [Refer Note 2.1] |
95,725,306 |
68,863,850 |
| Additional Tier 1 (AT1) capital [Refer Note 2.2] |
– |
– |
| Total Tier 2 capital |
28,264,629 |
29,232,514 |
| Qualifying Tier 2 capital instruments |
22,799,002 |
24,334,875 |
| Revaluation gains |
2,024,804 |
2,034,231 |
| General provisions |
3,440,823 |
2,863,408 |
| Total capital |
123,989,935 |
98,096,364 |
3. Computation of risk-weighted amount – RWA
| As at December 31, |
2017
Rs. ’000 |
2016
Rs. ’000 |
| Credit risk |
|
|
| RWA of On-Balance sheet assets [Refer Note 4.1] |
647,913,282 |
542,762,509 |
| RWA of Off-Balance sheet assets [Refer Note 4.2] |
77,587,693 |
60,169,944 |
| Total RWA for credit risk (a) |
725,500,975 |
602,932,453 |
| Market risk |
|
|
| Capital charge for interest rate risk |
354,758 |
226,153 |
| Capital charge for equities |
58,849 |
54,683 |
| Capital charge for foreign exchange and gold |
327,079 |
151,979 |
| Total capital charge for market risk |
740,686 |
432,815 |
| Total RWA for market risk (Total capital charge for market risk x CAR) (b) |
6,303,710 |
3,683,532 |
| Operational risk |
|
|
| Gross income |
|
|
| Year 1 |
41,020,866 |
35,273,703 |
| Year 2 |
44,349,587 |
41,018,522 |
| Year 3 |
50,710,320 |
44,346,540 |
| Average gross income |
45,360,258 |
40,212,922 |
|
|
|
| Total capital charge for operational risk – (Average gross income x 15%) |
6,804,039 |
6,031,938 |
| Total RWA for operational risk – (Total capital charge for operational risk x CAR) (c) |
57,906,712 |
51,335,645 |
| Total risk-weighted amount (a + b + c) |
789,711,397 |
657,951,630 |
4. Computation of RWA of On-Balance Sheet and Off-Balance Sheet items
4.1 Computation of RWA of on-balance sheet items
| As at December 31, |
|
2017 |
2016 |
|
Risk weight
factor
% |
Principal amount
of On-Balance
sheet items
Rs. ’000 |
Risk weighted
amount
Rs. ’000 |
Principal amount
of On-Balance
sheet items
Rs. ’000 |
Risk weighted
amount
Rs. ’000 |
| Total risk weighted amount for credit risk |
|
1,060,402,543 |
647,913,282 |
953,788,767 |
542,762,509 |
| Claims on Government and Central Bank of Sri Lanka |
0 |
294,231,073 |
– |
304,463,654 |
– |
| Claims on foreign sovereigns and their central banks |
0-150 |
20,197,669 |
20,197,669 |
14,828,182 |
14,828,182 |
| Claims on public sector entities (pses) |
20-150 |
16,913 |
16,913 |
8,137 |
8,137 |
| Claims on Banks |
0-150 |
29,324,762 |
18,798,415 |
27,621,363 |
16,462,840 |
| Claims on financial institutions |
20-150 |
29,093,851 |
13,947,299 |
30,283,774 |
13,081,513 |
| Claims on corporates |
20-150 |
356,378,524 |
340,525,766 |
284,911,325 |
277,008,403 |
| Retail claims |
0-100 |
204,755,354 |
169,019,740 |
185,320,826 |
146,093,718 |
| Claims secured by residential property |
50-100 |
61,278,959 |
46,757,354 |
54,430,398 |
43,784,768 |
| Non-performing assets (npas) |
50-150 |
6,889,792 |
8,911,843 |
6,559,370 |
8,820,073 |
| Cash items |
0-20 |
29,727,440 |
1,230,076 |
23,958,602 |
1,271,740 |
| Property, plant and equipment |
100 |
16,421,471 |
16,421,471 |
11,675,438 |
11,675,438 |
| Other assets |
100 |
12,086,736 |
12,086,736 |
9,727,696 |
9,727,696 |
4.2 Computation of RWA of off-balance sheet assets
| As at December 31, |
|
2017 |
2016 |
|
Credit
conversion
factor
% |
Principal amount
of off-balance
sheet items
Rs. ’000 |
Risk
weighted
amount
Rs. ’000 |
Principal amount
of off-balance
sheet items
Rs. ’000 |
Risk weighted
amount
Rs. ’000 |
| Off-balance Sheet items |
|
523,762,051 |
77,587,693 |
458,326,443 |
60,169,944 |
| Claims on Banks |
|
|
|
|
|
| (a) Foreign exchange contracts |
|
180,595,429 |
835,117 |
176,228,611 |
1,003,151 |
| (i) Original maturity – Less than one year |
2 |
176,726,053 |
768,333 |
176,228,611 |
1,003,151 |
| (ii) Original maturity – More than one year and less than two years |
5 |
3,869,376 |
66,784 |
– |
– |
| Claims on corporates |
|
|
|
|
|
| (a) Direct credit substitutes |
100 |
29,015,341 |
25,177,541 |
21,068,556 |
18,265,104 |
| (i) General guarantees of indebtedness |
|
29,015,341 |
25,177,541 |
21,068,556 |
18,265,104 |
| (b) Transaction-related contingencies |
50 |
27,350,464 |
12,973,789 |
19,742,310 |
9,196,436 |
| (i) Performance bonds, bid bonds and warranties |
|
27,350,464 |
12,973,789 |
19,742,310 |
9,196,436 |
| (ii) Others |
|
– |
– |
– |
– |
| (c) Short-term self-liquidating trade-related contingencies |
20 |
90,792,584 |
17,555,825 |
60,508,393 |
11,846,911 |
| (i) Shipping guarantees |
|
8,763,204 |
1,744,464 |
1,625,728 |
283,712 |
| (ii) Documentary letters of credit |
|
41,707,879 |
7,949,343 |
32,920,889 |
6,370,844 |
| (iii) Trade-related acceptances |
|
40,321,501 |
7,862,018 |
25,961,776 |
5,192,355 |
| (iv) Others |
|
– |
– |
– |
– |
| (d) Foreign exchange contracts |
|
52,349,856 |
662,202 |
52,429,672 |
688,146 |
| (i) Original maturity – Less than one year |
2 |
40,398,616 |
521,314 |
47,395,225 |
634,094 |
| (ii) Original maturity – More than one year and less than two years |
5 |
11,951,240 |
140,888 |
5,034,447 |
54,052 |
| Retail claims |
|
|
|
|
|
| (a) Direct credit substitutes |
100 |
8,809,529 |
4,709,620 |
6,927,352 |
3,817,954 |
| (i) General guarantees of indebtedness |
|
8,809,529 |
4,709,620 |
6,927,352 |
3,817,954 |
| (b) Transaction-related contingencies |
50 |
3,254,243 |
768,369 |
2,810,750 |
762,451 |
| (i) Performance bonds, bid bonds and warranties |
|
3,254,243 |
768,369 |
2,810,750 |
762,451 |
| (c) Short-term self-liquidating trade-related contingencies |
20 |
3,617,575 |
504,326 |
3,427,238 |
523,407 |
| (i) Shipping guarantees |
|
247,140 |
28,399 |
125,733 |
16,358 |
| (ii) Documentary letters of credit |
|
3,370,435 |
475,927 |
3,301,505 |
507,049 |
| (iii) Trade related acceptances |
|
– |
– |
– |
– |
| (iv) Others |
|
– |
– |
– |
– |
Other commitments with an original maturity of up to one year
or which can be unconditionally cancelled at any time |
0 |
98,236,200 |
– |
86,858,200 |
– |
| Undrawn term loans |
|
– |
– |
– |
– |
| Undrawn overdraft facilities/unused credit card lines |
|
74,929,577 |
– |
67,597,434 |
– |
| Others |
|
23,306,623 |
– |
19,260,766 |
– |
| Commitments with an original maturity up to 1 year |
20 |
1,565,036 |
313,007 |
320,988 |
64,198 |
| Undrawn term loans |
|
1,565,036 |
313,007 |
320,988 |
64,198 |
| Undrawn overdraft facilities/unused credit card lines |
|
– |
– |
– |
– |
| Others |
|
– |
– |
– |
– |
| Other commitments with an original maturity of over one year |
50 |
28,175,794 |
14,087,897 |
28,004,372 |
14,002,186 |
| Undrawn term loans |
|
28,175,794 |
14,087,897 |
28,004,372 |
14,002,186 |
| Undrawn overdraft facilities/unused credit card lines |
|
– |
– |
– |
– |
| Others |
|
– |
– |
– |
– |
Basel III – Market Discipline – Minimum Disclosure requirement Under Pillar 3 as per the Banking Act Direction No. 01 of 2016
Template 01
Key regulatory ratios – Capital and liquidity
|
GROUP |
BANK |
| As at December 31, |
2017 |
2016 |
2017 |
2016 |
|
Rs. ’000 |
Rs. ’000 |
Rs. ’000 |
Rs. ’000 |
| Regulatory capital |
|
|
|
|
| Common equity Tier 1 |
95,725,306 |
68,863,841 |
94,151,253 |
67,284,572 |
| Tier 1 capital |
95,725,306 |
68,863,841 |
94,151,253 |
67,284,572 |
| Total capital |
123,989,935 |
98,096,355 |
122,415,882 |
96,517,086 |
| Regulatory capital ratios (%) |
|
|
|
|
Common equity Tier 1 capital ratio (minimum requirement -6.25%)
(with effect from July 1, 2017) (%) |
12.12 |
10.47 |
12.11 |
10.37 |
| Tier 1 Capital Ratio (minimum requirement -7.75%) (with effect from July 1, 2017) (%) |
12.12 |
10.47 |
12.11 |
10.37 |
| Total Capital Ratio (minimum requirement -11.75%) (with effect from July 1, 2017) (%) |
15.70 |
14.91 |
15.75 |
14.87 |
| Regulatory liquidity |
|
|
|
|
| Statutory liquid assets (Rs. ‘000) |
|
|
243,945,792 |
211,363,134 |
| Statutory liquid assets ratio (minimum requirement -20% ) |
|
|
|
|
| Domestic banking unit (%) |
|
|
27.28 |
27.19 |
| Off-shore banking unit (%) |
|
|
30.95 |
30.19 |
Liquidity coverage ratio (%) – Rupee
(Minimum requirement – 80%) (with effect from January 1, 2017) |
|
|
272.15 |
196.34 |
Liquidity coverage ratio (%) – All currency
(Minimum requirement – 80%) (with effect January 1, 2017) |
|
|
209.17 |
150.93 |
Template 02
Key Regulatory Ratios – Capital and Liquidity
|
GROUP |
BANK |
| As at December 31, |
2017 |
2016 |
2017 |
2016 |
|
Rs. ’000 |
Rs. ’000 |
Rs. ’000 |
Rs. ’000 |
| Common equity Tier 1 (CETI) capital after adjustments |
95,725,306 |
68,863,841 |
94,151,253 |
67,284,572 |
| Total common equity Tier 1 (CET1) capital |
96,980,344 |
69,996,510 |
96,696,269 |
69,368,825 |
| Equity capital (stated capital)/assigned capital |
37,143,541 |
24,977,700 |
37,143,541 |
24,977,700 |
| Reserve fund |
6,492,552 |
5,647,993 |
6,476,952 |
5,647,890 |
| Published retained earnings/(accumulated retained losses) |
1,783,969 |
1,518,984 |
1,798,112 |
1,538,142 |
| Published accumulated Other Comprehensive Income (OCI) |
(1,501,321) |
(6,692,504) |
(1,522,156) |
(6,705,188) |
| General and other disclosed reserves |
52,799,820 |
43,910,281 |
52,799,820 |
43,910,281 |
| Unpublished current year’s profit/(losses) and gains reflected in OCI |
– |
– |
– |
– |
Ordinary shares issued by consolidated banking and financial subsidiaries
of the Bank and held by third parties |
261,783 |
634,056 |
– |
– |
| Total adjustments to CET1 Capital |
1,255,038 |
1,132,669 |
2,545,016 |
2,084,253 |
| Goodwill (net) |
400,045 |
400,045 |
– |
– |
| Intangible Assets (net) |
851,180 |
732,624 |
776,812 |
640,646 |
| Revaluation losses of property, plant and equipment |
3,813 |
– |
3,813 |
– |
| Significant investments in the capital of financial institutions where the Bank owns more than 10 per cent of the issued ordinary share capital of the entity |
– |
– |
1,764,391 |
1,443,607 |
| Additional Tier 1 (AT1) capital after adjustments |
– |
– |
– |
– |
| Total additional Tier 1 (AT1) capital |
– |
– |
– |
– |
| Qualifying additional Tier 1 capital instruments |
– |
– |
– |
– |
Instruments issued by consolidated banking and financial subsidiaries of the
bank and held by third parties |
– |
– |
– |
– |
| Total adjustments to AT1 capital |
– |
– |
– |
– |
| Investment in own shares |
– |
– |
– |
– |
| Others (specify) |
– |
– |
– |
– |
| Tier 2 capital after adjustments |
28,264,629 |
29,232,514 |
28,264,629 |
29,232,514 |
| Total Tier 2 capital |
28,264,629 |
29,232,514 |
28,264,629 |
29,232,514 |
| Qualifying Tier 2 capital instruments |
22,799,002 |
24,334,875 |
22,799,002 |
24,334,875 |
| Revaluation gains |
2,024,804 |
2,034,231 |
2,024,804 |
2,034,231 |
| Loan loss provisions |
3,440,823 |
2,863,408 |
3,440,823 |
2,863,408 |
Instruments issued by consolidated banking and financial subsidiaries of
the Bank and held by third parties |
– |
– |
– |
– |
| Total adjustments to Tier 2 capital |
– |
– |
– |
– |
| Investment in own shares |
– |
– |
– |
– |
| Others (specify) |
– |
– |
– |
– |
| CET 1 capital |
95,725,306 |
68,863,841 |
94,151,253 |
67,284,572 |
| Total Tier 1 capital |
95,725,306 |
68,863,841 |
94,151,253 |
67,284,572 |
| Total capital |
123,989,935 |
98,096,355 |
122,415,882 |
96,517,086 |
|
GROUP |
BANK |
| As at December 31, |
2017 |
2016 |
2017 |
2016 |
|
Rs. ’000 |
Rs. ’000 |
Rs. ’000 |
Rs. ’000 |
| Total risk-weighted amount |
789,711,397 |
657,951,626 |
777,427,117 |
649,014,208 |
| Risk-weighted amount for credit Risk |
725,500,975 |
602,932,452 |
713,765,370 |
594,260,342 |
| Risk-weighted amount for market risk |
6,303,710 |
3,683,529 |
6,303,710 |
3,683,529 |
| Risk-weighted amount for operational risk |
57,906,712 |
51,335,645 |
57,358,037 |
51,070,336 |
CET 1 capital ratio (including capital conservation buffer, countercyclical capital
buffer and surchage on D-SIBs) (%) |
12.12 |
10.47 |
12.11 |
10.37 |
| Of which: capital conservation buffer (%) |
|
|
|
|
| Of which: countercyclical buffer (%) |
|
|
|
|
| Of which: capital surcharge on D-SIBs (%) |
|
|
|
|
| Total Tier 1 capital ratio (%) |
12.12 |
10.47 |
12.11 |
10.37 |
| Total capital ratio (including capital conservation buffer, countercyclical capital buffer and surcharge on D-SIBs) (%) |
15.70 |
14.91 |
15.75 |
14.87 |
| Of which: capital consevation buffer (%) |
|
|
|
|
| Of which: countercyclical buffer (%) |
|
|
|
|
| Of which: capital surcharge on D-SIBs (%) |
|
|
|
|
Template 03
Computation of Leverage Ratio
|
Group |
Bank |
| As at December 31, 2017 |
Rs. ’000 |
Rs. ’000 |
| Tier 1 capital |
95,725,306 |
94,151,253 |
| Total exposures |
1,626,970,079 |
1,613,561,019 |
On-balance sheet items (excluding derivatives and securities financing transactions,
but including collateral) |
1,151,136,046 |
1,137,316,666 |
| Derivative exposures |
328,406,037 |
328,817,950 |
| Securities financing transaction exposures |
61,017,837 |
61,017,837 |
| Other off-balance sheet exposures |
86,410,159 |
86,408,566 |
| Basel III leverage ratio (%) (Tier 1/total exposure) |
5.88 |
5.83 |
Leverage ratio is prepared based on the consultation paper issued by the Central Bank of Sri Lanka. As per the paper minimum leverage ratio is 4%.
Template 04
Basel III Computation of Liquidity Coverage Ratio – All currency
| As at December 31, |
2017 |
2016 |
|
Total
un-weighted
value
Rs. ’000 |
Total
weighted
value
Rs. ’000 |
Total
un-weighted
value
Rs. ’000 |
Total
weighted
value
Rs. ’000 |
| Total stock of High Quality Liquid Assets (HQLA) |
167,783,592 |
167,583,281 |
139,200,928 |
139,088,165 |
| Total adjusted level 1 assets |
167,382,970 |
167,382,970 |
138,975,487 |
138,975,487 |
| Level 1 assets |
167,382,970 |
167,382,970 |
138,975,402 |
138,975,402 |
| Total adjusted level 2a assets |
– |
– |
– |
– |
| Level 2A assets |
– |
– |
– |
– |
| Total adjusted level 2b assets |
400,622 |
200,311 |
225,526 |
112,763 |
| Level 2B assets |
400,622 |
200,311 |
225,526 |
112,763 |
| Total cash outflows |
1,126,874,188 |
204,822,466 |
977,707,604 |
182,098,299 |
| Deposits |
647,140,480 |
64,714,048 |
552,552,387 |
55,255,239 |
| Unsecured wholesale funding |
228,997,705 |
111,382,639 |
208,051,363 |
101,309,555 |
| Secured funding transaction |
– |
– |
– |
– |
Undrawn portion of committed (irrevocable) facilities and other contingent
funding obligations |
250,736,003 |
28,725,779 |
216,807,539 |
25,237,190 |
| Additional requirements |
– |
– |
296,315 |
296,315 |
| Total cash inflows |
190,872,659 |
124,705,986 |
135,948,605 |
89,947,218 |
| Maturing secured lending transactions backed by the following collateral |
37,491,907 |
37,069,704 |
35,782,810 |
35,325,892 |
| Committed facilities |
– |
– |
– |
– |
| Other inflows by counterparty which are maturing within 30 days |
74,594,943 |
47,223,317 |
59,398,731 |
38,837,257 |
| Operational deposits |
11,301,982 |
– |
9,198,927 |
– |
| Other cash inflows |
67,483,827 |
40,412,965 |
31,568,137 |
15,784,069 |
Liquidity coverage ratio (%) (stock of high quality liquid assets/
total net cash outflows over the next 30 calendar days)*100 |
|
209.17 |
|
150.93 |
Template 05
Main Features of Regulatory Capital Instruments
| Description of the Capital Instrument |
Stated Capital |
Debentures –
Type “A” – 1 |
Debentures –
Type “A” – 2 |
Debentures –
Type “B” – 1 |
Debentures –
Type “B” – 2 |
IFC Borrowings |
| Issuer |
Commercial Bank |
Commercial Bank |
Commercial Bank |
Commercial Bank |
Commercial Bank |
International
Finance
Corporation |
Unique Identifier (e.g., ISIN or Bloomberg
identifier for private placement) |
|
|
|
|
|
|
| Governing law(s) of the instrument |
Sri Lanka |
Sri Lanka |
Sri Lanka |
Sri Lanka |
Sri Lanka |
United States of
America |
| Original date of issuance |
N/A |
March 8, 2016 |
October 27, 2016 |
March 8, 2016 |
October 27, 2016 |
March 13, 2013 |
| Par Value of instrument |
|
Rs. 100/- |
Rs. 100/- |
Rs. 100/- |
Rs. 100/- |
|
| Perpetual or dated |
Perpetual |
Dated |
Dated |
Dated |
Dated |
Dated |
| Original maturity date, if applicable |
N/A |
March 8, 2021 |
October 27, 2021 |
March 8, 2026 |
October 27, 2026 |
March 14, 2023 |
Amount recognised in regulatory capital
(in Rs. ’000 as at the reporting date) |
37,143,541 |
3,544,272 |
4,057,440 |
1,749,090 |
1,928,200 |
11,520,000 |
| Accounting classification (equity/liability) |
Equity |
Liability |
Liability |
Liability |
Liability |
Liability |
Issuer call subject to prior
supervisory approval |
No |
No |
No |
No |
No |
No |
| Optional call date, contingent call dates and redemption amount (Rs. ’000) |
N/A |
N/A |
N/A |
N/A |
N/A |
N/A |
| Subsequent call dates, if applicable |
N/A |
N/A |
N/A |
N/A |
N/A |
N/A |
| Coupons/dividends |
|
|
|
|
|
|
| Fixed or floating dividend/coupon |
N/A |
Fixed |
Fixed |
Fixed |
Fixed |
Floating |
| Coupon rate and any related index |
|
10.75% |
12.00% |
11.25% |
12.25% |
06 Months
LIBOR + 5.75% |
| Non-cumulative or cumulative |
|
|
|
|
|
|
| Convertible or non-convertible |
|
|
|
|
|
|
| If convertible, conversion trigger(s) |
N/A |
N/A |
N/A |
N/A |
N/A |
N/A |
| If convertible, fully or partially |
N/A |
N/A |
N/A |
N/A |
N/A |
N/A |
| If convertible, mandatory or optional |
N/A |
N/A |
N/A |
N/A |
N/A |
N/A |
| If convertible, conversion rate |
N/A |
N/A |
N/A |
N/A |
N/A |
N/A |
Template 06
Summary Discussion on Adequacy/Meeting Current and Future Capital Requirements
Bank prepares the Corporate Plan and Budget on a rolling basis covering a period of 5 years which includes the computation of Capital Adequacy ratios (CARs). The Bank carefully analyses the CARs against increases in risk-weighted assets underlying the budgeted expansion of business volumes. The Bank has set up an internal guideline on minimum CARs and ensures that measures to improve the CARs are also built into the budget should the CARs are expected to fall below that. These measures could either be to increase the CET 1 or raise Tier 2 debt capital. Further, in extreme situations, the Bank will deliberate on strategically curtailing risk weighted assets expansion.
Budgeting process of the Bank encapsulates all future capital requirements and finalises the process only after reaching the desired level of capital as well as the CARs.
Besides, the Bank has a dynamic ICAAP process with rigorous stress testing embodied in it in addition to taking into consideration the qualitative aspects such as reputational and strategic risks. This process also proactively identifies the gaps in CARs in advance, allowing the Bank to take calculated decisions to optimise utilisation of capital.
The Bank has a well-diversified assets portfolio which is neither overly exposed to any counterparty nor to any sector. Ways and means of improving the CARs are being monitored on an ongoing basis.
The Bank always strives to achieve a reasonable growth in profit which is above the industry average and is ever mindful to pay a consistent stream of dividends to the shareholders. Part of the profit generated is retained for future business expansion. Given the size of the Bank, capital generated through retained profits over the years could be considered as one of the primary sources of capital to the Bank.
Template 07
Credit Risk under Standardised Approach
Credit risk exposures and Credit Risk Mitigation (CRM) Effects – Group
|
Exposures before Credit Conversion Factor (CCF) and CRM |
Exposures post CCF and CRM |
RWA and RWA density (%) |
| As at December 31, 2017 |
On-balance
sheet amount
Rs. ’000 |
Off-balance
sheet amount
Rs. ’000 |
On-balance
sheet amount
Rs. ’000 |
Off-Balance
sheet amount
Rs. ’000 |
RWA
Rs. ’000 |
RWA density
Rs. ’000 |
Claims on Central Government and
Central Bank of Sri Lanka |
294,231,073 |
59,904,000 |
294,231,073 |
1,198,080 |
– |
– |
| Claims on foreign sovereigns and their central banks |
20,197,669 |
– |
20,197,669 |
– |
20,197,669 |
100.00 |
| Claims on Public Sector Entities (PSEs) |
16,913 |
– |
16,913 |
– |
16,913 |
100.00 |
Claims on official entities and Multilateral
Development Banks (MDBs) |
– |
– |
– |
– |
– |
– |
| Claims on banks exposures |
29,324,762 |
120,983,865 |
29,324,762 |
2,529,910 |
19,633,530 |
61.63 |
| Claims on financial institutions |
29,093,851 |
– |
29,093,851 |
– |
13,947,299 |
47.94 |
| Claims on corporates |
410,043,431 |
327,192,837 |
356,378,524 |
72,569,315 |
411,296,028 |
95.88 |
| Retail claims |
242,433,300 |
15,681,348 |
204,755,354 |
7,847,448 |
175,002,056 |
82.31 |
| Claims secured by residential property |
61,278,959 |
– |
61,278,959 |
– |
46,757,354 |
76.30 |
| Claims secured by commercial real estate |
– |
– |
– |
– |
– |
– |
| Non-Performing Assets (NPAs) |
6,889,792 |
– |
6,889,792 |
– |
8,911,843 |
129.35 |
| Higher-risk categories |
– |
– |
– |
– |
– |
– |
| Cash Items and other assets |
58,235,647 |
– |
58,235,647 |
– |
29,738,283 |
51.07 |
| Total |
1,151,745,396 |
523,762,050 |
1,060,402,543 |
84,144,753 |
725,500,975 |
63.39 |
Credit Risk Exposures and Credit Risk Mitigation (CRM) Effects – Bank
|
Exposures before Credit Conversion Factor (CCF) and CRM |
Exposures post CCF and CRM |
RWA and RWA density (%) |
| As at December 31, 2017 |
On-balance
sheet amount
Rs. ’000 |
Off-balance
sheet amount
Rs. ’000 |
On-balance
sheet amount
Rs. ’000 |
Off-balance
sheet amount
Rs. ’000 |
RWA
Rs. ’000 |
RWA density
(%) |
Claims on Central Government and
Central Bank of Sri Lanka |
294,031,685 |
59,904,000 |
294,031,685 |
1,198,080 |
– |
– |
| Claims on foreign sovereigns and their central banks |
13,649,722 |
– |
13,649,722 |
– |
13,649,722 |
100.00 |
| Claims on Public Sector Entities (PSEs) |
16,913 |
– |
16,913 |
– |
16,913 |
100.00 |
| Claims on official entities and Multilateral Development Banks (MDBs) |
– |
– |
– |
– |
– |
– |
| Claims on banks exposures |
28,172,419 |
120,983,865 |
28,172,419 |
2,535,758 |
18,487,036 |
60.20 |
| Claims on financial institutions |
29,093,851 |
– |
29,093,851 |
– |
13,947,299 |
47.94 |
| Claims on corporates |
405,766,848 |
327,482,087 |
352,101,941 |
72,567,722 |
407,017,852 |
95.84 |
| Retail claims |
242,433,300 |
15,681,348 |
204,755,354 |
7,847,448 |
175,002,056 |
82.31 |
| Claims secured by residential property |
61,278,959 |
– |
61,278,959 |
– |
46,757,354 |
76.30 |
| Claims secured by commercial real estate |
– |
– |
– |
– |
– |
– |
| Non-Performing Assets (NPAs) |
6,513,033 |
– |
6,513,033 |
– |
8,535,084 |
131.05 |
| Higher-risk categories |
957,101 |
– |
957,101 |
– |
2,392,752 |
250.00 |
| Cash items and other assets |
56,160,204 |
– |
56,160,204 |
– |
27,959,303 |
49.78 |
| Total |
1,138,074,034 |
524,051,300 |
1,046,731,182 |
84,149,008 |
713,765,370 |
63.12 |
Template 08
Credit Risk under Standardised Approach
Exposures by Asset Classes and Risk Weights (Post CCF and CRM) – Group
| As at December 31, 2017 |
Risk weight |
| Asset class |
0%
Rs. ’000 |
20%
Rs. ’000 |
50%
Rs. ’000 |
60%
Rs. ’000 |
75%
Rs. ’000 |
100%
Rs. ’000 |
150%
Rs. ’000 |
>150%
Rs. ’000 |
Total credit
exposures
amount
Rs. ’000 |
| Claims on Central Government and Central Bank of Sri Lanka |
295,429,153 |
– |
– |
– |
– |
– |
– |
– |
295,429,153 |
| Claims on foreign sovereigns and their central banks |
– |
– |
– |
– |
– |
20,197,669 |
– |
– |
20,197,669 |
| Claims on Public Sector Entities (PSEs) |
– |
– |
– |
– |
– |
16,913 |
– |
– |
16,913 |
| Claims on official entities and Multilateral Development Banks(MDBs) |
– |
– |
– |
– |
– |
– |
– |
– |
– |
| Claims on banks exposures |
– |
6,187,529 |
14,542,236 |
– |
– |
11,124,906 |
– |
– |
31,854,672 |
| Claims on financial institutions |
– |
2,919,555 |
25,621,814 |
– |
– |
552,481 |
– |
– |
29,093,851 |
| Claims on corporates |
– |
14,406,322 |
12,253,508 |
– |
– |
402,288,010 |
– |
– |
428,947,839 |
| Retail claims |
603,259 |
617,735 |
– |
8,063,619 |
133,111,405 |
70,206,784 |
– |
– |
212,602,802 |
| Claims secured by residential property |
– |
– |
29,043,211 |
– |
– |
32,235,749 |
– |
– |
61,278,959 |
| Claims secured by commercial real estate |
– |
– |
– |
– |
– |
– |
– |
– |
– |
| Non-Performing Assets (NPAs) |
– |
– |
23,774 |
– |
– |
2,798,141 |
4,067,876 |
– |
6,889,792 |
| Higher-risk categories |
– |
– |
– |
– |
– |
– |
– |
– |
– |
| Cash items and other assets |
23,577,061 |
6,150,379 |
– |
– |
– |
28,508,207 |
– |
– |
58,235,647 |
| Total |
319,609,473 |
30,281,519 |
81,484,544 |
8,063,619 |
133,111,405 |
567,928,859 |
4,067,876 |
– |
1,144,547,296 |
Exposures by Asset Classes and Risk Weights (Post CCF and CRM) – Bank
| As at December 31, 2017 |
Risk weight |
| Asset class |
0%
Rs. ’000 |
20%
Rs. ’000 |
50%
Rs. ’000 |
60%
Rs. ’000 |
75%
Rs. ’000 |
100%
Rs. ’000 |
150%
Rs. ’000 |
>150%
Rs. ’000 |
Total credit
exposures
amount
Rs. ’000 |
| Claims on Central Government and Central Bank of Sri Lanka |
295,229,765 |
– |
– |
– |
– |
– |
– |
– |
295,229,765 |
Claims on foreign sovereigns and their
central banks |
– |
– |
– |
– |
– |
13,649,722 |
– |
– |
13,649,722 |
| Claims on Public Sector Entities (PSEs) |
– |
– |
– |
– |
– |
16,913 |
– |
– |
16,913 |
| Claims on official entities and Multilateral Development Banks(MDBs) |
– |
– |
– |
– |
– |
– |
– |
– |
– |
| Claims on banks exposures |
– |
6,187,529 |
14,542,236 |
– |
– |
9,978,412 |
– |
– |
30,708,177 |
| Claims on financial institutions |
– |
2,919,555 |
25,621,814 |
– |
– |
552,481 |
– |
– |
29,093,851 |
| Claims on corporates |
– |
14,406,322 |
12,253,508 |
– |
– |
398,009,833 |
– |
– |
424,669,663 |
| Retail claims |
603,259 |
617,735 |
– |
8,063,619 |
133,111,405 |
70,206,784 |
– |
– |
212,602,802 |
| Claims secured by residential property |
– |
– |
29,043,211 |
– |
– |
32,235,749 |
– |
– |
61,278,959 |
| Claims secured by Commercial real estate |
– |
– |
– |
– |
– |
– |
– |
– |
– |
| Non-Performing Assets (NPAs) |
– |
– |
23,774 |
– |
– |
2,421,382 |
4,067,876 |
– |
6,513,033 |
| Higher-risk categories |
– |
– |
– |
– |
– |
– |
– |
957,101 |
957,101 |
| Cash items and other assets |
23,280,599 |
6,150,379 |
– |
– |
– |
26,729,227 |
– |
– |
56,160,204 |
| Total |
319,113,623 |
30,281,519 |
81,484,544 |
8,063,619 |
133,111,405 |
553,800,503 |
4,067,876 |
957,101 |
1,130,880,190 |
Template 09
Market Risk under Standardised Measurement Method
|
GROUP |
BANK |
| As at December 31, |
2017 |
2016 |
2017 |
2016 |
|
Rs. ’000 |
Rs. ’000 |
Rs. ’000 |
Rs. ’000 |
| (a) Capital charge for interest rate risk |
354,758 |
226,153 |
354,758 |
226,153 |
| General interest rate risk |
150,553 |
107,288 |
150,553 |
107,288 |
| i. Net long or short position |
150,553 |
107,288 |
150,553 |
107,288 |
| ii. Horizontal disallowance |
– |
– |
– |
– |
| iii. Vertical disallowance |
– |
– |
– |
– |
| iv. Options |
– |
– |
– |
– |
| Specific Interest rate risk |
204,205 |
118,865 |
204,205 |
118,865 |
| (b) Capital charge for equity |
58,849 |
54,683 |
58,849 |
54,683 |
| i. General equity risk |
31,474 |
29,381 |
31,474 |
29,381 |
| ii. Specific equity risk |
27,375 |
25,302 |
27,375 |
25,302 |
| (c) Capital charge for foreign exchange & gold |
327,079 |
151,979 |
327,079 |
151,979 |
| (d) Capital charge for market risk [(a) + (b) + (c)] |
740,686 |
432,815 |
740,686 |
432,815 |
| Total risk-weighted amount for market risk [(d) x CAR] |
6,303,710 |
3,683,529 |
6,303,710 |
3,683,529 |
Template 10
Operational Risk under Basic Indicator Approach/The Standardised Approach/
The Alternative Standardised Approach – Bank Only
|
|
|
Gross income |
| As at December 31, 2017 |
Capital charge
factor |
Fixed factor |
1st year |
2nd year |
3rd year |
|
% |
|
Rs. ’000 |
Rs. ’000 |
Rs. ’000 |
| The basic indicator approach |
15 |
|
40,773,807 |
44,057,659 |
49,959,921 |
| The standardised approach |
|
|
40,773,807 |
44,057,659 |
49,959,921 |
| Corporate finance |
18 |
|
641,679 |
402,397 |
273,036 |
| Trading and sales |
18 |
|
3,281,656 |
3,771,864 |
766,081 |
| Payment and settlement |
18 |
|
437,001 |
511,789 |
591,811 |
| Agency services |
15 |
|
– |
– |
– |
| Asset management |
12 |
|
– |
– |
– |
| Retail brokerage |
12 |
|
– |
– |
– |
| Retail banking |
12 |
|
23,056,626 |
27,157,713 |
34,266,353 |
| Commercial banking |
15 |
|
13,356,845 |
12,213,896 |
14,062,640 |
| The alternative standardised approach |
|
|
710,934,264 |
805,169,696 |
935,463,626 |
| Corporate finance |
18 |
|
641,679 |
402,396 |
273,037 |
| Trading and sales |
18 |
|
3,281,656 |
3,771,864 |
766,081 |
| Payment and settlement |
18 |
|
437,001 |
511,789 |
591,811 |
| Agency services |
15 |
|
– |
– |
– |
| Asset management |
12 |
|
– |
– |
– |
| Retail brokerage |
12 |
|
– |
– |
– |
| Retail banking |
12 |
0.035 |
265,321,140 |
320,537,695 |
379,027,523 |
| Commercial banking |
15 |
0.035 |
441,252,788 |
479,945,953 |
554,805,175 |
| Capital charges for operational risk (Rs. ’000) |
|
|
|
|
|
| The basic indicator approach |
6,739,569 |
|
|
|
|
| The standardised approach |
6,001,536 |
|
|
|
|
| The alternative standardised approach |
4,574,487 |
|
|
|
|
| Risk-weighted amount for operational risk (Rs. ’000) |
|
|
|
|
|
| The basic indicator approach |
57,358,037 |
|
|
|
|
| The standardised approach |
51,076,898 |
|
|
|
|
| The alternative standardised approach |
38,931,801 |
|
|
|
|
Template 11
Differences between Accounting and Regulatory Scopes and Mapping of Financial Statement Categories with Regulatory Risk Categories – Bank Only
| As at December 31, 2017 |
Bank |
|
a |
b |
c |
d |
e |
|
Carrying values as
reported in published
Financial Statements |
Carrying values under
scope of regulatory
reporting |
Subject to credit risk
framework |
Subject to market risk
framework |
Not subject to capital
requirements or subject
to deduction from capital |
| Assets |
1,143,373,765 |
1,141,585,508 |
1,046,731,182 |
4,725,657 |
93,884,054 |
| Cash and cash equivalents |
33,224,619 |
33,224,329 |
33,224,329 |
– |
– |
| Balances with central banks |
44,801,446 |
44,801,446 |
44,801,446 |
– |
– |
| Placements with banks |
17,633,269 |
17,587,206 |
17,587,206 |
– |
– |
| Derivative financial assets |
2,334,536 |
– |
– |
– |
– |
| Other financial instruments – Held for trading |
4,410,913 |
4,410,913 |
– |
4,410,913 |
– |
| Loans and receivables to banks |
640,512 |
640,512 |
– |
– |
– |
| Loans and receivables to other customers |
737,446,567 |
737,582,655 |
650,635,697 |
– |
91,342,852 |
| Financial investments – Available for sale |
154,714,132 |
155,367,667 |
155,052,924 |
314,744 |
– |
| Financial investments – Held to maturity |
63,562,752 |
65,363,679 |
65,363,679 |
– |
– |
| Financial investments – Loans and receivables |
48,712,477 |
48,371,776 |
48,371,776 |
– |
– |
| Investments in subsidiaries |
3,065,935 |
3,065,935 |
1,301,544 |
– |
1,764,391 |
| Investments in associates and joint ventures |
44,331 |
44,331 |
44,331 |
– |
– |
| Property, plant and equipment |
14,707,304 |
14,707,304 |
14,707,306 |
– |
– |
| Intangible assets |
776,810 |
776,810 |
|
– |
776,810 |
| Other assets |
17,298,162 |
15,640,944 |
15,640,944 |
– |
– |
| Liabilities |
1,036,274,405 |
1,034,494,748 |
|
– |
– |
| Due to banks |
57,120,991 |
56,586,879 |
– |
– |
– |
| Derivative financial liabilities |
3,678,494 |
– |
– |
– |
– |
| Securities sold under repurchase agreements |
49,676,767 |
49,686,123 |
– |
– |
– |
| Due to other customers |
850,127,511 |
833,073,338 |
– |
– |
– |
| Other borrowings |
23,786,094 |
23,776,205 |
– |
– |
– |
| Current tax liabilities |
4,143,911 |
3,874,521 |
– |
– |
– |
| Deferred tax liabilities |
3,274,826 |
4,287,468 |
– |
– |
– |
| Other liabilities |
19,225,364 |
38,499,855 |
– |
– |
– |
| Due to subsidiaries |
74,523 |
74,523 |
– |
– |
– |
| Subordinated term debts |
25,165,924 |
24,635,836 |
– |
– |
– |
| Off-balance sheet liabilities |
564,794,885 |
564,794,885 |
84,149,008 |
– |
7,398,931 |
| Guarantees |
64,869,608 |
64,869,608 |
33,677,132 |
– |
5,949,807 |
| Performance bonds |
30,601,521 |
30,601,521 |
14,022,674 |
– |
1,278,087 |
| Letter of credit |
45,078,313 |
45,078,313 |
8,845,421 |
– |
170,242 |
| Other contingent items |
297,904,583 |
297,904,583 |
13,202,877 |
– |
796 |
| Undrawn loan commitments |
29,740,830 |
29,740,830 |
14,400,904 |
– |
– |
| Other commitments |
96,600,030 |
96,600,030 |
– |
– |
– |
| Shareholders’ equity |
107,099,360 |
107,090,763 |
– |
– |
– |
| Equity capital (stated capital)/assigned capital |
|
|
– |
– |
– |
| of which amount eligible for CET 1 |
37,143,541 |
37,143,541 |
– |
– |
– |
| of which amount eligible for AT I |
– |
– |
– |
– |
– |
| Retained earnings |
4,987,446 |
2,931,176 |
– |
– |
– |
| Accumulated other comprehensive income |
(1,707,494) |
– |
– |
– |
– |
| Other reserves |
66,675,867 |
67,016,047 |
– |
– |
– |
Template 12
Explanations of Differences between Accounting and Regulatory Exposure Amounts
| As at December 31, 2017 |
Differences
observed between
accounting carrying value
and amounts considered
for regulatory purposes |
Reasons for differences |
|
Net impact arising
from individual
and collective
impairment |
Fair value
adjustment |
Effective Interest
Rate (EIR)
adjustment |
Re-classification
of receivables
and payables |
Unamortised
cost on staff
loans (day 1
difference) |
Other SLFRS
adjustments |
Tax Impact
on SLFRS
adjustments |
|
Rs. ’000 |
Rs. ’000 |
Rs. ’000 |
Rs. ’000 |
Rs. ’000 |
Rs. ’000 |
Rs. ’000 |
Rs. ’000 |
| Assets |
|
|
|
|
|
|
|
|
| Cash and cash equivalents |
290 |
– |
– |
– |
290 |
– |
– |
– |
| Placements with banks |
46,063 |
– |
– |
– |
46,063 |
– |
– |
– |
| Derivative financial assets |
2,334,536 |
– |
– |
– |
2,334,536 |
– |
– |
– |
Loans and receivables to
other customers |
(136,088) |
2,528,528 |
– |
– |
1,012,349 |
(3,676,965) |
– |
– |
Financial investments –
Available for sale |
(653,535) |
– |
(660,250) |
– |
6,715 |
– |
– |
– |
Financial investments –
Held to maturity |
(1,800,927) |
– |
(2,125,089) |
– |
324,163 |
– |
– |
– |
Financial investments –
Loans and receivables |
340,701 |
– |
– |
– |
340,701 |
– |
– |
– |
| Other assets |
1,657,218 |
– |
– |
– |
(2,019,747) |
3,676,965 |
– |
– |
| Liabilities |
|
|
|
|
|
|
|
|
| Due to banks |
534,112 |
– |
– |
– |
534,112 |
– |
– |
– |
| Derivative financial liabilities |
3,678,494 |
– |
– |
– |
3,678,494 |
– |
– |
– |
| Securities sold under repurchase agreements |
(9,356) |
– |
– |
– |
(9,356) |
– |
– |
– |
| Due to other customers |
17,054,173 |
– |
– |
(429,343) |
17,483,516 |
– |
– |
– |
| Other borrowings |
9,889 |
– |
– |
– |
9,889 |
– |
– |
– |
| Current tax liabilities |
269,390 |
– |
– |
– |
– |
– |
– |
269,390 |
| Deferred tax liabilities |
(1,012,642) |
– |
– |
– |
– |
– |
– |
(1,012,642) |
| Other liabilities |
(19,274,491) |
– |
– |
– |
(20,195,892) |
– |
921,401 |
– |
| Subordinated term debts |
530,088 |
– |
– |
(4,863) |
534,951 |
– |
– |
– |
| Shareholders' equity |
|
|
|
|
|
|
|
|
| Retained earnings |
2,056,270 |
2,528,524 |
– |
443,561 |
– |
|
(800,048) |
(115,767) |
Accumulated other
comprehensive income |
(1,707,494) |
– |
(1,707,494) |
– |
– |
– |
– |
– |
| Other reserves |
(340,180) |
– |
(340,180) |
– |
– |
– |
– |
– |
Explanations of differences between accounting and regulatory exposure amounts
Under LKAS 39 on “Financial Instruments: Recognition and Measurement”, the Bank first assesses whether objective evidence of impairment exists for individually significant financial assets or collectively for financial assets that are not individually significant, based on the principles of “Incurred loss” (Refer Note 18 to the Financial Statements for details). However, the regulatory provisions made on loans and advances under the Direction No. 3 of 2008 on “Classification of Loans and Advances, Income Recognition and Provisioning” (and subsequent amendments thereto) issued by the CBSL are “time/delinquency based”. As a result, the LKAS 39 recognises delinquency pattern of a loan much earlier when compared to the CBSL Guidelines and also computes the impairment provision based on the historical loss experience of loans.
Investment securities are carried at “Cost” for regulatory reporting purposes while they classified as “Available for sale” carried at fair value or “Held to maturity” carried at amortised cost under the LKAS 39. The “Fair value” is defined as the best estimate of the price that would be received to sell an asset or be paid to transfer a liability in an orderly transaction between market participants at the measurement date. A variety of valuation techniques combined with the range of plausible market parameters as at a given point in time may still generate unexpected uncertainty beyond fair value. An “amortised cost” of a financial asset or financial liability is the amount at which the financial asset or liability is measured at initial recognition, minus principal repayments, plus or minus the cumulative amortisation using the EIR method of any difference between the initial amount recognised and the maturity amount, minus any reduction for impairment. Hence, the amortised cost of Financial investments – Held to maturity, Due to other customers, Debentures, etc under the LKAS 39 is different to the carrying value for regulatory reporting which is the “cost”. Refer Notes 26, 34 and 35 to the Financial Statements for details.
As per LKAS 39, a “Day 1 difference” is recognised, when the transaction price differs from the fair value of other observable current market transactions in the same instrument. E.g. Employee loans below market rates. Refer Note 7.1.2.1 to the Financial Statements for details. However, the carrying value of such transactions for regulatory reporting purposes is equal to cost/transaction price.
Template 13
Bank risk management approach
Effective risk management is at the core of the Bank’s value creation model as we accept risk in the normal course of business. Significant resources are devoted to this critical function to ensure that it is well articulated, communicated and understood by all employees of the Bank as it is a shared responsibility. It is a dynamic and disciplined function increasing in sophistication and subject to stringent oversight by regulators and other stakeholders. The overarching objectives are to ensure that risks accepted are in line with the Bank’s risk appetite and strategic priorities and that there is an appropriate trade-off between risk and reward enabling delivery of value to key stakeholders.
“The risk governance structure,responsibilities attributed throughout the bank, risk management framework, objectives, strategies, policy framework, risk appetite and tolerance limits for key risk types, and the overall risk management approach of the Bank are discussed under three main sections of this Report namely the Risk Review, Managing Risk: An Overview, and Risk Management Report”.
Template 14
Risk management related to key risk exposures
The quantitative disclosures relating to key risk areas such as credit, market, liquidity, operational, and interest rate risk in the banking book are presented and discussed in the Financial Risk Management Report in the Financial Statements and Annex 3: Risk Management Report.