ANNEX 1: Investor relations
The Bank is grateful to its loyal investors, particularly those who take a long-term view of their investments in the Bank and are ever willing to provide support at times when the Bank requires capital for business expansion. The Bank is also cognisant of the role investor relations play in this regard.
Irrespective of the method, information is central to effective investor engagement. The communication of relevant and timely information to investors and the broader capital markets enables them to make informed decisions about their current and prospective shares and other securities held at the Bank. The Bank has a strong reputation for being actively engaged with its investors. The Bank’s disclosure of information in various publications, in the Annual Report – the main investor communications tool – in particular, goes far beyond the legal and regulatory compliance requirements. Through such disclosures, the Bank aims to help investors obtain a fair understanding of the Bank’s current performance, strategic direction, governance, risk management, and future business prospects which have made the Bank’s shares a creditable investment proposition. The Bank always attempts to present a balanced view of its fundamentals in terms of operational results, financial position, and cash flows. This is done with the aim of helping them to understand the underlying strengths of the Bank and building positive relationships with the investors.
The Annual General Meeting is an excellent platform to have a two-way communication between the Bank and the investor community. In addition, an Extraordinary General Meeting was held in May 2017 to obtain shareholders’ approval for the Rights Issues of Ordinary Shares of Rs. 10 Bn. Further, we have provided an opportunity for investors to provide their feedback
to the Bank about this Annual Report through the stakeholder Feedback Form enclosed to this Annual Report. We urge investors to make use of these opportunities and indicate their views and any concerns on any aspects relevant to the future prospects
of the Bank which, among other things, may include strategic direction, quality of management, and governance. We value such inputs and will use them when formulating strategy for long-term value creation.
The Bank always aspires to put in place international best practices to investor relations since a healthy dialogue with this important stakeholder group helps the Bank in many ways. Examples include reinforcing good policies and practices such as accountability and good governance within the Bank, and building an active market and a fair valuation for the Bank’s shares. These actions all lead to strengthen the trust and confidence of investors further. The effectiveness of the Bank’s investor engagement efforts – through sharing relevant information about its current performance and future prospects – is evident when the Bank’s shares are trading at a premium to their book value at the Colombo Stock Exchange (CSE) (Price to book value of 1.26 times as at December 31, 2017, the highest among the players in the Bank, Finance and Insurance sector).
The Bank is aware that its website is now the first port of call for most stakeholders who want to learn more about the Bank. Accordingly, the Bank makes all effort to keep it (including the investor relations pages thereof) up to date at all times.
This Report provides relevant information to facilitate an informed and constructive discussion at the forthcoming Annual General Meeting.
With a public holding (free float) of 99.71% in voting shares and 89.66% in non-voting shares against the regulatory minimum of 10%, the Bank’s shares are actively traded in the CSE, providing a ready “enter and exit” mechanism for investors. The following pages of the Report provide information on the performance of the Bank’s listed securities.
1. Our Listed Securities
The Bank’s ordinary shares are listed on the Main Board of the Colombo Stock Exchange (CSE) under the ticker symbol ‘COMB’. All debentures issued are also listed on the CSE.
Most daily newspapers, including the Daily News, Daily FT, The Island and Daily Mirror carry a summary of trading activity and daily prices of shares and debentures within their pages using the abbreviation of Commercial Bank or COMB (Table 26).
Table – 26
Summary of trading activity
| Security type |
Number in issue as at |
|
|
31.12.2017 |
31.12.2016 |
| Stock symbol
| Equity |
|
|
|
| Ordinary Shares – Voting |
931,971,691 |
833,521,887 |
COMB-N0000 |
| Ordinary Shares – Non-voting |
63,927,611 |
57,212,653 |
COMB-X0000 |
| Debt |
|
|
|
Fixed Rate Debentures
March 2016/21 |
44,303,400 |
44,303,400 |
COMB-BD-08/03/21-
C2341-10.75% |
Fixed Rate Debentures
March 2016/26 |
17,490,900 |
17,490,900 |
COMB-BD-08/03/26-
C2342-11.25% |
Fixed Rate Debentures
October 2016/21 |
50,718,000 |
50,718,000 |
COMB-BD-27/10/21-
C2360-12.00% |
Fixed Rate Debentures
October 2016/26 |
19,282,000 |
19,282,000 |
COMB-BD-27/10/26-
C2359-12.25% |
| Newswire Codes |
|
|
|
| Bloomberg |
|
|
|
| Dow Jones |
|
|
|
| Reuters |
|
|
|
Table – 27
Share price trend over last five years
|
2017 |
2016 |
2015 |
2014 |
2013 |
| Ordinary shares – Voting |
|
|
|
|
|
| Highest price (Rs.) |
150.00 |
151.90 |
194.00 |
179.90 |
126.00 |
| Lowest price (Rs.) |
128.50 |
115.00 |
139.90 |
113.50 |
103.20 |
| Last traded price (Rs.) |
135.80 |
145.00 |
140.20 |
171.00 |
120.40 |
| Ordinary shares – Non-voting |
|
|
|
|
|
| Highest price (Rs.) |
118.50 |
123.00 |
149.00 |
125.50 |
102.00 |
| Lowest price (Rs.) |
102.30 |
101.50 |
122.10 |
91.30 |
87.00 |
| Last traded price (Rs.) |
105.00 |
115.00 |
123.00 |
125.10 |
93.00 |
2. Performance of Securities and Returns to Shareholders
Market exhibited a stronger investor appetite during the year compared to the previous year with both turnover and volume of shares traded recording significant increases. ASPI and S&P SL 20 indices gained 6.85% and 12.30% up to October, but lost part of the gains in November and December and ended the year with only 2.26% and 5.01% gains, respectively. Rising interest rates and inflation during the year also played a part resulting in a market performance that was less than expected. Domestic and foreign activity maintained its upward trajectory with respective turnovers growing by 14.23% and 39.03%. Foreign companies were net purchasers, while local companies and foreign and local individuals were net sellers. The Bank, Finance and Insurance sector
also reflected a positive 5.07% trend
during the year.
The market price of an ordinary voting share of the Bank decreased by 6.34% from
Rs. 145.00 at the end of 2016 to Rs. 135.80 at the end of 2017 (Table 29). The Bank maintained its policy of issuing scrip dividends and continued with its employee share option plan. Further, the Bank raised Rs. 10 Bn. via a rights issue of Ordinary Shares in the proportion of 1:10 in June 2017. As a result there was an increase in the number of shares in issue in both categories. Market capitalisation for both voting and non-voting shares in turn increased from Rs. 127.440 Bn. (USD 851.019 Mn.) in 2016 to Rs. 133.274 Bn. (USD 867.670 Mn.) in 2017 accounting for 4.6% of the total market capitalisation.
During most of 2017, the movement of the non-voting share price followed the trend of the voting shares.
Table – 28
Market capitalisation
| Year |
Rs. Bn. |
USD Mn. |
| 2017 |
133.274 |
867.670 |
| 2016 |
127.440 |
851.019 |
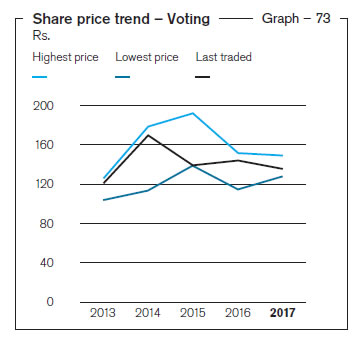
Table – 29
Sustainable value for investors Ordinary shares – Voting
| Ordinary shares – Voting |
2017
Rs. |
2016
Rs. |
| Highest price |
|
|
| (31.10.2017) |
150.00 |
|
| (07.11.2016) |
|
151.90 |
| Lowest price |
|
|
| (30.03.2017) |
128.50 |
|
| (09.03.2016) |
|
115.00 |
| Year-end price |
135.80 |
145.00 |
Table – 30
Ordinary shares – Non-voting
| Ordinary Shares – Non-Voting |
2017
Rs. |
2016
Rs. |
| Highest price |
|
|
| (16.05.2017) |
118.50 |
|
| (04.01.2016) |
|
123.00 |
| Lowest price |
|
|
| (31.03.2017) |
102.30 |
|
| (09.03.2016) |
|
101.50 |
| Year end price |
105.00 |
115.00 |

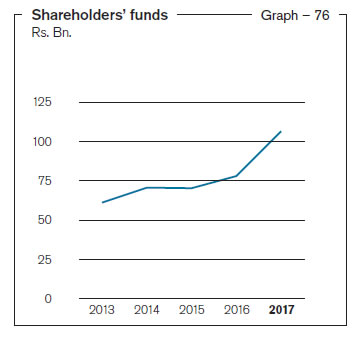
Information on shareholders’ funds and Bank’s market capitalisation
Table – 31
| As at December 31, |
Shareholders’
funds |
Commercial
Bank’s market
capitalisation(*) |
Total market
capitalisation
of the CSE |
Market capitalisation
as a % of CSE
market capitalisation |
Market
capitalisation
ranking |
|
Rs. Bn. |
Rs. Bn. |
Rs. Bn. |
% |
Rank |
| 2017(*) |
107 |
133 |
2,899 |
4.60 |
4 |
| 2016 |
78 |
127 |
2,745 |
4.64 |
3 |
| 2015 |
70 |
115 |
2,938 |
3.92 |
3 |
| 2014 |
71 |
139 |
3,105 |
4.46 |
3 |
| 2013 |
61 |
96 |
2,286 |
4.18 |
4 |
(*) Market capitalisation as at December 31, 2017 includes both voting and non-voting shares.
Table – 32
Number of transactions (No. ’000)
|
2017 |
2016 |
2015 |
2014 |
2013 |
| Shares voting |
12 |
15 |
16 |
18 |
19 |
| Shares non-voting |
4 |
4 |
5 |
7 |
5 |
Table – 33
Number of shares traded (No. Mn.)
|
2017 |
2016 |
2015 |
2014 |
2013 |
| Shares voting |
144 |
96 |
117 |
129 |
199 |
| Shares non-voting |
7 |
5 |
10 |
20 |
7 |

With many investors adopting a holding strategy on the stock in view of its performance, an upward trajectory was recorded in the number of shares traded in both voting and non-voting shares during the year (Graph 78). There was, however sustained interest in the shares as reflected in the number of transactions in ordinary voting shares (Graph 79) which was similar to their performance in 2016 (Table 33).
Despite there being a marginal drop in the share price during 2017, the market price of Bank's ordinary voting shares grew by approximately 13% over the past five years.
3. Information on Movement in Number of Shares Represented by the Stated Capital
(As per Rule No. 7.6 (ix) of the Listing Rules of the CSE)
|
|
|
|
|
No. of shares |
| Year |
Details |
|
Basis |
No. of shares
issued/
(redeemed) |
Ordinary shares
voting |
Ordinary shares
Non-voting |
Cumulative
redeemable
preference shares |
|
|
|
|
|
|
|
|
| 1987 |
As at December 31, 1987 |
|
3,000,000 |
– |
– |
| 1988 |
Bonus Issue |
Voting |
2 for 3 |
2,000,000 |
5,000,000 |
– |
– |
| 1990 |
Bonus Issue |
Voting |
1 for 1 |
5,000,000 |
10,000,000 |
– |
– |
| 1993 |
Rights Issue |
Voting |
1 for 4 |
2,500,000 |
12,500,000 |
– |
– |
| 1996 |
Bonus Issue |
Voting |
3 for 5 |
7,500,000 |
20,000,000 |
– |
– |
| Rights Issue |
Voting |
1 for 4 |
5,000,000 |
25,000,000 |
– |
– |
| Share Swap |
Non-Voting |
|
894,275 |
25,000,000 |
894,275 |
– |
| Bonus Issue |
Non-Voting |
3 for 5 |
536,565 |
25,000,000 |
1,430,840 |
– |
| Rights Issue |
Non-Voting |
1 for 4 |
357,710 |
25,000,000 |
1,788,550 |
– |
| 1998 |
Bonus Issue |
Voting |
3 for 10 |
7,500,000 |
32,500,000 |
1,788,550 |
– |
| Bonus Issue |
Non-Voting |
3 for 10 |
536,565 |
32,500,000 |
2,325,115 |
– |
| 2001 |
Bonus Issue |
Voting |
1 for 5 |
6,500,000 |
39,000,000 |
2,325,115 |
– |
| Bonus Issue |
Non-Voting |
1 for 5 |
465,023 |
39,000,000 |
2,790,138 |
– |
| Issue of Cumulative Redeemable Preference Shares |
|
|
90,655,500 |
39,000,000 |
2,790,138 |
90,655,500 |
| 2003 |
Bonus Issue |
Voting |
1 for 3 |
13,000,000 |
52,000,000 |
2,790,138 |
90,655,500 |
| Rights Issue |
Voting |
1 for 4 |
13,000,000 |
65,000,000 |
2,790,138 |
90,655,500 |
| Bonus Issue |
Non-Voting |
1 for 3 |
930,046 |
65,000,000 |
3,720,184 |
90,655,500 |
| Rights Issue |
Non-Voting |
1 for 4 |
930,046 |
65,000,000 |
4,650,230 |
90,655,500 |
| Issue of Cumulative Redeemable Preference Shares |
|
|
100,000,000 |
65,000,000 |
4,650,230 |
190,655,500 |
| 2004 |
ESOP |
Voting |
|
29,769 |
65,029,769 |
4,650,230 |
190,655,500 |
| 2005 |
ESOP |
Voting |
|
1,361,591 |
66,391,360 |
4,650,230 |
190,655,500 |
| Bonus Issue |
Voting |
1 for 1 |
66,389,162 |
132,780,522 |
4,650,230 |
190,655,500 |
| Bonus Issue |
Non-Voting |
1 for 1 |
4,650,230 |
132,780,522 |
9,300,460 |
190,655,500 |
| 2006 |
ESOP |
Voting |
|
737,742 |
133,518,264 |
9,300,460 |
190,655,500 |
| Redemption of Cumulative Redeemable Preference Shares |
|
|
(90,655,500) |
133,518,264 |
9,300,460 |
100,000,000 |
| 2007 |
Rights Issue |
Voting |
3 for 10 |
40,288,996 |
173,807,260 |
9,300,460 |
100,000,000 |
| Bonus Issue |
Voting |
1 for 3 |
58,204,268 |
232,011,528 |
9,300,460 |
100,000,000 |
| ESOP |
Voting |
|
919,649 |
232,931,177 |
9,300,460 |
100,000,000 |
| Rights Issue |
Non-Voting |
3 for 10 |
2,790,138 |
232,931,177 |
12,090,598 |
100,000,000 |
| Bonus Issue |
Non-Voting |
1 for 3 |
4,030,199 |
232,931,177 |
16,120,797 |
100,000,000 |
| 2008 |
Redemption of Cumulative Redeemable Preference Shares |
|
|
(100,000,000) |
232,931,177 |
16,120,797 |
– |
| ESOP |
Voting |
|
350,049 |
233,281,226 |
16,120,797 |
– |
| 2009 |
ESOP |
Voting |
|
540,045 |
233,821,271 |
16,120,797 |
– |
| 2010 |
Share Split |
Voting |
1 for 2 |
117,402,608 |
351,223,879 |
16,120,797 |
– |
| Share Split |
Non-Voting |
1 for 2 |
8,060,398 |
351,223,879 |
24,181,195 |
– |
| ESOP |
Voting |
|
2,081,508 |
353,305,387 |
24,181,195 |
– |
| 2011 |
Scrip issue for final dividend 2010 |
Voting |
Rs. 2.00
per share |
2,277,195 |
355,582,582 |
24,181,195 |
– |
| Scrip issue for final dividend 2010 |
Non-Voting |
255,734 |
355,582,582 |
24,436,929 |
– |
| ESOP |
Voting |
|
1,457,645 |
357,040,227 |
24,436,929 |
– |
| Rights Issue |
Voting |
1 for 14 |
25,502,433 |
382,542,660 |
24,436,929 |
– |
| Rights Issue |
Non-Voting |
1 for 14 |
1,745,494 |
382,542,660 |
26,182,423 |
– |
| Share Split |
Voting |
1 for 1 |
382,542,660 |
765,085,320 |
26,182,423 |
– |
| Share Split |
Non-Voting |
1 for 1 |
26,182,423 |
765,085,320 |
52,364,846 |
– |
| 2012 |
Scrip issue for final dividend 2011 |
Voting |
Rs. 2.00
per share |
13,587,144 |
778,672,464 |
52,364,846 |
– |
| Scrip issue for final dividend 2011 |
Non-Voting |
1,108,902 |
778,672,464 |
53,473,748 |
– |
| ESOP |
Voting |
|
1,341,768 |
780,014,232 |
53,473,748 |
– |
| 2013 |
Scrip issue for final dividend 2012 |
Voting |
Rs. 2.00
per share |
13,076,189 |
793,090,421 |
53,473,748 |
– |
| Scrip issue for final dividend 2012 |
Non-Voting |
1,069,474 |
793,090,421 |
54,543,222 |
– |
| ESOP |
Voting |
|
1,445,398 |
794,535,819 |
54,543,222 |
– |
| 2014 |
Scrip issue for final dividend 2013 |
Voting |
Rs. 2.00
per share |
12,504,344 |
807,040,163 |
54,543,222 |
– |
| Scrip issue for final dividend 2013 |
Non-Voting |
1,036,724 |
807,040,163 |
55,579,946 |
– |
| ESOP |
Voting |
|
3,237,566 |
810,277,729 |
55,579,946 |
– |
| 2015 |
Scrip issue for final dividend 2014 |
Voting |
Rs. 2.00
per share |
8,118,773 |
818,396,502 |
55,579,946 |
– |
| Scrip issue for final dividend 2014 |
Non-Voting |
719,740 |
818,396,502 |
56,299,686 |
– |
| ESOP |
Voting |
|
2,170,613 |
820,567,115 |
56,299,686 |
– |
| 2016 |
Scrip issue for final dividend 2015 |
Voting |
Rs. 2.00
per share |
11,818,040 |
832,385,155 |
56,299,686 |
– |
| Scrip issue for final dividend 2015 |
Non-Voting |
912,967 |
832,385,155 |
57,212,653 |
– |
| ESOP |
Voting |
|
1,136,732 |
833,521,887 |
57,212,653 |
– |
| 2017 |
Scrip issue for final dividend 2016 |
Voting |
Rs. 2.00
per share |
10,521,802 |
844,043,689 |
57,212,653 |
– |
| Scrip issue for final dividend 2016 |
Non-Voting |
903,357 |
844,043,689 |
58,116,010 |
– |
| Rights Issue |
Voting |
1 for 10 |
84,649,465 |
928,693,154 |
58,116,010 |
– |
| Rights Issue |
Non-Voting |
1 for 10 |
5,811,601 |
928,693,154 |
63,927,611 |
– |
| ESOP |
Voting |
|
3,278,537 |
931,971,691 |
63,927,611 |
– |
4. Dividends
The declaration of a dividend should always ensure that a balance between the shareholders’ needs and the business needs of the Bank. For the year under review, the Bank paid two interim dividends totalling to Rs. 4.50 per share in cash. A final dividend of Rs. 2.00 per ordinary share has now been recommended by the Bank’s Board of Directors. This will be met in the form of the issue and allotment of new shares for both voting and non-voting shareholders of the Bank for the year ended December 31, 2017. It will be submitted for the approval of the shareholders at the 49th AGM, to be held
on March 28, 2018.
(A dividend of Rs. 6.50 per share was declared and paid by the Bank for the year ended December 31, 2016. It consisted of a cash dividend of Rs. 4.50 per share and balance entitlement of Rs. 2.00 per share satisfied in the form of issue and allotment
of new shares).
Dividends
Table – 34
| Dividends |
2017 |
2016 |
| Cash – Rs. per share |
|
|
| First interim paid |
1.50 |
1.50 |
| Second interim paid |
3.00 |
3.00 |
| Total |
4.50 |
4.50 |
| Scrip – Rs. per share |
|
|
| Final proposed/allotted |
2.00 |
2.00 |
| Total |
6.50 |
6.50 |
| Dividend payout ratio (%) |
|
|
| Cash |
27.04 |
27.64 |
| Total (cash and shares) |
39.06 |
39.94 |
[graph 80]
| Year |
2017 |
2016 |
2015 |
2014 |
2013 |
| Dividend per share |
6.50 |
6.50 |
6.50 |
6.50 |
6.50 |
5. Shareholders
The Bank had 9,812 ordinary voting shareholders and 4,320 ordinary non-voting shareholders as at December 31, 2017 compared to 9,610 and 4,191 voting and
non-voting shareholders as at December 31, 2016 (Table 35). With two new investors joining ranks, the percentage of ordinary voting shares held by the 20 largest shareholders increased to 71.39% from 66.35% in 2016. A rise was also recorded in the non-voting ordinary shares held by the 20 largest shareholders from 41.14% in 2016 to 45.53% in 2017. Three of the new investors making significant purchases during the year under review were foreign investors (Section 5.3).
Number of ordinary
shareholders
Table – 35
|
2017 |
2016 |
| Voting shareholders |
9,812 |
9,610 |
| Non-voting shareholders |
4,320 |
4,191 |
| Total |
14,132 |
13,801 |
5.1 Composition of Shareholders
|
As at December 31, 2017 |
As at December 31, 2016 |
|
No. of
shareholders |
% |
No. of shares |
% |
No. of
shareholders |
% |
No. of shares |
% |
| Ordinary shares – voting |
|
|
|
|
|
|
|
| Resident |
9,524 |
97.06 |
614,635,782 |
65.95 |
9,314 |
96.92 |
587,487,079 |
70.48 |
| Non-resident |
288 |
2.94 |
317,335,909 |
34.05 |
296 |
3.08 |
246,034,808 |
29.52 |
| Total |
9.812 |
100.00 |
931,971,691 |
100.00 |
9,610 |
100.00 |
833,521,887 |
100.00 |
|
|
|
|
|
|
|
|
|
| Individuals |
9,260 |
94.37 |
186,657,813 |
20.03 |
9,058 |
94.26 |
193,603,082 |
23.23 |
| Institutions |
552 |
5.63 |
745,313,878 |
79.97 |
552 |
5.74 |
639,918,805 |
76.77 |
| Total |
9.812 |
100.00 |
931,971,691 |
100.00 |
9,610 |
100.00 |
833,521,887 |
100.00 |
|
|
|
|
|
|
|
|
|
| Ordinary shares – non-voting |
|
|
|
|
|
|
| Resident |
4,243 |
98.22 |
47,078,661 |
73.64 |
4,107 |
98.00 |
43,843,846 |
76.63 |
| Non-resident |
77 |
1.78 |
16,848,950 |
26.36 |
84 |
2.00 |
13,368,807 |
23.37 |
| Total |
4,320 |
100.00 |
63,927,611 |
100.00 |
4,191 |
100.00 |
57,212,653 |
100.00 |
|
|
|
|
|
|
|
|
|
| Individuals |
4,102 |
94.95 |
34,197,527 |
53.49 |
3,970 |
94.73 |
32,320,757 |
56.49 |
| Institutions |
218 |
5.05 |
29,730,084 |
46.51 |
221 |
5.27 |
24,891,896 |
43.51 |
| Total |
4,320 |
100.00 |
63,927,611 |
100.00 |
4,191 |
100.00 |
57,212,653 |
100.00 |
5.2 Distribution schedule of the number of holders and percentage of holding in each class of equity securities
(As per Rule No. 7.6 (x) of the Listing Rules of the CSE)
|
|
|
As at December 31, 2017 |
As at December 31, 2016 |
|
|
|
No. of
shareholders |
% |
No. of shares |
% |
No. of
shareholders |
% |
No. of shares |
% |
| Ordinary Shares Voting |
|
|
|
|
|
|
|
|
| 1 |
– |
1,000 |
5,003 |
50.99 |
1,118,801 |
0.12 |
4,827 |
50.23 |
1,107,910 |
0.13 |
| 1,001 |
– |
10,000 |
3,091 |
31.50 |
11,273,062 |
1.21 |
3,081 |
32.06 |
11,064,002 |
1.33 |
| 10,001 |
– |
100,000 |
1,411 |
14.38 |
40,094,004 |
4.30 |
1,406 |
14.63 |
40,096,730 |
4.81 |
| 100,001 |
– |
1,000,000 |
233 |
2.38 |
65,888,648 |
7.07 |
227 |
2.36 |
63,821,779 |
7.66 |
| Over |
|
1,000,000 |
74 |
0.75 |
813,597,176 |
87.30 |
69 |
0.72 |
717,431,466 |
86.07 |
| Total |
|
|
9,812 |
100.00 |
931,971,691 |
100.00 |
9,610 |
100.00 |
833,521,887 |
100.00 |
|
|
|
|
|
|
|
|
|
|
|
| Ordinary Shares Non-Voting |
| 1 |
– |
1,000 |
2,349 |
54.38 |
557,060 |
0.87 |
2,248 |
53.64 |
544,686 |
0.94 |
| 1,001 |
– |
10,000 |
1,354 |
31.34 |
4,608,957 |
7.21 |
1,354 |
32.30 |
4,513,800 |
7.89 |
| 10,001 |
– |
100,000 |
518 |
11.99 |
14,886,791 |
23.29 |
492 |
11.74 |
13,932,010 |
24.35 |
| 100,001 |
– |
1,000,000 |
91 |
2.11 |
22,204,420 |
34.74 |
90 |
2.15 |
21,600,494 |
37.77 |
| Over |
|
1,000,000 |
8 |
0.18 |
21,670,383 |
33.89 |
7 |
0.17 |
16,621,663 |
29.05 |
| Total |
|
|
4,320 |
100.00 |
63,927,611 |
100.00 |
4,191 |
100.00 |
57,212,653 |
100.00 |
5.3 The names, number and percentage of shares held by the twenty largest shareholders
(As per Rule No. 7.6 (iii) of the Listing Rules of the CSE)
| As at December 31, |
2017 |
2016 (*) |
| Ordinary shares-voting |
No. of shares |
% |
No. of shares |
% |
| 1. |
DFCC Bank PLC A/C 1 |
126,930,224 |
13.62 |
122,747,994 |
14.73 |
| 2. |
Employees’ Provident Fund |
89,933,984 |
9.65 |
80,741,135 |
9.69 |
| 3. |
Mr Y S H I Silva |
70,742,605 |
7.59 |
82,635,230 |
9.91 |
| 4. |
Deutsche Bank AG Singapore – DSS A/C NT Asian Discovery Master Fund |
53,263,322 |
5.72 |
13,929,632 |
1.67 |
| 5. |
Sri Lanka Insurance Corporation Ltd. – Life Fund |
46,620,431 |
5.00 |
41,854,996 |
5.02 |
| 6. |
Melstacorp PLC |
41,516,889 |
4.45 |
28,295,305 |
3.39 |
| 7. |
CB NY S/A International Finance Corporation |
41,442,164 |
4.45 |
37,206,040 |
4.46 |
| 8. |
Sri Lanka Insurance Corporation Ltd. – General Fund |
40,087,155 |
4.30 |
35,989,537 |
4.32 |
| 9. |
Mrs L E M Yaseen |
17,008,550 |
1.83 |
16,603,339 |
1.99 |
| 10. |
HSBC International Nominees Ltd. – JPMLU – Franklin Templeton Investment Fund |
16,599,478 |
1.78 |
14,791,566 |
1.77 |
| 11. |
BNYMSANV RE-CF Ruffer Absolute Return Fund |
16,414,352 |
1.76 |
6,336,702 |
0.76 |
| 12. |
Employee’s Trust Fund Board |
15,579,452 |
1.67 |
10,723,987 |
1.29 |
| 13. |
HSBC International Nominees Ltd. – JPMCB – T ROWE New Asia Fund |
14,990,626 |
1.61 |
– |
– |
| 14. |
HSBC International Nominees Ltd. – SSBT – Morgan Stanley Asset Management SA
Acting on behalf of Morgan Stanley Galaxy Fund |
14,181,819 |
1.52 |
12,732,186 |
1.53 |
| 15. |
HSBC International Nominees Ltd. – SSBT – Morgan Stanley Institutional Fund,
Inc. – Frontier Emerging Markets Portfolio |
13,605,543 |
1.46 |
12,998,068 |
1.56 |
| 16. |
BNYMSANV RE – First State Investments ICVC – Stewart Investors Indian
Subcontinent Fund |
9,897,978 |
1.06 |
8,886,230 |
1.07 |
| 17. |
HSBC International Nominees Ltd. – SSBT – BMO Investments II (Ireland) Public
Limited Company |
9,862,752 |
1.06 |
8,522,701 |
1.02 |
| 18. |
HSBC International Nominees Ltd. – JPMLU – T ROWE Price Funds SICAV |
9,503,641 |
1.02 |
– |
– |
| 19. |
HSBC International Nominees Ltd. – BPSS LUX – Aberdeen Global Asia
Pacific Equity Fund |
9,444,947 |
1.01 |
11,172,854 |
1.34 |
| 20. |
HSBC International Nominees Ltd. – BP2S London – Aberdeen Asia Smaller
Companies Investment Trust |
7,734,621 |
0.83 |
6,944,006 |
0.83 |
|
Sub total |
665,360,533 |
71.39 |
553,111,508 |
66.35 |
|
Other shareholders |
266,611,158 |
28.61 |
280,410,379 |
33.65 |
|
Total |
931,971,691 |
100.00 |
833,521,887 |
100.00 |
* Comparative shareholdings as at December 31, 2016 of the twenty largest shareholders as at December 31, 2017.
Percentage of public holding of voting shares as at December 31, 2017 was 99.71% (99.73% as at December 31, 2016)
(As per Rule No. 7.6 (iv) of the Listing Rules of the CSE).
Number of shareholders representing public holding as at December 31, 2017 – 9,780 (9,578 as at December 31, 2016)
(As per Rule No. 7.13.1 of the Listing Rules of the CSE).
| As at December 31, |
2017 |
2016 (*) |
| Ordinary shares – non-voting |
No. of shares |
% |
No. of shares |
% |
| 1. |
Citi Bank NY S/A Norges Bank A/C 2 |
6,428,323 |
10.06 |
3,228,072 |
5.64 |
| 2. |
Employees’ Trust Fund Board |
4,656,784 |
7.28 |
4,167,636 |
7.28 |
| 3. |
HSBC International Nominees Ltd. – JPMLU – Franklin Templeton Investment Funds |
3,866,166 |
6.05 |
3,309,627 |
5.78 |
| 4. |
GF Capital Global Ltd. |
1,627,959 |
2.55 |
1,591,203 |
2.78 |
| 5. |
BNYMSANV RE-Butterfield Trust (Bermuda) Ltd. |
1,442,008 |
2.26 |
1,419,594 |
2.48 |
| 6. |
CB NY S/A Salient International Dividend Signal Fund |
1,323,138 |
2.07 |
1,802,572 |
3.15 |
| 7. |
Mr J D Bandaranayake |
1,232,411 |
1.93 |
1,102,959 |
1.93 |
| 8. |
M J F Exports (Pvt) Ltd. |
1,093,594 |
1.71 |
978,724 |
1.71 |
| 9. |
Mr M F Hashim |
904,832 |
1.42 |
800,417 |
1.40 |
| 10. |
Saboor Chatoor (Pvt) Ltd. |
872,800 |
1.37 |
781,100 |
1.37 |
| 11. |
Mrs L V C Samarasinha |
750,000 |
1.17 |
650,000 |
1.14 |
| 12. |
Northern Trust Company S/A Polar Capital Funds PLC |
718,286 |
1.12 |
– |
– |
| 13. |
Akbar Brothers (Pvt) Ltd. A/C No 1 |
689,509 |
1.08 |
576,809 |
1.01 |
| 14. |
Union Assurance PLC – No – 01A/C |
649,979 |
1.02 |
581,706 |
1.02 |
| 15. |
Mr G R Mallawaaratchy/Mrs B G P Mallawaaratchy |
536,072 |
0.84 |
479,764 |
0.84 |
| 16. |
Mr T W A Wickramasinghe |
522,000 |
0.82 |
436,759 |
0.76 |
| 17. |
Mr Rahul Gautam |
495,200 |
0.77 |
145,500 |
0.25 |
| 18. |
Mr Kirikankanamge Suren Mohanlal De Silva |
442,974 |
0.69 |
383,468 |
0.67 |
| 19. |
Mr Amitha Lal Gooneratne |
430,409 |
0.67 |
358,351 |
0.63 |
| 20. |
Bank of Ceylon A/C Ceybank Century Growth Fund |
416,931 |
0.65 |
373,138 |
0.65 |
|
Sub total |
29,099,375 |
45.52 |
23,167,399 |
40.49 |
|
Other shareholders |
34,828,236 |
54.48 |
34,045,254 |
59.51 |
|
Total |
63,927,611 |
100.00 |
57,212,653 |
100.00 |
* Comparative shareholdings as at December 31, 2016 of the twenty largest shareholders as at December 31, 2017.
Percentage of public holding of non-voting shares as at December 31, 2017 was 89.66% (99.79% as at December 31, 2016)
(As per Rule No. 7.6 (iv) of the Listing Rules of the CSE).
Number of shareholders representing public holding as at December 31, 2017 – 4,309 (4,182 as at December 31, 2016)
(As per Rule No. 7.13.1 of the Listing Rules of the CSE).
5.4 Directors’ shareholding including the Chief Executive Officer’s shareholding
(As per Rule No. 7.6 (v) of the Listing Rules of the CSE)
|
Ordinary shares – voting |
Ordinary shares – non-voting |
| As at December 31, |
2017 |
2016 |
2017 |
2016 |
| Mr K G D D Dheerasinghe – Chairman |
23,567 |
21,159 |
Nil |
Nil |
| Mr M P Jayawardena – Deputy Chairman |
Nil |
Nil |
Nil |
Nil |
| Mr J Durairatnam – MD/CEO |
616,800 |
470,770 |
Nil |
Nil |
| Mr S Swarnajothi |
Nil |
Nil |
10,762 |
8,738 |
| Mr S Renganathan |
319,792 |
197,647 |
11,718 |
10,488 |
| Prof A K W Jayawardane |
Nil |
Nil |
Nil |
Nil |
| Mr K Dharmasiri |
Nil |
Nil |
Nil |
Nil |
| Mr L D Niyangoda |
Nil |
Nil |
Nil |
Nil |
| Ms. N T M S Cooray |
Nil |
Nil |
49,731 |
Nil |
| Mr G S Jadeja |
Nil |
Nil |
Nil |
Nil |
| Mr T L B Hurulle (appointed w.e.f. April 5, 2017) |
Nil |
N/A |
Nil |
N/A |
| Justice K Sripavan (appointed w.e.f. April 26, 2017) |
Nil |
N/A |
Nil |
N/A |
6. Engaging with shareholders
During the year, the Bank has complied with its shareholder communication policy. This policy outlines the various formal channels through which it engages with shareholders. It covers the timely communication of quarterly performance as set out in the section on Connecting with Stakeholders of the Strategic Report. It also records significant events that may reasonably be expected to impact the share price. (More details are given in Financial Calendar.)
7. Material foreseeable risk factors
(As per Rule No. 7.6 (VI) of the Listing Rules of the CSE)
Information pertaining to the material foreseeable risk factors, that require disclosures as per the Rule No. 7.6 (vi) of the Listing Rules of the CSE is discussed in the Section on “Managing Risk: An Overview”.
8. Material issues pertaining to employees and industrial relations pertaining to the Bank
(As per Rule No. 7.6 (VII) of the Listing Rules of the CSE)
During the year under review there were no material issues relating to employees and industrial relations pertaining to the Bank which warrant disclosure.
9. Quarterly performance in 2017 compared to 2016
As required by Rule No. 7.4 (a) (i) of the Listing Rules of the CSE, the Bank duly submitted the Interim Financial Statements for the year 2017 to the CSE within applicable statutory deadlines. (The Bank duly complied with this requirement for 2016)
The Audited Income Statement for the year ended December 31, 2017 and the Audited Statement of Financial Position as at December 31, 2017 will be submitted to the CSE within three months from the year end, which is well within the required deadline as required by Rule No. 7.5 (a) of the Listing Rules of the CSE. (The Bank duly complied with this requirement for 2016)
This Annual Report in its entirety is available on the Bank’s website (http://www.combank.lk/newweb/investor-relations). Shareholders may also elect to receive a hard copy of the Annual Report via mail on request.
The Company Secretary of the Bank will respond to individual letters received
from shareholders.
Summary of the Income Statements – Group and Bank
|
2017 |
2016 |
|
1st Quarter
March 31 |
2nd Quarter
June 30 |
3rd Quarter
September 30 |
4th Quarter
December 31 |
Total |
1st Quarter
March 31 |
2nd Quarter
June 30 |
3rd Quarter
September 30 |
4th Quarter
December 31 |
Total |
|
Rs. Mn. |
Rs. Mn. |
Rs. Mn. |
Rs. Mn. |
Rs. Mn. |
Rs. Mn. |
Rs. Mn. |
Rs. Mn. |
Rs. Mn. |
Rs. Mn. |
|
|
|
|
|
|
|
|
|
|
|
Group |
|
|
|
|
|
|
|
|
|
|
| Net interest income |
8,786.8 |
9,303.0 |
10,553.9 |
10,923.6 |
39,567.3 |
8,173.1 |
8,065.6 |
8,223.6 |
8,665.9 |
33,128.2 |
Net fee and commission
income |
2,060.9 |
2,021.5 |
2,235.5 |
2,606.5 |
8,924.4 |
1,463.0 |
1,515.6 |
1,805.5 |
2,305.1 |
7,089.2 |
Other operating income
(Net) |
845.8 |
766.2 |
(56.7) |
726.4 |
2,281.7 |
1,429.1 |
496.7 |
1,080.1 |
1,174.9 |
4,180.8 |
Less: Impairment
charges for loans and
other losses |
251.9 |
708.7 |
658.5 |
606.8 |
2,225.9 |
1,000.3 |
567.7 |
252.8 |
(237.5) |
1,583.3 |
| Net operating income |
11,441.6 |
11,382.0 |
12,074.2 |
13,649.7 |
48,547.5 |
10,064.9 |
9,510.2 |
10,856.4 |
12,383.4 |
42,814.9 |
| Less: Expenses |
6,137.0 |
6,081.9 |
6,277.8 |
6,774.1 |
25,270.8 |
5,425.7 |
5,174.7 |
5,830.6 |
6,275.8 |
22,706.8 |
| Operating profit |
5,304.6 |
5,300.1 |
5,796.4 |
6,875.6 |
23,276.7 |
4,639.2 |
4,335.5 |
5,025.8 |
6,107.6 |
20,108.1 |
Add: Share of profits/
(losses) of associates
companies |
2.2 |
2.2 |
0.4 |
(1.1) |
3.7 |
0.8 |
1.2 |
3.8 |
0.7 |
6.5 |
| Profit before income tax |
5,306.8 |
5,302.3 |
5,796.8 |
6,874.5 |
23,280.4 |
4,640.0 |
4,336.7 |
5,029.6 |
6,108.3 |
20,114.6 |
| Less: Income tax expense |
1,493.1 |
1,461.8 |
1,677.4 |
2,021.6 |
6,653.9 |
1,376.5 |
1,083.3 |
1,351.5 |
1,836.9 |
5,648.2 |
| Profit for the period |
3,813.7 |
3,840.5 |
4,119.4 |
4,852.9 |
16,626.5 |
3,263.5 |
3,253.4 |
3,678.1 |
4,271.4 |
14,466.4 |
Quarterly profit as a % of
the profit after tax |
23.8 |
23.9 |
25.7 |
26.6 |
100.0 |
22.6 |
22.5 |
25.4 |
29.5 |
100.0 |
Cumulative quarterly profit
as a % of the profit
after tax |
23.8 |
47.7 |
73.4 |
100.0 |
– |
22.6 |
45.0 |
70.5 |
100.0 |
|
|
|
|
|
|
|
|
|
|
|
|
Bank |
|
|
|
|
|
|
|
|
|
|
| Net interest income |
8,661.4 |
9,159.8 |
10,420.6 |
10,781.6 |
39,023.4 |
8,112.9 |
7,997.9 |
8,144.3 |
8,568.5 |
32,823.6 |
Net fees and commission
income |
2,021.2 |
1,956.2 |
2,173.7 |
2,451.3 |
8,602.4 |
1,460.0 |
1,508.9 |
1,798.1 |
2,248.5 |
7,015.5 |
Other operating income
(Net) |
848.5 |
756.7 |
(36.2) |
821.4 |
2,390.4 |
1,405.8 |
496.6 |
1,077.6 |
1,281.4 |
4,261.4 |
Less: Impairment charges
for loans and other
losses |
241.7 |
695.3 |
557.5 |
419.8 |
1,914.3 |
995.0 |
551.2 |
257.4 |
(273.8) |
1,529.8 |
| Net operating income |
11,289.4 |
11,177.4 |
12,000.6 |
13,634.5 |
48,101.9 |
9,983.7 |
9,452.2 |
10,762.6 |
12,372.2 |
42,570.7 |
| Less: Expenses |
6,067.6 |
5,974.2 |
6,193.6 |
6,683.6 |
24,919.0 |
5,404.0 |
5,136.4 |
5,770.9 |
6,208.2 |
22,519.5 |
| Profit before income tax |
5,221.8 |
5,203.2 |
5,807.0 |
6,950.9 |
23,182.9 |
4,579.7 |
4,315.8 |
4,991.7 |
6,164.0 |
20,051.2 |
| Less: Income tax expense |
1,446.4 |
1,438.6 |
1,672.2 |
2,044.5 |
6,601.7 |
1,345.2 |
1,062.1 |
1,328.5 |
1,802.9 |
5,538.7 |
| Profit for the period |
3,775.4 |
3,764.6 |
4,134.8 |
4,906.4 |
16,581.2 |
3,234.5 |
3,253.7 |
3,663.2 |
4,361.1 |
14,512.5 |
Quarterly profit as a % of
the profit after tax |
23.5 |
23.5 |
25.8 |
27.2 |
100.0 |
22.3 |
22.4 |
25.2 |
30.1 |
100.0 |
Cumulative quarterly
profit as a % of the profit
after tax |
23.5 |
47.0 |
72.8 |
100.0 |
– |
22.3 |
44.7 |
69.9 |
100.0 |
|
Summary of Statements of Financial Position – Group
|
2017 |
2016 |
| As at |
March 31 |
June 30 |
September 30 |
December 31 |
March 31 |
June 30 |
September 30 |
December 31 |
|
Rs. Mn. |
Rs. Mn. |
Rs. Mn. |
Rs. Mn. |
Rs. Mn. |
Rs. Mn. |
Rs. Mn. |
Rs. Mn. |
|
|
|
|
|
|
|
|
|
| Cash and cash equivalents |
31,194.2 |
38,761.0 |
27,738.2 |
34,673.4 |
26,041.8 |
33,510.9 |
26,332.8 |
32,924.2 |
| Placements with banks |
11,332.2 |
9,332.8 |
12,378.9 |
17,633.3 |
4,301.3 |
8,426.8 |
14,061.6 |
11,718.5 |
| Securities purchased under resale agreements |
42.0 |
42.3 |
– |
– |
9,002.0 |
80.0 |
350.1 |
– |
| Other financial assets – Held for trading |
13,090.7 |
6,283.9 |
5,246.3 |
4,410.9 |
10,539.6 |
8,670.5 |
12,085.4 |
4,987.8 |
Loans and receivables to banks and other
customers |
647,472.4 |
673,890.1 |
712,704.4 |
743,084.6 |
539,906.8 |
554,878.6 |
578,642.4 |
620,753.9 |
| Financial investments – Available for sale |
171,489.2 |
162,538.6 |
156,345.9 |
154,913.6 |
168,306.5 |
168,810.7 |
171,516.3 |
160,092.5 |
| Financial investments – Held to maturity |
64,544.4 |
66,779.0 |
68,368.3 |
69,365.8 |
35,911.1 |
36,124.7 |
37,001.2 |
63,626.6 |
| Financial investments – Loans and receivables |
44,850.3 |
55,418.4 |
48,205.5 |
48,712.5 |
66,464.2 |
61,741.8 |
52,060.8 |
51,824.0 |
| Other assets |
73,962.6 |
82,078.2 |
79,466.4 |
83,026.6 |
66,641.6 |
61,250.5 |
65,741.8 |
75,056.1 |
| Total assets |
1,057,978.0 |
1,095,124.3 |
1,110,453.9 |
1,155,820.7 |
927,114.9 |
933,494.5 |
957,792.4 |
1,020,983.6 |
|
|
|
|
|
|
|
|
|
| Due to banks |
52,951.4 |
58,502.8 |
45,185.2 |
60,244.9 |
39,095.2 |
36,937.4 |
33,417.8 |
71,098.4 |
| Securities sold under resale agreements |
78,220.4 |
77,902.3 |
59,990.4 |
49,532.4 |
115,628.0 |
95,083.4 |
87,040.9 |
69,629.0 |
| Due to other customers/deposits from customers |
784,777.9 |
804,554.5 |
824,859.9 |
857,270.0 |
652,934.5 |
679,948.2 |
710,389.5 |
743,310.6 |
| Other borrowings |
9,330.5 |
8,936.2 |
24,423.7 |
23,786.1 |
9,881.9 |
9,603.9 |
9,578.5 |
9,270.2 |
| Subordinated liabilities |
25,273.4 |
25,142.1 |
25,370.6 |
25,165.9 |
18,541.0 |
17,957.8 |
17,979.1 |
24,849.5 |
| Other liabilities |
26,175.1 |
22,403.6 |
26,510.6 |
30,954.7 |
25,475.6 |
23,169.4 |
22,093.6 |
23,010.5 |
| Shareholders’ funds |
81,249.3 |
97,682.8 |
104,113.5 |
108,866.7 |
65,558.7 |
70,794.4 |
77,293.0 |
79,815.4 |
| Total liabilities |
1,057,978.0 |
1,095,124.3 |
1,110,453.9 |
1,155,820.7 |
927,114.9 |
933,494.5 |
957,792.4 |
1,020,983.6 |
|
|
|
|
|
|
|
|
|
| Quarterly growth (%) |
Loans and receivables to banks and
other customers |
4.30 |
4.08 |
5.76 |
4.26 |
5.88 |
2.77 |
4.28 |
7.28 |
| Due to other customers/deposits from customers |
5.58 |
2.52 |
2.52 |
3.93 |
4.63 |
4.14 |
4.48 |
4.63 |
| Total assets |
3.62 |
3.51 |
1.40 |
4.09 |
5.09 |
0.69 |
2.60 |
6.60 |
Summary of Statements of Financial Position – Bank
|
2017 |
2016 |
| As at |
March 31 |
June 30 |
September 30 |
December 31 |
March 31 |
June 30 |
September 30 |
December 31 |
|
Rs. Mn. |
Rs. Mn. |
Rs. Mn. |
Rs. Mn. |
Rs. Mn. |
Rs. Mn. |
Rs. Mn. |
Rs. Mn. |
|
|
|
|
|
|
|
|
|
| Cash and cash equivalents |
29,312.5 |
36,755.5 |
25,896.0 |
33,224.6 |
25,995.1 |
33,475.1 |
24,647.9 |
30,193.6 |
| Placements with banks |
11,332.2 |
9,332.8 |
12,378.9 |
17,633.3 |
4,301.3 |
8,426.8 |
14,061.6 |
11,718.5 |
| Securities purchased under resale agreements |
42.0 |
42.3 |
– |
– |
9,002.0 |
80.0 |
350.1 |
– |
| Other financial assets – Held for trading |
13,090.7 |
6,283.9 |
5,246.3 |
4,410.9 |
10,539.6 |
8,670.5 |
12,085.4 |
4,987.8 |
Loans and receivables to banks and other
customers |
642,804.7 |
669,327.6 |
708,069.6 |
738,087.1 |
537,473.3 |
551,891.7 |
575,081.6 |
616,642.7 |
| Financial investments – Available for sale |
171,420.0 |
162,343.9 |
156,151.2 |
154,714.1 |
168,288.5 |
168,741.5 |
171,446.0 |
160,023.5 |
| Financial investments – Held to maturity |
61,627.6 |
63,317.1 |
63,567.2 |
63,562.8 |
35,911.1 |
36,124.7 |
37,001.2 |
60,981.3 |
| Financial investments – Loans and receivables |
44,850.3 |
55,418.4 |
48,205.5 |
48,712.5 |
66,464.2 |
61,741.8 |
52,060.8 |
51,824.0 |
| Other assets |
74,334.1 |
82,297.3 |
79,471.0 |
83,028.5 |
66,599.5 |
61,222.2 |
66,564 |
75,829.8 |
| Total assets |
1,048,814.1 |
1,085,118.8 |
1,098,985.7 |
1,143,373.8 |
924,574.6 |
930,374.3 |
953,298.6 |
1,012,201.2 |
|
|
|
|
|
|
|
|
|
| Due to banks |
49,242.8 |
54,875.7 |
41,847.3 |
57,121.0 |
37,185.2 |
34,401.0 |
30,419.2 |
67,608.8 |
| Securities sold under resale agreements |
78,462.7 |
78,121.3 |
60,212.6 |
49,676.8 |
115,831.1 |
95,288.0 |
87,275.7 |
69,867.5 |
| Due to other customers/deposit from customers |
780,813.0 |
799,902.4 |
818,564.4 |
850,127.5 |
653,039.5 |
680,057.5 |
710,457.9 |
739,563.5 |
| Other borrowings |
9,330.5 |
8,936.2 |
24,423.7 |
23,786.1 |
9,881.9 |
9,603.9 |
9,578.5 |
9,270.2 |
| Subordinated liabilities |
25,273.4 |
25,142.1 |
25,370.6 |
25,165.9 |
18,526.0 |
17,942.8 |
17,979.1 |
24,849.5 |
| Other liabilities |
25,948.7 |
22,067.4 |
26,048.1 |
30,397.1 |
25,256.2 |
22,989.7 |
21,824.8 |
22,688.0 |
| Shareholders’ funds |
79,743.0 |
96,073.7 |
102,519.0 |
107,099.4 |
64,854.7 |
70,091.4 |
75,763.4 |
78,353.7 |
| Total liabilities |
1,048,814.1 |
1,085,118.8 |
1,098,985.7 |
1,143,373.8 |
924,574.6 |
930,374.3 |
953,298.6 |
1,012,201.2 |
|
|
|
|
|
|
|
|
|
| Quarterly Growth (%) |
Loans and receivables to banks and
other customers |
4.24 |
4.13 |
5.79 |
4.24 |
5.65 |
2.68 |
4.20 |
7.23 |
| Due to other customers/deposits from customers |
5.58 |
2.44 |
2.33 |
3.86 |
4.64 |
4.14 |
4.47 |
4.10 |
| Total assets |
3.62 |
3.46 |
1.28 |
4.04 |
5.09 |
0.63 |
2.46 |
6.18 |
10. Debt Securities
The Bank did not issue any debt securities during the year ended December 31, 2017.
10.1 Debenture composition
|
Fixed interest rate |
Fixed interest rate |
|
2017 |
2016 |
| Type of issue |
Public |
Public |
Public |
Public |
Public |
Public |
Public |
Public |
| Debenture type |
Type “A” |
Type “B” |
Type “A” |
Type “B” |
Type “A” |
Type “B” |
Type “A” |
Type “B” |
| CSE listing |
Listed |
Listed |
Listed |
Listed |
Listed |
Listed |
Listed |
Listed |
| Issue date |
March 2016 |
March 2016 |
Oct 2016 |
Oct 2016 |
Mar. 2016 |
Mar. 2016 |
Oct. 2016 |
Oct. 2016 |
| Maturity date |
March 2021 |
March 2026 |
Oct 2021 |
Oct 2026 |
Mar. 2021 |
Mar. 2026 |
Oct. 2021 |
Oct. 2026 |
| Interest payable frequency |
Bi-Annually |
Bi-Annually |
Bi-Annually |
Bi-Annually |
Biannually |
Biannually |
Biannually |
Biannually |
| Offered interest rate |
10.75% p.a. |
11.25% p.a. |
12.00% p.a. |
12.25% p.a. |
10.75% p.a. |
11.25% p.a. |
12.00% p.a. |
12.25% p.a. |
| Amount (Rs. Mn.) |
4,430.340 |
1,749.090 |
5,071.800 |
1,928.200 |
4,430.340 |
1,749.090 |
5,071.800 |
1,928.200 |
| Market Values |
| – Highest (Rs.) |
85.33 |
Not traded
during the
year |
96.00 |
Not traded
during the
year |
Not traded
during the
year |
Not traded
during the
year |
Not traded
during the
year |
Not traded
during the
year |
| – Lowest (Rs.) |
81.40 |
87.17 |
| – Year-end (Rs.) |
81.40 |
87.17 |
| Interest Rates |
| – Coupon rate (%) |
10.75 |
11.25 |
12.00 |
12.25 |
10.75 |
11.25 |
12.00 |
12.25 |
| – Effective annual yield (%) |
11.04 |
11.57 |
12.36 |
12.63 |
11.04 |
11.57 |
12.36 |
12.63 |
Interest rate of comparable
Government security |
9.70 |
10.10 |
9.80 |
10.10 |
12.05 |
12.45 |
12.15 |
12.50 |
| Other Ratios as at Date of Last Trade |
| – Interest yield (%) |
17.96 |
N/A |
15.98 |
N/A |
N/A |
N/A |
N/A |
N/A |
| – Yield to maturity (%) |
17.52 |
N/A |
15.74 |
N/A |
N/A |
N/A |
N/A |
N/A |
10.2 Other ratios
|
2017 |
2016 |
| Debt equity ratio (%) |
38.61 |
33.33 |
| Net assets value per share (Rs.) |
107.54 |
87.97 |
| Interest cover (Times) |
11.56 |
14.83 |
| Liquid assets ratio (%) (Minimum 20%) |
27.64 |
27.41 |
10.3 Credit ratings
- The Bank’s credit rating, AA (lka) was reaffirmed by Fitch Ratings Lanka Ltd. in August 2017.
- The Bank’s Bangladesh Operation’s credit rating was reaffirmed at AAA by Credit Rating Information Services Ltd. in June 2017.
10.4 Credit ratings – Debentures
- The credit rating of the Bank’s Subordinated Debentures affirmed in August 2017 at AA-(lka) by Fitch Ratings Lanka Ltd.
Compliance report on the contents of Annual Report in terms of the Listing Rules of the CSE
The Bank has fully complied with all applicable requirements of Section 7.6 of the Listing Rules of the CSE on the contents of the Annual Report and Accounts of a listed entity.
For the readers’ convenience, the table below provides references to the relevant sections of this Annual Report where specific information
is disclosed together with the relevant page numbers.
| Rule No. |
Disclosure requirement |
Section/reference |
Page/s of the printed Annual Report |
|
|
|
|
| 7.6 (i) |
Names of persons who held the position of Directors during the financial year |
- Annual Report of the Board of Directors
|
136 – 145 |
| 7.6 (ii) |
Principal activities of the Bank and its Subsidiaries during the year and any changes therein |
- Note 1.3 of the Accounting Policies
- Group Structure
|
173 – 438 |
| 7.6 (iii) |
The names and the number of shares held by the
20 largest holders of voting and non-voting shares and the percentage of such shares held as at the end of the year |
- Item 5.3 of the “Investor Relations”
|
340 |
| 7.6 (iv) |
The public holding percentage |
- Item 5.3 of the “Investor Relations”
|
340 |
| 7.6 (v) |
Directors’ and Chief Executive Officer’s holding in shares at the beginning and at the end of the financial year |
- Item 5.4 of the “Investor Relations”
- Annual Report of the Board of Directors
|
342
136 – 145 |
| 7.6 (vi) |
Information pertaining to material foreseeable risk factors |
- Item 7 of the “Investor Relations”
|
342 |
| 7.6 (vii) |
Details of material issues pertaining to employees and
industrial relations |
- Item 8 of the “Investor Relations”
|
342 |
| 7.6 (viii) |
Extents, locations, and valuations of land holdings and investment properties as at the end of the year |
- Note 39.5 (a) and (b) to the Financial Statements on “Property, Plant and Equipment”
|
251 – 256 |
| 7.6 (ix) |
Number of shares representing the stated capital as at the end of the year |
- Note 53 to the Financial Statements
on “Stated Capital”
- Item 3 of the “Investor Relations”
|
278
337 |
| 7.6 (x) |
A distribution schedule of the number of holders in each class of equity securities and the percentage of their total holdings as at the end of the year |
- Item 5.2 of the “Investor Relations”
|
339 |
| 7.6 (xi) |
Ratios and market price information:
- Equity – Dividend per share, dividend payout ratio, net asset value per share, market value per share
- Debt – Interest rate of comparable Government Securities,
debt/equity ratio, interest cover and quick asset ratio, market prices and yields during the year
- Any changes in credit rating
|
- Items 4 and 10.2 of the “Investor Relations”
- Items 10.1 and 10.2 of the “Investor Relations”
- Items 10.3 and 10.4 of the “Investor Relations”
|
338 & 346
346
347 |
| 7.6 (xii) |
Significant changes in the Bank or its Subsidiaries fixed assets and the market value of land, if the value differs substantially from the book value as at the end of the year |
- Note 39.5 (b) to the Financial Statements on “Property, Plant and Equipment”
|
252 |
| 7.6 (xiii) |
Details of funds raised through Public Issues, Rights Issues and Private Placements during the year |
- Note 53 to the Financial Statements on
“Stated Capital”
|
278 |
| 7.6 (xiv) |
Information in respect of Employee Share Option Schemes |
|
|
|
- Total number of shares allotted during the financial year, price at which shares were allotted and the details of funding granted to employees (if any)
|
- Notes 53.2 and 54 to the Financial Statements on “Employee Share Option Plans”
|
279 & 280 |
|
- Highest, lowest, and closing price of the share recorded during the financial year
|
- Item 2 of the “Investor Relations”
|
335 |
| 7.6 (xv) |
Disclosures pertaining to Corporate Governance practices in
terms of Rules 7.10.3, 7.10.5 (c) and 7.10.6 (c) of Section 7 of the Listing Rules |
- Not applicable since the Bank received an exemption in terms of Section 7.10 (c) of the Listing Rules
|
– |
| 7.6 (xvi) |
Disclosures on Related Party Transactions exceeding 10% of the Equity or 5% of the total assets of the Entity as per Audited
Financial Statements, whichever is lower |
- The Bank did not have any related party transactions exceeding this threshold as
at end 2017
|
– |