
1. Listing Details
| Listed Exchange | : Colombo Stock Exchange (CSE) - Main Board |
| Listed Securities | : Ordinary shares |
| Rated Unsecured Subordinated Redeemable Debentures | |
| Stock Symbol | : NDB.N0000 |
2. Submission of Financial Statements to the Colombo Stock Exchange as per Listing Rules - 2013
| Financial statements | Submission to CSE as per rule 7.4 & 7.5 of the Listing Rules of the CSE |
Date of submission by the Bank | Level of compliance |
| Unaudited Financial Statements - Q1 | Within 45 days from the end of the quarter | 14 May 2013 | Complied |
| Unaudited Financial Statements - Q2 | Within 45 days from the end of the quarter | 14 August 2013 | Complied |
| Unaudited Financial Statements - Q3 | Within 45 days from the end of the quarter | 14 November 2013 | Complied |
| Unaudited Financial Statements - Q4 | Within 60 days from the end of the quarter | 13 February 2014 | Complied |
| Audited financial statements for the year ended 31 December 2013 |
Within five months from the year end | Submitted with the Annual Report of the Company |
Complied |
The full report on Accounts and Interim Financial Statements can be viewed on our WEB site (http://www.ndbbank.com/Investor and Community Relations)
3. Bank’s Credit Ratings
The Bank’s credit ratings are as follows:
Fitch Ratings Lanka Ltd.
| National Long Term Rating | AA (-) lka/Stable Outlook [2012: AA (lka)/Negative Outlook] |
| International Rating | B+/Stable Outlook |
Standard and Poor Rating Services
| International Rating | B+ (long-term)/Stable Outlook |
| B (Short-Term)/Stable Outlook |
4. Analysis of Ordinary Shareholders as at 31 December 2013 as per Rule 7.6 (x) of the Listing Rules of the Colombo Stock Exchange
(i)
| As at 31.12.2013 | As at 31.12.2012 | |||||||||
| Shareholding Range | No. of Shareholders |
% | No. of Shares |
% | No. of Shareholders |
% | No. of Shares |
% | ||
| 1 | – | 1,000 | 5,212 | 67.73 | 1,760,740 | 1.10 | 5,497 | 65.64 | 1,956,081 | 1.19 |
| 1,001 | – | 10,000 | 2,048 | 26.61 | 6,352,964 | 3.90 | 2,361 | 28.19 | 7,454,083 | 4.54 |
| 10,001 | – | 100,000 | 346 | 4.50 | 10,076,661 | 6.10 | 428 | 5.11 | 12,384,077 | 7.54 |
| 100,001 | – | 1,000,000 | 61 | 0.79 | 20,039,880 | 12.20 | 65 | 0.78 | 20,884,079 | 12.72 |
| Over 1,000,000 | 28 | 0.37 | 126,462,789 | 76.70 | 23 | 0.28 | 116,323,582 | 70.84 | ||
| Total | 7,695 | 100.00 | 164,693,034 | 100.00 | 8,374 | 100.00 | 159,001,902* | 96.83* | ||
* Out of the 164,201,902 shares in issue as at 31 December 2012, 5,200,000 shares which were issued in 2006 representing 3.17% was not allotted.
(ii) Resident/Non-Resident Shareholding
| As at 31.12.2013 | As at 31.12.2012 | ||||||||
| Shareholding | No. of Shareholders |
% | No. of Shares | % | No. of Shareholders |
% | No. of Shares | % | |
| Resident | 7,529 | 98.00 | 115,337,647 | 70.00 | 8,190 | 98.00 | 114,930,484 | 69.99 | |
| Non-resident | 166 | 2.00 | 49,355,387 | 30.00 | 184 | 2.00 | 44,071,418 | 26.86 | |
| Total | 7,695 | 100.00 | 164,693,034 | 100.00 | 8,374 | 100.00 | 159,001,902* | 96.83* | |
* Out of the 164,201,902 shares in issue as at 31 December 2012, 5,200,000 shares which were issued in 2006 representing 3.17% was not allotted.
(iii) Individual/Institutional Shareholding
| As at 31.12.2013 | As at 31.12.2012 | |||||||
| Shareholding | No. of Shareholders |
% | No. of Shares |
% | No. of Shareholders |
% | No. of Shares |
% |
| Individual | 7,243 | 94.00 | 30,769,120 | 19.00 | 7,852 | 94.00 | 33,477,540 | 20.38 |
| Institutional | 452 | 6.00 | 133,923,914 | 81.00 | 522 | 6.00 | 125,524,362 | 76.45 |
| Total | 7,695 | 100.00 | 164,693,034 | 100.00 | 8,374 | 100.00 | 159,001,902* | 96.83* |
* Out of the 164,201,902 shares in issue as at 31 December 2012, 5,200,000 shares which were issued in 2006 representing 3.17% was not allotted.
5. 20 Largest Registered Shareholders of the Bank as at 31 December 2013:
| 2013 | 2012 | ||||
| Name | No of Shares |
% | No of Shares | % | |
| 1. | Bank of Ceylon No. 1 Account | 16,371,076 | 9.94 | 16,371,076 | 9.97 |
| 2. | Employees’ Provident Fund | 16,010,248 | 9.72 | 15,810,248 | 9.63 |
| 3. | Sri Lanka Insurance Corporation Ltd. - General Fund | 9,388,488 | 5.70 | 9,388,488 | 5.72 |
| 4. | Dr S Yaddehige | 8,669,000 | 5.26 | 8,669,000 | 5.28 |
| 5. | HSBC International Nominees Ltd. - Snfe - Ntasian Discovery Master Fund | 8,432,154 | 5.12 | 4,686,400 | 2.85 |
| 6. | Sri Lanka Insurance Corporation Ltd. - Life Fund | 7,805,426 | 4.74 | 7,805,426 | 4.75 |
| 7. | HSBC International Nominees Ltd. - BPSS LUX - Aberdeen Global Asia Pacific Equity Fund | 5,715,450 | 3.47 | 5,715,450 | 3.48 |
| 8. | Employees’ Trust Fund Board | 5,303,700 | 3.22 | 5,303,700 | 3.23 |
| 9. | HSBC International Nominees Ltd. - MSNY - BAY Pond Partners L.P. | 4,501,200 | 2.73 | 4,501,200 | 2.74 |
| 10. | HSBC International Nominees Ltd. - BPSS LDN - Aberdeen Asia Pacific Fund | 4,294,800 | 2.61 | 4,294,800 | 2.62 |
| 11. | Hatton National Bank PLC A/C No. 01 | 4,282,200 | 2.60 | 4,282,200 | 2.61 |
| 12. | NDB-ESOP | 4,133,726 | 2.51 | 4,133,726 | 2.52 |
| 13. | Asian Alliance Insurance PLC - Account Number 03/Life Shareholders’ Fund | 3,450,977 | 2.10 | 3,500,000 | 2.13 |
| 14. | BNY-CF Ruffer Investment Funds: CF Ruffer Pacific Fund | 3,000,000 | 1.82 | 3,000,000 | 1.83 |
| 15. | Mr A K Pathirage | 2,970,000 | 1.80 | 3,470,000 | 2.11 |
| 16. | Asian Alliance Insurance PLC - General Fund Account No. 01 | 2,540,977 | 1.54 | 2,741,700 | 1.67 |
| 17. | Asiri Hospital Holdings PLC | 2,411,583 | 1.46 | 2,408,136 | 1.47 |
| 18. | Asian Alliance Insurance PLC - Life Fund | 2,159,746 | 1.31 | 910,000 | 0.55 |
| 19. | HSBC International Nominees Ltd. - MSNY - BAY Pond Investors (Bermuda) LP | 2,045,200 | 1.24 | 2,045,200 | 1.25 |
| 20. | United Motors Lanka PLC | 2,000,000 | 1.21 | – | 0.00 |
| Total | 115,485,951 | 70.12 | 109,036,750 | 66.40 | |
| Percentage of Shares held by the Public | 75.62% | 96.12% |
6. Information on Share Trading
(i) Share Valuation
The market value of the National Development Bank PLC ordinary shares on 31 December 2013 was
LKR 160.50 per share. The highest and lowest values recorded during this 12 month period were LKR 182.50 on
10 May 2013 and LKR 138.00 on 18 September 2013.
Movement of the Bank’s share price compared with the two main indices and the sector index
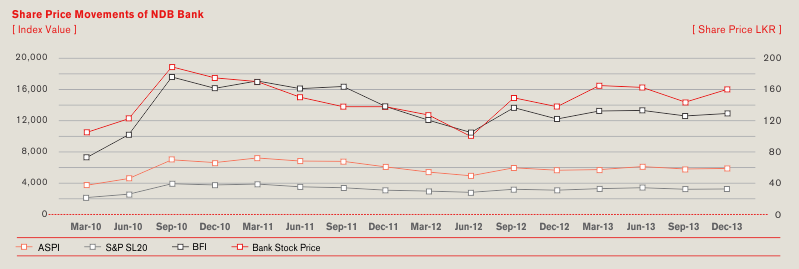
(ii) Share Price Movement Trend over the Past 5 Years
| Year | 2013 | 2012 | 2011 | 2010 | 2009 |
| Highest Price (LKR) | 182.50 | 155.00 | 186.00 | 410.00 | 208.00 |
| Lowest Price (LKR) | 138.00 | 96.00 | 120.00 | 202.00 | 88.00 |
| Price as at 31 December (LKR) | 160.50 | 137.90 | 138.10 | 349.50 | 206.00 |
| Total number of shares in issue | 164,693,034 | 164,201,902 | 164,201,902 | 82,100,951 | 81,855,385 |
(iii) Information on Share Trading
| Year | 2013 | 2012 | 2011 | 2010 | 2009 |
| (a) Number of transactions | 11,406 | 9,854 | 7,906 | 11,862 | 13,935 |
| (b) Number of shares traded | 31,631,020 | 21,406,492 | 20,108,047 | 32,390,146 | 50,902,803 |
| (c) Value of shares traded (LKR mn) | 5,112,129,480.70 | 2,675,791,205.50 | 3,736,603,225.90 | 8,514,002,130.85 | 6,773,902,259 |
(iv) Information on Market Capitalization and Shareholders’ Funds
| Year | 2013 LKR mn |
2012 LKR mn |
2011 LKR mn |
2010 LKR mn |
2009 LKR mn |
| A - Shareholders’ Funds - NDB | 19,656 | 14,942 | 12,675 | 11,724 | 11,095 |
| B - NDB Market Capitalization | 26,433 | 22,643 | 22,676 | 28,694 | 16,862 |
| C - CSE Market Capitalization | 2,422,985 | 2,167,581 | 2,213,873 | 2,210,452 | 1,092,138 |
| D - NDB Market Capitalization as a % of CSE Market Capitalization |
1.09 | 1.04 | 1.02 | 1.30 | 1.54 |
(v) Information on Dividends and Net Asset Value
| Year | 2013 | 2012 | 2011 | 2010 | 2009 |
| Dividend Per Share (LKR) | 10.00 | 15.00 | 7.50 | 8.50 | 8.00 |
| Dividend Payout Ratio (%) | 62.00 | 79.00 | 49.00 | 33.00 | 31.00 |
| Net Assets Value (LKR) | 148.85 | 151.54 | 103.07 | 93.15 | 86.72 |
(vi) Directors’ Interest in Shares of the Bank
| Directors’ Interest in Shares of NDB as at 31 December 2013 | Directors’ Interest in Shares of NDB as at 31 December 2012 | |||
| Name | No. of Shares | Name | No. of Shares | |
| Sunil G Wijesinha | 880 | Hemaka Amarasuriya | 18,150 | |
| Ashok Pathirage | 3,993,000* | Ashok Pathirage | 3,470,000 | |
| Rajendra Theagarajah | 126 | Russell de Mel | 7,116 | |
| Trevine Jayasekara | – | Trevine Jayasekara | – | |
| Kimarli Fernando | – | Kimarli Fernando | – | |
| Anura Siriwardena | – | Anura Siriwardena | – | |
| Sarath Wikramanayake | – | Sarath Wikramanayake | – | |
| Chandra Ekanayake | – | Chandra Ekanayake | – | |
| Sujeewa Rajapakse | – | Sujeewa Rajapakse | – | |
| Indrani Sugathadasa | – | |||
* Includes shares held in slash account.
7. Debenture Information
(i) In December 2013, the Bank issued by way of a public offer one hundred million (100,000,000) rated, unsecured, subordinated, redeemable debentures of the par value of rupees one hundred (LKR 100/-) each aggregating to the value of rupees ten thousand million (LKR 10,000,000,000/-). The proceeds of these debentures were utilized to support the Bank’s Tier II Capital. The details of the said debentures are as follows:
In 2011, the Bank privately placed rated subordinated unsecured unlisted redeemable debentures having an aggregate face value of LKR 400,000,000. The proceeds of these debentures were utilized for re-lending purposes. The details of the said debentures are as follows:
(ii) Information On Debentures - Bank
| Market Value | Interest Rate | ||||||||
| Type of Debenture | CSE Listing | Interest Payable Frequency | Balance as at 31 December 2013 LKR mn |
Highest LKR mn | Lowest LKR | Year end LKR | Coupon Rate % | Effective Annual Yield % | Interest Rate of Comparable Security % |
| Fixed Rate - Rated Unsecured Subordinated Redeemable Debentures |
|||||||||
| A - Dec. 2013/Dec. 2018 | Listed | Semi Annually | 1,243 | Not traded during the period | 13.00 | 13.42 | 9.78 | ||
| B - Dec. 2013/Dec. 2018 | Listed | Annually | 1,529 | Not traded during the period | 13.40 | 13.40 | 9.78 | ||
| C - Dec. 2013/Dec. 2023 | Listed | Annually | 3,638 | Not traded during the period | 13.90 | 13.90 | 11.00 | ||
| D - Dec. 2013/Dec. 2025 | Listed | Annually | 3,590 | Not traded during the period | 14.00 | 14.00 | 11.39 | ||
| Floating Rate - Unsecured Redeemable Debentures |
|||||||||
| 2011 - 2016 (3 month TB rate (gross)+1% p.a.) | Unlisted | Quarterly | 400 | – | – | – | 11.43 | 11.93 | 7.78 |
| Total Debentures | 10,400 | ||||||||
* Three months Treasury Bill rate before deducting 10% withholding tax as published by the Central Bank of Sri Lanka has been used.
(iii) Information on Debentures of the Bank (As per Rule No. 7.6 X (1) of the Listing Rules of the Colombo Stock Exchange:
| 2013 | 2012 | |
| Debt Equity Ratio (%) | 8.99 | 9.54 |
| Interest Cover (Times) | 1.49 | 1.49 |
| Liquid Assets Ratio (%) - Domestic Banking Unit | 26.22 | 22.02 |
| Liquid Assets Ratio (%) - Foreign Currency Banking Unit | 26.06 | 24.92 |
Credit Rating of Debentures
The subordinated Debentures are rated as A+ by Fitch Ratings Lanka Ltd.
Directors’ Interest in Debentures as at 31 December 2013
| Name | No. of Debentures |
| Sunil G Wijesinha | 10,000 |
| Ashok Pathirage | – |
| Rajendra Theagarajah | – |
| Trevine Jayasekara | – |
| Kimarli Fernando | – |
| Anura Siriwardena | – |
| Sarath Wikramanayake | – |
| Chandra Ekanayake | – |
| Sujeewa Rajapakse | – |
| Indrani Sugathadasa | – |
8. Financial Statements in USD
Income Statement
| BANK | GROUP | |||||
| For the year ended 31 December | 2013 USD ’000 |
2012 USD ’000 |
% Change | 2013 USD ’000 |
2012 USD ’000 |
% Change |
| Interest income | 159,249 | 134,385 | 19 | 160,503 | 135,701 | 18 |
| Interest expenses | 106,597 | 90,099 | 18 | 106,309 | 89,658 | 19 |
| Net interest income | 52,652 | 44,286 | 19 | 54,194 | 46,043 | 18 |
| Fee and commission income | 12,476 | 9,578 | 30 | 16,801 | 11,980 | 40 |
| Net trading gains/(losses) | 9,829 | 7,994 | 23 | 14,440 | 10,069 | 43 |
| Other operating income | 47,666 | 7,893 | 504 | 3,829 | 50,111 | (92) |
| Total operating income | 122,623 | 69,751 | 76 | 89,264 | 118,203 | (24) |
| Impairment
Charges/(Reversal) for Loans and Other Losses |
9,570 | 840 | 1,040 | 9,745 | 407 | 2,297 |
| Net operating income | 113,053 | 68,911 | 64 | 79,519 | 117,796 | (32) |
| Less: Operating expenses | ||||||
| Personnel expenses | 18,466 | 17,192 | 7 | 20,562 | 18,463 | 11 |
| Other expenses | 19,748 | 15,267 | 29 | 22,442 | 17,119 | 31 |
| Total operating expenses | 38,214 | 32,459 | 18 | 43,004 | 35,582 | 21 |
| Operating profit before Value Added Tax (VAT) | 74,839 | 36,452 | 105 | 36,515 | 82,214 | (56) |
| Value Added Tax (VAT) on financial services | (7,037) | (4,924) | 43 | (7,037) | (4,925) | 43 |
| Operating profit after Value Added TAX (VAT) | 67,802 | 31,528 | 115 | 29,478 | 77,289 | (62) |
| Share of associate companies’ profits/(losses) | – | – | – | 380 | 3,471 | (89) |
| Profit before taxation | 67,802 | 31,528 | 115 | 29,858 | 80,760 | (63) |
| Taxation | (8,106) | (8,393) | (3) | (8,895) | (10,092) | (12) |
| Profit for the year | 59,696 | 23,135 | 158 | 20,963 | 70,668 | (70) |
| Profit Attributable to: | ||||||
| Equity holders of the parent | 59,696 | 23,135 | 158 | 20,420 | 70,050 | (70) |
| Non-controlling interests | – | – | – | 543 | 618 | (10) |
| 59,696 | 23,135 | 158 | 20,963 | 70,668 | (70) | |
Statement of Comprehensive Income
| BANK | GROUP | |||||
| For the year ended 31 December | 2013 USD ’000 |
2012 USD ’000 |
% Change | 2013 USD ’000 |
2012 USD ’000 |
% Change |
| Profit for the year | 59,696 | 23,135 | 158 | 20,963 | 70,668 | (70) |
| Exchange gain from valuation of a foreign operation |
– | – | – | (86) | 167 | (151) |
| Gains and losses on available-for-sale investments |
1,145 | – | 100 | 1,617 | – | 100 |
| Provisions made for terminal benefits | (274) | – | (100) | (274) | – | (100) |
| Total other comprehensive income/(expenses) | 871 | – | 100 | 1,257 | 167 | 652 |
| Less: Tax expenses relating to components of other comprehensive income |
(295) | – | (100) | (427) | – | (100) |
| Other comprehensive income for the year, net of taxes |
576 | – | 100 | 830 | 167 | 397 |
| Total comprehensive income for the year | 60,270 | 23,135 | 160 | 21,793 | 70,835 | (69) |
| Attributable to: | ||||||
| Equity holders of the parent | 60,270 | 23,135 | 160 | 21,259 | 70,194 | (69) |
| Non-controlling interests | – | – | – | 534 | 641 | (17) |
| 60,270 | 23,135 | 160 | 21,793 | 70,835 | (69) | |
Statement of Financial Position
| BANK | GROUP | |||||
| As at 31 December | 2013 USD ’000 |
2012 USD ’000 |
% Change | 2013 USD ’000 |
2012 USD ’000 |
% Change |
| Assets | ||||||
| Cash and cash equivalents | 19,970 | 27,297 | (27) | 20,407 | 28,510 | (28) |
| Balances with Central Bank | 40,834 | 47,645 | (14) | 40,834 | 47,645 | (14) |
| Placements with banks | 1,000 | 27,917 | (96) | 1,000 | 27,917 | (96) |
| Derivative financial instruments | 8,792 | 13,383 | (34) | 8,792 | 13,383 | (34) |
| Other financial assets held-for-trading | 81,994 | 7,710 | 964 | 108,559 | 89,370 | 21 |
| Loans and receivables to banks | 4,907 | 9,281 | (47) | 4,907 | 9,281 | (47) |
| Loans and receivables to other customers | 1,046,436 | 909,744 | 15 | 1,046,896 | 910,110 | 15 |
| Financial investments - Loans and receivables | 121,128 | 50,557 | 140 | 128,426 | 55,599 | 131 |
| Financial investments - Available-for-sale | 45,755 | 523 | 8,644 | 47,170 | 1,361 | 3,366 |
| Financial investments - Held-to-maturity | 134,625 | 151,037 | (11) | 141,190 | 150,770 | (6) |
| Investments in subsidiary companies | 15,584 | 20,715 | (25) | – | – | 0 |
| Investments in associate companies | 474 | 145 | 226 | 587 | 261 | 125 |
| Investment property | – | – | 0 | 10,583 | 10,162 | 4 |
| Intangible assets | 1,992 | 2,136 | (7) | 2,269 | 2,500 | (9) |
| Property, plant & equipment | 6,676 | 6,715 | (1) | 8,998 | 9,588 | (6) |
| Other assets | 9,097 | 7,345 | 24 | 11,157 | 9,056 | 23 |
| Total assets | 1,539,264 | 1,282,150 | 20 | 1,581,775 | 1,365,513 | 16 |
| BANK | GROUP | |||||
| As at 31 December | 2013 USD ’000 |
2012 USD ’000 |
% Change | 2013 USD ’000 |
2012 USD ’000 |
% Change |
| Liabilities | ||||||
| Due to banks | 79,947 | 18,196 | 339 | 79,947 | 18,196 | 339 |
| Derivative financial instruments | 6,251 | 13,622 | (54) | 6,251 | 13,622 | (54) |
| Due to other customers | 992,964 | 843,926 | 18 | 989,842 | 842,305 | 18 |
| Debt securities issued and other borrowed funds | 186,775 | 238,101 | (22) | 186,545 | 237,787 | (22) |
| Tax liabilities | 2,035 | 5,147 | (60) | 2,296 | 4,971 | (54) |
| Deferred tax | 2,390 | 626 | 281 | 2,481 | 621 | 300 |
| Provision | 1,300 | 958 | 36 | 1,643 | 1,018 | 61 |
| Other liabilities | 28,189 | 26,695 | 6 | 29,448 | 27,667 | 6 |
| Subordinated term debts | 89,351 | 17,684 | 405 | 89,351 | 17,684 | 405 |
| Total liabilities | 1,389,202 | 1,164,955 | 19 | 1,387,804 | 1,163,871 | 19 |
| Equity | ||||||
| Stated capital | 8,971 | 8,573 | 5 | 7,218 | 6,776 | 7 |
| Statutory reserve fund | 7,331 | 6,892 | 6 | 7,331 | 6,892 | 6 |
| Investment fund account | 13,054 | 7,250 | 80 | 13,054 | 7,250 | 80 |
| Available-for-sale reserve | 816 | – | 100 | 1,152 | – | 100 |
| Share-based payment reserve | 171 | – | 100 | 171 | – | 100 |
| Retained earnings | 119,719 | 94,480 | 27 | 158,561 | 174,242 | (9) |
| Total equity to equity owners of the Bank | 150,062 | 117,195 | 28 | 187,487 | 195,160 | (4) |
| Non-controlling interest | – | – | 6,484 | 6,482 | 0 | |
| Total equity | 150,062 | 117,195 | 27 | 193,971 | 201,644 | (4) |
| Total liabilities and equity | 1,539,264 | 1,282,150 | 20 | 1,581,775 | 1,365,513 | 16 |
| Commitments and contingencies | 1,355,261 | 1,245,026 | 9 | 1,355,260 | 1,245,026 | 9 |
USD Accounts
The Income Statement and the Statement of Financial Position given in US Dollars are solely for the shareholders, investors and any other users of Financial Statements and do not form part of the Financial Statements.
9. Interim Financial Performance
| BANK | Quarter 4 | Quarter 3 | Quarter 2 | Quarter 1 | Quarter 4 | Quarter 3 | Quarter 2 | Quarter 1 | |
| LKR ’000 | 12.31.2013 | 09.30.2013 | 06.30.2013 | 03.31.2103 | 12.31.2012 | 09.30.2012 | 06.30.2012 | 03.31.2102 | |
| Net interest income | 1,706,507 | 1,811,528 | 1,793,005 | 1,575,021 | 1,564,848 | 1,471,721 | 1,307,570 | 1,296,518 | |
| Other operating income | 936,967 | 779,357 | 747,425 | 6,517,490 | 466,518 | 542,070 | 1,048,037 | 1,069,433 | |
| Total operating income | 2,643,474 | 2,590,885 | 2,540,430 | 8,092,511 | 2,031,366 | 2,013,791 | 2,355,607 | 2,365,951 | |
| Impairment charges for loans and other losses | 1,012,095 | 77,201 | 98,735 | 50,171 | (36,678) | 11,717 | 386,517 | (303,944) | |
| Net operating income | 1,631,379 | 2,513,684 | 2,441,695 | 8,042,340 | 2,068,044 | 2,002,074 | 1,969,090 | 2,669,895 | |
| Total operating expenses | 1,330,606 | 1,281,566 | 1,177,257 | 1,154,773 | 1,048,292 | 1,078,168 | 1,004,882 | 970,851 | |
| Profit from operations | 300,773 | 1,232,118 | 1,264,438 | 6,887,567 | 1,019,752 | 923,906 | 964,208 | 1,699,044 | |
| Share of associate companies' profit | – | – | – | – | – | – | – | – | |
| Profit before taxation | 300,773 | 1,232,118 | 1,264,438 | 6,887,567 | 1,019,752 | 923,906 | 964,208 | 1,699,044 | |
| Taxation | (131,775) | (538,805) | (672,704) | (618,376) | (346,300) | (375,085) | (501,334) | (460,233) | |
| Profit for the period | 168,998 | 693,313 | 591,734 | 6,269,191 | 673,452 | 548,820 | 462,873 | 1,238,811 | |
| Profit Attributable to: | |||||||||
| Equity holders of the parent | 168,998 | 693,313 | 591,734 | 6,269,191 | 673,452 | 548,820 | 462,873 | 1,238,811 | |
| Non-controlling interests | – | – | – | – | – | – | – | – | |
| 168,998 | 693,313 | 591,734 | 6,269,191 | 673,452 | 548,820 | 462,873 | 1,238,811 | ||
| Basic Earnings per share (in LKR) |
1.03 | 4.21 | 3.60 | 38.18 | 4.10 | 3.34 | 2.82 | 1.84 |
| GROUP | Quarter 4 | Quarter 3 | Quarter 2 | Quarter 1 | Quarter 4 | Quarter 3 | Quarter 2 | Quarter 1 | |
| LKR ’000 | 12.31.2013 | 09.30.2013 | 06.30.2013 | 03.31.2103 | 12.31.2012 | 09.30.2012 | 06.30.2012 | 03.31.2102 | |
| Net interest income | 1,782,684 | 1,858,010 | 1,836,605 | 1,608,231 | 1,684,580 | 1,512,293 | 1,364,751 | 1,377,890 | |
| Other operating income | 1,443,552 | 1,067,697 | 1,089,447 | 865,197 | 6,403,546 | 722,337 | 925,056 | 887,459 | |
| Total operating income | 3,226,236 | 2,925,707 | 2,926,052 | 2,473,428 | 8,088,126 | 2,234,630 | 2,289,807 | 2,265,349 | |
| Impairment charges for loans and other losses | 1,055,348 | 83,201 | 98,735 | 23,480 | (103,447) | 11,717 | 386,517 | (303,944) | |
| Net operating income | 2,170,888 | 2,842,506 | 2,827,317 | 2,449,948 | 8,191,573 | 2,222,913 | 1,903,290 | 2,569,293 | |
| Total operating expenses | 1,524,781 | 1,408,122 | 1,309,853 | 1,322,364 | 1,132,508 | 1,179,383 | 1,112,133 | 1,072,174 | |
| Profit from operations | 646,107 | 1,434,384 | 1,517,464 | 1,127,584 | 7,059,065 | 1,043,530 | 791,157 | 1,497,119 | |
| Share of associate companies' profit | 9,562 | 28,980 | 8,210 | 2,468 | 266,196 | 60,314 | 62,414 | 49,796 | |
| Profit before taxation | 655,669 | 1,463,364 | 1,525,674 | 1,130,052 | 7,325,261 | 1,103,844 | 853,571 | 1,546,915 | |
| Taxation | (155,537) | (558,259) | (718,646) | (630,088) | (371,859) | (420,330) | (572,141) | (533,324) | |
| Profit for the period | 500,132 | 905,105 | 807,028 | 499,964 | 6,953,403 | 683,514 | 281,430 | 1,013,591 | |
| Profit Attributable to: | |||||||||
| Equity holders of the parent | 445,324 | 891,961 | 797,753 | 506,888 | 6,916,429 | 667,918 | 267,022 | 1,002,454 | |
| Non-controlling interests | 54,808 | 13,144 | 9,275 | (6,924) | 36,976 | 15,596 | 14,408 | 11,138 | |
| 500,132 | 905,105 | 807,028 | 499,964 | 6,953,403 | 683,514 | 281,430 | 1,013,592 | ||
| Basic Earnings per share (in LKR) | 2.70 | 5.42 | 4.86 | 3.09 | 41.72 | 4.07 | 1.63 | 4.47 |
| BANK | As at | As at | As at | As at | As at | As at | As at | As at | |
| LKR ’000 | 31.12.2013 | 30.09.2013 | 30.06.2013 | 31.03.2013 | 31.12.2012 | 30.09.2012 | 30.06.2012 | 31.03.2012 | |
| Cash and cash equivalents | 8,080,826 | 8,746,703 | 15,224,455 | 16,863,330 | 13,114,541 | 12,224,021 | 14,460,187 | 9,710,502 | |
| Net loans and advances | 137,463,159 | 123,465,534 | 121,925,593 | 116,894,891 | 117,175,703 | 111,433,236 | 107,399,030 | 103,693,923 | |
| Investments | 52,242,397 | 48,417,566 | 38,884,857 | 36,198,102 | 29,412,686 | 32,984,636 | 27,692,527 | 27,303,268 | |
| Other assets | 3,472,246 | 2,595,732 | 4,257,589 | 3,484,992 | 3,771,366 | 2,384,367 | 2,762,071 | 2,768,871 | |
| Total assets | 201,258,628 | 183,225,533 | 180,292,494 | 173,441,315 | 163,474,296 | 159,026,260 | 152,313,815 | 143,476,564 | |
| Customer deposits | 129,830,029 | 118,489,102 | 117,639,980 | 110,091,898 | 107,600,583 | 96,517,676 | 95,086,142 | 88,445,517 | |
| Borrowings | 46,556,578 | 39,878,258 | 36,845,563 | 36,879,823 | 34,932,507 | 41,608,262 | 37,264,955 | 36,165,959 | |
| Other liabilities | 5,251,544 | 4,682,791 | 6,404,693 | 7,721,035 | 5,998,805 | 6,476,447 | 6,098,518 | 5,772,447 | |
| Total equity | 19,620,477 | 20,175,384 | 19,402,258 | 18,748,561 | 14,942,401 | 14,423,875 | 13,864,200 | 13,092,641 | |
| Total liabilities & equity | 201,258,628 | 183,225,535 | 180,292,494 | 173,441,315 | 163,474,296 | 159,026,260 | 152,313,815 | 143,476,564 | |
| Net asset value | 119.13 | 122.50 | 118.16 | 114.18 | 91.00 | 87.84 | 84.43 | 79.74 |
| GROUP | As at | As at | As at | As at | As at | As at | As at | As at | |
| LKR ’000 | 31.12.2013 | 30.09.2013 | 30.06.2013 | 31.03.2013 | 31.12.2012 | 30.09.2012 | 30.06.2012 | 31.03.2012 | |
| Cash and cash equivalents | 8,138,013 | 8,794,081 | 15,285,968 | 17,108,941 | 13,269,129 | 12,399,540 | 14,583,264 | 10,247,438 | |
| Net loans and advances | 137,523,341 | 123,505,308 | 121,964,938 | 116,955,138 | 117,222,378 | 112,052,416 | 108,197,047 | 104,686,025 | |
| Investments | 55,690,627 | 51,558,903 | 41,765,435 | 38,884,247 | 37,913,589 | 34,827,342 | 29,268,216 | 28,116,188 | |
| Other assets | 5,465,140 | 4,448,933 | 6,200,663 | 5,315,740 | 5,697,975 | 4,647,238 | 4,980,881 | 4,693,100 | |
| Total assets | 206,817,121 | 188,307,225 | 185,217,004 | 178,264,066 | 174,103,071 | 163,926,536 | 157,029,408 | 147,742,751 | |
| Customer deposits | 129,421,813 | 118,094,538 | 117,290,318 | 109,742,736 | 107,393,866 | 96,517,676 | 95,086,142 | 88,445,517 | |
| Borrowings | 46,526,578 | 39,841,559 | 36,800,553 | 36,850,288 | 34,892,582 | 41,348,643 | 36,941,267 | 35,132,981 | |
| Other liabilities | 5,507,076 | 4,819,685 | 6,560,392 | 7,940,684 | 6,107,171 | 6,647,013 | 6,277,948 | 6,021,007 | |
| Shareholders’ funds | 24,513,808 | 24,757,448 | 23,785,039 | 22,926,435 | 24,883,041 | 18,491,046 | 17,816,427 | 17,240,261 | |
| Non-controlling interests | 847,846 | 793,995 | 780,702 | 803,923 | 826,411 | 922,158 | 907,624 | 902,985 | |
| Total liabilities & equity | 206,817,121 | 188,307,225 | 185,217,004 | 178,264,066 | 174,103,071 | 163,926,536 | 157,029,408 | 147,742,751 | |
| Net asset value | 148.85 | 150.32 | 144.85 | 139.62 | 151.54 | 112.61 | 108.50 | 104.99 |
10. Ten Years at a Glance (Group Performance)
Income Statement
| LKR mn | 2004 | 2005 | 2006 | 2007 | 2008 | 2009 | 2010 | 2011 | 2012 | 2013 |
| Income | ||||||||||
| Net interest income | 2,246 | 2,693 | 2,853 | 3,522 | 3,787 | 4,233 | 4,163 | 4,910 | 5,819 | 7,012 |
| Other income | 1,471 | 2,081 | 2,133 | 1,474 | 1,662 | 2,560 | 2,785 | 3,012 | 9,119 | 4,537 |
| Total operating income | 3,717 | 4,774 | 4,986 | 4,996 | 5,449 | 6,793 | 6,948 | 7,922 | 14,938 | 11,549 |
| Charges/(reversals) impairment charges for loans and receivables and other losses | 279 | 153 | 13 | 65 | 116 | 373 | (172) | (88) | 51 | 1,261 |
| Net operating income | 3,438 | 4,621 | 4,972 | 4,932 | 5,333 | 6,420 | 7,119 | 8,010 | 14,887 | 10,288 |
| Less Operating Expenses | ||||||||||
| Personnel costs | 916 | 1,132 | 830 | 949 | 1,151 | 1,300 | 1,567 | 2,118 | 2,333 | 2,660 |
| Other operating costs | 1,267 | 1,645 | 929 | 1,104 | 1,237 | 1,370 | 1,496 | 1,863 | 2,163 | 2,904 |
| Total operating expenses | 2,183 | 2,777 | 1,760 | 2,053 | 2,388 | 2,670 | 3,063 | 3,981 | 4,496 | 5,564 |
| Operating Profit before Share of Associate | ||||||||||
| Co's profit before tax | 1,255 | 1,844 | 3,214 | 2,878 | 2,945 | 3,750 | 4,057 | 4,029 | 10,391 | 4,724 |
| Share of associate Co's profit | 31 | 22 | 214 | 179 | 172 | 526 | 295 | 331 | 439 | 49 |
| Profit before taxation | 1,288 | 1,866 | 3,428 | 3,057 | 3,117 | 4,276 | 4,352 | 4,360 | 10,830 | 4,773 |
| Taxation | (481) | (593) | (1,222) | (1,421) | (1,409) | (2,154) | (2,176) | (1,597) | (1,898) | (2,061) |
| Profit after taxation | 805 | 1,273 | 2,207 | 1,636 | 1,708 | 2,122 | 2,176 | 2,763 | 8,932 | 2,712 |
| Non-controlling interests | (102) | (237) | (176) | (115) | (103) | (37) | (73) | (235) | (78) | (70) |
| Profit attributable to equity holders of the parent | 703 | 1,036 | 2,030 | 1,521 | 1,605 | 2,085 | 2,103 | 2,528 | 8,854 | 2,642 |
Statement of Financial Position
| LKR mn | 2004 | 2005 | 2006 | 2007 | 2008 | 2009 | 2010 | 2011 | 2012 | 2013 |
| Assets | ||||||||||
| Liquid assets | 14,101 | 2,917 | 6,042 | 7,748 | 5,883 | 8,243 | 5,586 | 7,651 | 13,269 | 8,138 |
| Investments | 5,633 | 19,078 | 12,170 | 14,701 | 18,509 | 32,128 | 20,021 | 27,359 | 32,499 | 55,614 |
| Loans and receivables | 33,387 | 36,976 | 42,418 | 49,818 | 54,589 | 54,107 | 78,452 | 102,019 | 124,311 | 137,523 |
| Investments in associate Companies | 225 | 241 | 1,179 | 1,210 | 1,393 | 1,724 | 1,763 | 1,797 | 33 | 77 |
| Property, plant and equipment | 1,658 | 1,162 | 691 | 804 | 781 | 806 | 918 | 1,504 | 1,541 | 1,473 |
| Investment property | – | 1,041 | 1,200 | 1,200 | 1,200 | 1,200 | 1,200 | 1,296 | 1,296 | 1,384 |
| Other assets | 2,446 | 3,007 | 1,277 | 661 | 925 | 1,074 | 691 | 962 | 1,154 | 2,608 |
| Goodwill | 1,535 | 873 | – | – | – | 4 | 4 | – | – | – |
| Total Assets | 58,985 | 65,295 | 64,977 | 76,143 | 83,280 | 99,286 | 108,635 | 142,588 | 174,103 | 206,817 |
| LIABILITIES | ||||||||||
| Borrowings | 26,881 | 27,799 | 29,204 | 34,147 | 34,993 | 29,561 | 28,631 | 38,973 | 36,630 | 47,344 |
| Deposits with customers | 11,085 | 13,954 | 21,161 | 25,624 | 31,091 | 49,948 | 60,533 | 82,094 | 107,394 | 129,423 |
| Non-life insurance reserves | 486 | 859 | – | – | – | – | – | – | – | – |
| Long-term insurance fund | 7,985 | 9,238 | – | – | – | – | – | – | – | – |
| Taxation | 300 | 220 | 640 | 522 | 352 | 560 | 633 | 397 | 713 | 625 |
| Other liabilities | 2,778 | 2,855 | 2,091 | 2,750 | 3,614 | 4,334 | 2,826 | 3,286 | 3,657 | 4,062 |
| Total Liabilities | 49,515 | 54,925 | 53,096 | 63,043 | 70,050 | 84,403 | 92,623 | 124,750 | 148,394 | 181,454 |
| SHAREHOLDERS’ FUNDS | ||||||||||
| Stated capital | 629 | 760 | 1,033 | 1,033 | 1,033 | 1,033 | 864 | 864 | 864 | 944 |
| Statutory reserves | 546 | 546 | 819 | 819 | 819 | 819 | 879 | 879 | 879 | 959 |
| Revaluation reserve | 86 | – | – | – | – | – | – | – | ||
| Share based payment reserve | – | – | – | – | – | – | – | – | – | 22 |
| Available-for-Sale reserve | – | – | – | – | – | – | – | – | – | 151 |
| Investment Fund Account | – | – | – | – | – | – | – | 387 | 924 | 1,707 |
| Retained earnings | 7,115 | 7,850 | 8,715 | 9,833 | 10,811 | 12,345 | 13,552 | 14,795 | 22,216 | 20,732 |
| Total equity to equity owners of the Bank |
8,377 | 9,155 | 10,567 | 11,685 | 12,662 | 14,197 | 15,295 | 16,925 | 24,883 | 24,515 |
| Non-controlling interest | 1,093 | 1,215 | 1,314 | 1,415 | 568 | 687 | 717 | 913 | 826 | 848 |
| Total equity | 9,470 | 10,370 | 11,881 | 13,100 | 13,230 | 14,884 | 16,012 | 17,838 | 25,709 | 25,363 |
| Total Liabilities and total equity | 58,985 | 65,295 | 64,977 | 76,143 | 83,280 | 99,286 | 108,635 | 142,588 | 174,103 | 206,817 |
| Share Information | ||||||||||
| Market price per share | 160.00 | 215.00 | 201.00 | 170.00 | 86.00 | 206.00 | 174.50 | 138.10 | 138.10 | 161.50 |
| Basic earnings per share | 6.50 | 11.20 | 12.40 | 9.30 | 9.80 | 12.75 | 12.81 | 15.79 | 55.31 | 16.48 |
| Interim dividends per share | – | – | – | – | – | – | 4.00 | 3.50 | 5.00 | 5.00 |
| Final dividends per share | 5.75 | 6.00 | 4.00 | 6.00 | 6.75 | 8.00 | 4.50 | 4.00 | 10.00 | 5.00 |
| Total dividends per share | 5.75 | 6.00 | 4.00 | 6.00 | 6.75 | 8.00 | 8.50 | 7.50 | 15.00 | 10.00 |
| Dividend cover (Times) | 2.28 | 3.21 | 6.20 | 3.72 | 3.27 | 3.77 | 2.19 | 2.05 | 3.69 | 1.60 |
| Price earnings ratio (Times) | 12.23 | 9.56 | 8.10 | 9.14 | 4.39 | 8.09 | 13.61 | 8.97 | 2.56 | 9.74 |
| Book value per share (LKR) | 77.92 | 79.80 | 64.54 | 71.38 | 77.35 | 86.72 | 93.15 | 103.07 | 151.54 | 148.85 |
11. Shareholder Enquiries and Communications
Secretary to the Board
National Development Bank PLC
No. 40, Navam Mawatha, Colombo 2
Tel: 2448 448, Ext: 3080, Fax: 2341050
e-mail: shehani.ranasinghe@ndbbank.com or
investor.relations@ndbbank.com
12. Compliance Report in Terms of Section 7.6 - Contents of the Annual Report in Terms of the Listing Rules of the Colombo Stock Exchange
Tabulated below is how we complied by the Contents of Annual Report as specified in Section 7.6 of the Listing Rules issued by the Colombo Stock Exchange. The table provides the disclosure requirements of Section 7.6, the compliance level of the Bank and where you will find the respective disclosures with this Annual Report.
| Rule No: | Disclosure requirement | Cross reference within the Report |
| 7.6 (i) | Names of persons, who during the financial year, were directors of the Entity | Board of Directors |
| 7.6 (ii) | Principal activities of the Entity and its subsidiaries during the year and any changes therein | Business Model, Notes to the Financial Statements |
| 7.6 (iii) | The names and the number of shares held by the 20 largest holders of voting shares and the percentage of such shares held | Investor Information |
| 7.6 (iv) | The Public Holding percentage | Investor Information |
| 7.6 (v) | A statement of each director’s holding and Chief Executive Officer’s holding in shares of the Entity at the beginning and end of the financial year |
Investor Information |
| 7.6 (vi) | Information pertaining to material foreseeable risk factors of the Entity | Risk Management |
| 7.6 (vii) | Details of material issues pertaining to employees and industrial relations of the Entity | Employee Capital and Social and Environmental Capital section under Management Discussion & Analysis |
| 7.6 (viii) | Extents, locations, valuations and the number of buildings of the Entity’s land holdings and investment properties |
Note 27 on Notes to the Financial Statements |
| 7.6 (ix) | Number of shares representing the Entity’s stated capital | Note 36.1 on Notes to the Financial Statements |
| 7.6 (x) | A distribution schedule of the number of holders in each class of equity securities, and the percentage of their total holdings |
Investor Information |
| 7.6 (xi) | Ratios and Market Price Information | Highlights of the year |
|
Highlights of the year | |
|
Highlights of the year | |
|
Investor Information | |
| 7.6 (xii) | Significant changes in the Entity’s or its subsidiaries’ fixed assets and the market value of land, if the value differs substantially from the book value | Note 25 to 27 on Notes to the Financial Statements |
| 7.6 (xiii) | Details of the funds raised either through a public issue, Rights Issue or private placement
|
Note 35 on Notes to the Financial Statements |
7.6 (xiv) |
|
Note 41 on Notes to the Financial Statements |
|
Not applicable | |
| 7.6 (xv) | Disclosures pertaining to Corporate Governance practices in terms of Rules 7.10.3, 7.10.5 c. and 7.10.6 c. of Section 7 of the Rules. | The Bank is exempt from Section 7.10 of the CSE Listing Rules thus not applicable. |
| 7.6 (xvi) | Related Party transactions exceeding 10% of the Equity or 5% of the total assets of the Entity as per Audited Financial Statements, whichever is lower | Note 50 on Notes to the Financial Statements |