| Net Interest Income |
6,812,107 |
5,596,965 |
22 |
|
7,011,578 |
5,818,928 |
20 |
| Total Operating Income |
15,864,917 |
8,815,216 |
80 |
|
11,549,041 |
14,939,091 |
(23) |
| Net Operating Income |
14,626,715 |
8,709,104 |
68 |
|
10,288,276 |
14,887,712 |
(31) |
| Operating Expenses |
4,944,203 |
4,102,193 |
21 |
|
5,563,875 |
4,496,839 |
24 |
| Profit before Value Added Tax on Financial Services |
9,682,512 |
4,606,911 |
110 |
|
4,724,401 |
10,390,873 |
(55) |
| Taxation |
1,959,276 |
1,682,953 |
16 |
|
2,061,393 |
1,897,654 |
9 |
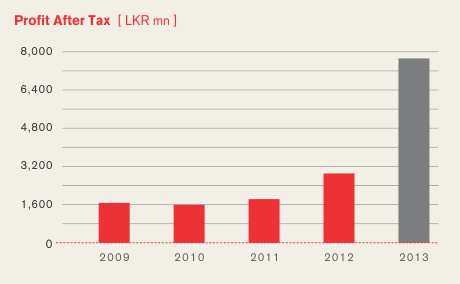
| Profit After Tax |
7,723,236 |
2,923,958 |
164 |
|
2,712,228 |
8,931,939 |
(70) |
| Profit Attributable to Shareholders |
7,723,236 |
2,923,958 |
164 |
|
2,641,925 |
8,853,821 |
(70) |
| Gross Dividends for the year |
1,646,930 |
2,463,029 |
(33) |
|
1,646,930 |
2,463,029 |
(33) |
| Revenue to Government |
1,764,828 |
1,644,953 |
7 |
|
1,871,262 |
1,859,654 |
1 |
|
|
|
|
|
|
|
|
| Assets and Liabilities (LKR '000) |
|
|
|
|
|
|
|
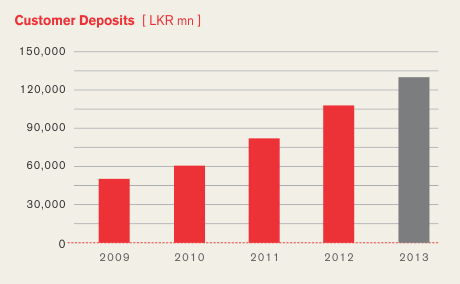
| Customer Deposits |
129,830,029 |
107,600,583 |
21 |
|
129,421,813 |
107,393,866 |
21 |
| Loans and Receivables |
141,650,632 |
120,098,824 |
18 |
|
141,710,813 |
120,145,500 |
18 |
| Investments |
52,242,395 |
29,412,686 |
78 |
|
55,690,627 |
37,913,588 |
47 |
| Total Assets |
201,258,628 |
163,474,296 |
23 |
|
206,817,121 |
174,103,071 |
19 |
| Borrowings |
46,556,578 |
34,932,507 |
33 |
|
46,526,578 |
34,892,582 |
33 |
| Total Liabilities |
181,638,150 |
148,531,895 |
22 |
|
181,455,467 |
148,393,619 |
22 |
| Retained Earnings |
15,653,260 |
12,046,256 |
30 |
|
20,731,801 |
22,216,054 |
(7) |
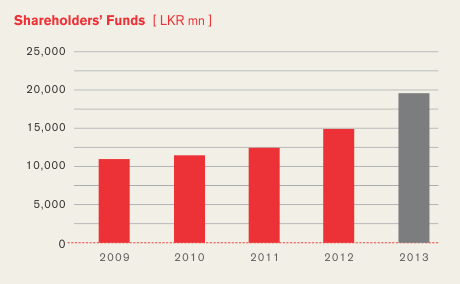
| Shareholders' Funds |
19,620,478 |
14,942,401 |
31 |
|
24,513,806 |
24,883,041 |
(1) |
|
|
|
|
|
|
|
|
| Profitability (%) |
|
|
|
|
|
|
|
| Net Interest Margin |
3.74 |
3.74 |
(0) |
|
3.68 |
3.72 |
(1) |
| Cost to Income Ratio |
31.16 |
46.54 |
(33) |
|
48.18 |
30.10 |
60 |
| Non-Performing Loans Ratio |
2.48 |
1.31 |
89 |
|
2.48 |
1.31 |
89 |
| Return on Assets |
4.24 |
1.94 |
118 |
|
1.39 |
5.59 |
(75) |
| Return on Equity |
44.69 |
21.17 |
111 |
|
10.70 |
42.35 |
(75) |
|
|
|
|
|
|
|
|
| Investor Information (LKR) |
|
|
|
|
|
|
|
| Net Asset Value per Share |
119.13 |
91.00 |
31 |
|
148.85 |
151.54 |
(2) |
| Market Value per Share - as at 31 December |
160.50 |
137.90 |
16 |
|
160.50 |
137.90 |
16 |
| Market Value per Share - Highest for the year |
182.50 |
155.00 |
18 |
|
182.50 |
155.00 |
18 |
| Market Value per Share - Lowest for the year |
138.00 |
96.00 |
44 |
|
138.00 |
96.00 |
44 |
| EPS - Basic |
46.96 |
17.81 |
164 |
|
16.48 |
55.31 |
(70) |
| EPS - Diluted |
46.95 |
17.80 |
164 |
|
16.47 |
55.29 |
(70) |
| PE Ratio (%) |
3.42 |
7.74 |
(56) |
|
9.74 |
2.49 |
291 |
| Dividend Per Share |
10.00 |
15.00 |
(33) |
|
– |
– |
– |
| Dividend Cover (Times) |
4.70 |
1.19 |
296 |
|
1.65 |
3.69 |
(55) |
| Market Capitalization (LKR '000) |
26,433,232 |
22,643,442 |
17 |
|
26,433,232 |
22,643,442 |
17 |
|
|
|
|
|
|
|
|
| Regulatory Ratios (%) |
|
|
|
|
|
|
|
| Capital Adequacy Ratio |
|
|
|
|
|
|
|
| Tier I - (Minimum Ratio of 5%) |
12.05 |
11.14 |
8 |
|
15.15 |
18.72 |
(19) |
| Tier I & II - (Minimum Ratio of 10%) |
17.87 |
12.38 |
44 |
|
21.04 |
20.66 |
2 |
| Statutory Liquid Asset Ratio |
|
|
|
|
|
|
|
| DBU |
26.22 |
22.02 |
19 |
|
26.22 |
22.02 |
19 |
| FCBU |
26.06 |
24.92 |
5 |
|
26.06 |
24.92 |
5 |
|
|
|
|
|
|
|
|
| Debt Ratios (Times) |
|
|
|
|
|
|
|
| Debt/Equity Ratio |
8.99 |
9.54 |
(6) |
|
7.18 |
5.87 |
26 |
| Total Leverage |
10.26 |
10.94 |
(6) |
|
8.44 |
7.00 |
21 |
| Interest Cover |
1.49 |
1.49 |
0 |
|
1.51 |
1.51 |
(0) |
| Interest Rate of Comparable Government Security |
10.63 |
12.02 |
(12) |
|
10.63 |
12.02 |
(12) |