Investor Relations Supplement
Dear Investor
The ‘Investor Relations’ supplement is presented to you in recognition of your continual support to the success of the Bank. We consider this as a strategic management responsibility to have an effective dialogue with investors. Furthermore, it enables us to provide timely, transparent, accurate and consistent information to the investing public.
Through shareholder engagement, we expect you to actively seek to influence the behavior of your Bank within your investment portfolio to improve the performance of factors such as environmental, social and governance. Another goal of this engagement is to create a productive dialog to address the risks related to above factors and thereby improve long term corporate performance.
The full report and accounts and the interim reports are available on the Bank’s website (http://www.combank.lk/newweb/investor-relations). Alternatively, shareholders are able to elect to receive a mailed copy of the Annual Report on request. The Company Secretary of the Bank responds to individual letters received from shareholders.
OUR STOCK
Commercial Bank stock is traded on the CSE under the ticker symbol ‘COMB’. The Bank’s shares are listed on the Main Board of the CSE. The daily share prices are found in newspapers including the Daily FT, Daily News, The Island and Daily Mirror.
Major Achievements In 2013
Only Sri Lankan Bank to feature for three consecutive years amongst world’s Top 1000 Banks |
|
 |
The Commercial Bank of Ceylon PLC has been ranked among the Top 1000 Banks of the World for a third successive year, becoming the only Sri Lankan bank to achieve this feat. The prestigious ranking published annually by ‘The Banker’ of the UK, has ranked Commercial Bank at No. 983 in 2013, with Tier I capital of US $ 355 Mn. at the end of 2012. The Top 1000 rankings are compiled from a database of over 5,000 banks worldwide and are widely recognised by the global financial community as the definitive guide to bank rankings and analysis. Making it to the Top 1000 list represents, in itself, a strong acknowledgment of the Bank’s standing, and staying in the rankings for three years consecutively speaks much of our consistent performance. A noteworthy feature of the 2013 ranking is the rise to the number one position of Industrial Commercial Bank of China (ICBC), displacing last year’s top ranked banks, Bank of America and JPMorgan Chase & Co, which have now taken third and second place respectively, and are followed by HSBC in fourth place. |
‘Best Bank In Sri Lanka’ title for the 15th consecutive year |
|
 |
The Commercial Bank of Ceylon has set yet another record, winning the ‘Best Bank in Sri Lanka’ title for the 15th consecutive year, in an annual ranking published by Global Finance magazine for the past 20 years. The magazine’s list of the 22 ‘Best Emerging Markets Banks in Asia,’ selected after an in-depth survey, is to be published in its May 2013 issue. Among those ranked alongside Commercial Bank in the worldwide Global Finance list are HSBC of Hong Kong, ANZ Group of Australia, Industrial and Commercial Bank of China, HDFC Bank in India, Deutsche of Germany, BNP Paribas of France, Barclays UK and Bank of America of USA as winners in their respective regions. Criteria for choosing the winners included growth in assets, profitability, strategic relationships, customer service, competitive pricing, and innovative products. Subjective criteria include the opinions of equity analysts, credit rating analysts, banking consultants and others involved in the industry. The mix of these factors selects leading banks that may not be the largest, the oldest or the most diversified in a given region, but rather the best- the banks with which companies around the world would most likely want to do business. |
‘Best Sri Lankan Trade Bank in 2013’ by Trade Finance |
|
 |
The Commercial Bank of Ceylon has been adjudged the ‘Best Trade Bank’ in Sri Lanka by Trade Finance magazine of the UK, following an independent poll of services provided by banks. The 2013 Award won by Commercial Bank is its fourth Best Trade Bank Award since Trade Finance began presenting such an award in 2009. According to Trade Finance, which is published by Euromoney PLC, London, there was a revamp of the country categories in this year’s Asia Pacific awards to reflect the heightened role that local and regional banks play in trade finance. Holding on to their Country Awards alongside Commercial Bank in 2013 were the Bank of China, Bank Mandiri (Indonesia), Kookmin Bank (South Korea), CIMB Bank Berhad (Malaysia), Vietcombank (Vietnam) and Habib Bank (Pakistan). |
Commercial Bank wins ‘Top 10’ Award at the 2013 Best Corporate Citizen Sustainability Awards |
|
 |
The Commercial Bank of Ceylon PLC won four awards including a ‘Top 10’ award at the 2013 Best Corporate Citizen Sustainability Awards presented by the Ceylon Chamber of Commerce to the country’s leading business entities. The Bank received the award for ‘Governance’ in the Category Awards, the award for ‘Education’ in the awards for Long Term Projects and a merit award for ‘Infrastructure’ and was adjudged one of Sri Lanka’s 10 best corporate citizens at this prestigious event. The Long Term Projects Award presented to Commercial Bank was in respect of its nationally significant initiative to present fully-equipped IT Labs to schools in all provinces of the country and a programme to help school children with better access to English language education. The Bank donated 52 IT Labs to 46 schools and six other institutions in the year 2013 and completed the second of its English language programme with a batch of 160 students. This is the second time the Bank’s education project was awarded Gold at this event. |
Commercial Bank dominates the 2013 Annual Reports Awards of the CA Sri Lanka |
|
 |
The Commercial Bank of Ceylon PLC dominated the 2013 Annual Report Awards of the Institute of Chartered Accountants of Sri Lanka (CA Sri Lanka), winning the topmost award for the Best Annual Report across all sectors and three category awards, reaffirming its superiority in the sphere of financial reporting and corporate disclosures. The 2012 Annual Report of Sri Lanka’s largest private bank received the Cyril Gardiner Memorial Trophy for Overall Excellence in Financial Reporting, the Edmund J. Cooray Memorial Trophy for the Best Annual Report among banking institutions, the Gold award for Management Commentary and the Silver award for Corporate Governance Disclosure at this prestigious event. Since 2001, Commercial Bank’s Annual Report has been adjudged the best in Sri Lanka seven times and the Bank has won the award for the best Annual Report in the banking sector nine times. |
A summary of ‘Awards and Accolades’ won by the Bank in the recent past.
Compliance Report on the Contents of Annual Report in Terms of the Listing Rules of the CSE
This year too we are pleased to inform you that your Bank has complied with all the requirements of the Section 7.6 of the Listing Rules of the CSE on the contents of the Annual Report and Accounts of a Listed Entity. The table below provides reference to the relevant sections of this Annual Report where specified information is found together with references for the convenience of the readers.
| Rule No. | Disclosure Requirement | Section/Reference |
| 7.6 (i) | Names of persons who held the position of Directors during the financial year | |
| 7.6 (ii) | Principal activities of the Bank and its Subsidiaries during the year and any changes therein |
|
| 7.6 (iii) | The names and the number of shares held by the 20 largest holders of voting and non-voting shares and the percentage of such shares held | |
| 7.6 (iv) | The public holding percentage | |
| 7.6 (v) | Directors’ and Chief Executive Officer’s holding in shares at the beginning and at the end of the financial year |
|
| 7.6 (vi) | Information pertaining to material foreseeable risk factors |
|
| 7.6 (vii) | Details of material issues pertaining to employees and industrial relations | |
| 7.6 (viii) | Extents, locations, valuations and the number of buildings of the land holdings and investment properties |
|
| 7.6 (ix) | Number of shares representing the Stated Capital |
|
| 7.6 (x) | A distribution schedule of the number of holders in each class of equity securities, and the percentage of their total holdings | |
| 7.6 (xi) | Ratios and market price information: | |
|
||
|
||
|
||
| 7.6 (xii) | Significant changes in the Bank or its Subsidiaries fixed assets and the market value of land, if the value differs substantially from the book value |
|
| 7.6 (xiii) | Details of funds raised through Public Issues, Rights Issues, and Private Placements during the year |
|
| 7.6 (xiv) | Information in respect of Employee Share Option Schemes |
|
|
|
|
|
| Rule No. | Disclosure Requirement | Section/Reference |
| 7.6 (xv) | Disclosures pertaining to Corporate Governance Practices in terms of Rules 7.10.3, 7.10.5 (c) and 7.10.6 (c) of Section 7 of the Listing Rules |
|
| 7.6 (xvi) | Disclosures on Related Party Transactions exceeding 10% of the Equity or 5% of the total assets of the Entity as per Audited Financial Statements, whichever is lower |
|
1. Quarterly Performance - 2013 Compared to 2012
Summary of the Income Statements
| 2013 | 2012 | |||||||||
| 1st Quarter Mar. 31 Rs. Mn. |
2nd Quarter Jun. 30 Rs. Mn. |
3rd Quarter Sept. 30 Rs. Mn. |
4th Quarter Dec. 31 Rs. Mn. |
Total Rs. Mn. |
1st Quarter Mar. 31 Rs. Mn. |
2nd Quarter Jun. 30 Rs. Mn. |
3rd Quarter Sept. 30 Rs. Mn. |
4th Quarter Dec. 31 Rs. Mn. |
Total Rs. Mn. |
|
| Group | ||||||||||
| Net interest income | 5,615.4 | 6,322.3 | 6,701.5 | 6,683.0 | 25,322.3 | 5,517.4 | 5,706.6 | 5,846.6 | 5,781.0 | 22,851.7 |
| Net fees and commission income | 909.0 | 1,012.9 | 1,225.2 | 1,105.7 | 4,252.8 | 851.8 | 844.3 | 894.9 | 1,007.2 | 3,598.3 |
| Other operating income (Net) | 1,244.0 | 1,096.1 | 1,399.9 | 2,303.8 | 6,043.8 | 2,516.7 | 1,901.7 | 726.1 | 1,419.4 | 6,563.9 |
| Less: Impairment charges for loans and other losses | 511.0 | 1,220.3 | 1,266.3 | 1,602.7 | 4,600.3 | 1,031.0 | 1,135.2 | 723.2 | 268.8 | 3,158.3 |
| Net operating income | 7,257.4 | 7,211.0 | 8,060.4 | 8,489.8 | 31,018.6 | 7,855.0 | 7,317.4 | 6,744.3 | 7,938.8 | 29,855.6 |
| Less: Expenses | 4,004.1 | 3,918.9 | 4,161.6 | 4,248.4 | 16,333.0 | 3,827.5 | 3,834.3 | 3,604.1 | 4,289.1 | 15,555.0 |
| Operating profit | 3,253.3 | 3,292.1 | 3,898.8 | 4,241.4 | 14,685.6 | 4,027.6 | 3,483.1 | 3,140.2 | 3,649.7 | 14,300.6 |
| Add: Share of profits/(losses) of associate companies | 1.8 | 1.1 | 2.0 | 2.1 | 7.1 | 9.3 | 1.9 | 1.8 | (0.6) | 12.4 |
| Profit before income tax | 3,255.2 | 3,292.2 | 3,900.9 | 4,243.5 | 14,692.8 | 4,036.9 | 3,485.0 | 3,142.0 | 3,649.1 | 14,312.9 |
| Less: Income tax expense | 998.4 | 1,060.0 | 1,144.3 | 916.6 | 4,119.3 | 1,225.6 | 1,133.8 | 877.9 | 994.5 | 4,231.7 |
| Profit for the period | 2,256.8 | 2,232.1 | 2,756.6 | 3,326.9 | 10,573.5 | 2,811.3 | 2,351.2 | 2,264.0 | 2,654.7 | 10,081.2 |
| Quarterly profit as a % of the profit after tax | 21.3 | 21.1 | 26.1 | 31.5 | 100.0 | 27.9 | 23.3 | 22.5 | 26.3 | 100.0 |
| Cumulative quarterly profit as a % of the profit after tax | 21.3 | 42.5 | 68.5 | 100.0 | 27.9 | 51.2 | 73.7 | 100.0 | ||
| Bank | ||||||||||
| Net interest income | 5,612.8 | 6,319.1 | 6,696.6 | 6,679.7 | 25,308.2 | 5,521.0 | 5,710.0 | 5,847.0 | 5,777.0 | 22,855.0 |
| Net fees and commission income | 908.2 | 1,012.3 | 1,224.2 | 1,104.6 | 4,249.3 | 851.9 | 844.4 | 894.9 | 1,006.9 | 3,598.0 |
| Other operating income (Net) | 1,224.4 | 1,101.0 | 1,408.3 | 2,362.4 | 6,096.1 | 2,503.6 | 1,896.9 | 726.3 | 1,436.3 | 6,563.1 |
| Less: Impairment charges for loans and other losses | 516.9 | 1,226.7 | 1,275.1 | 1,608.6 | 4,627.3 | 1,031.0 | 1,135.2 | 723.2 | 307.3 | 3,196.8 |
| Net operating income | 7,228.5 | 7,205.7 | 8,054.0 | 8,538.1 | 31,026.3 | 7,845.5 | 7,316.0 | 6,744.9 | 7,912.8 | 29,819.3 |
| Less: Expenses | 3,998.6 | 3,927.8 | 4,157.7 | 4,431.7 | 16,515.7 | 3,819.6 | 3,834.8 | 3,592.3 | 4,277.3 | 15,524.0 |
| Profit before income tax | 3,229.9 | 3,277.9 | 3,896.3 | 4,106.4 | 14,510.5 | 4,025.9 | 3,481.3 | 3,152.6 | 3,635.5 | 14,295.3 |
| Less: Income tax expense | 989.0 | 1,047.1 | 1,134.0 | 894.9 | 4,065.0 | 1,221.6 | 1,112.8 | 869.5 | 993.1 | 4,197.0 |
| Profit for the period | 2,240.9 | 2,230.8 | 2,762.3 | 3,211.5 | 10,445.5 | 2,804.3 | 2,368.4 | 2,283.1 | 2,642.4 | 10,098.3 |
| Quarterly profit as a % of the profit after tax | 21.2 | 21.1 | 26.7 | 31.0 | 100.0 | 27.7 | 23.5 | 22.6 | 26.2 | 100.0 |
| Cumulative quarterly profit as a % of the profit after tax | 21.2 | 42.3 | 69.0 | 100.0 | 27.7 | 51.3 | 74.0 | 100.0 | ||
Summary of the Statement of Financial Position
| 2013 | 2012 | |||||||
| As at Mar. 31 Rs. Mn. |
As at Jun. 30 Rs. Mn. |
As at Sept. 30 Rs. Mn. |
As at Dec. 31 Rs. Mn. |
As at Mar. 31 Rs. Mn. |
As at Jun. 30 Rs. Mn. |
As at Sept. 30 Rs. Mn. |
As at Dec. 31 Rs. Mn. |
|
| Group | ||||||||
| Cash and cash equivalents | 17,320.3 | 17,242.3 | 12,441.8 | 14,263.3 | 18,778.4 | 15,304.3 | 14,600.6 | 19,752.2 |
| Placements with banks | 18,392.4 | 1,657.1 | 4,949.3 | 4,131.8 | 8,930.8 | 13,640.8 | 17,421.8 | 16,163.0 |
| Other financial assets held for trading | 9,822.8 | 10,474.9 | 10,000.5 | 6,379.1 | 6,257.1 | 5,184.5 | 7,154.5 | 6,041.1 |
| Loans and receivables to Banks & other customers | 389,317.2 | 390,085.5 | 400,159.1 | 419,490.5 | 344,186.5 | 352,105.1 | 360,323.6 | 373,486.1 |
| Financial investments - Available-for-sale | 59,246.9 | 96,484.7 | 122,607.3 | 123,748.3 | 59,143.7 | 63,218.8 | 58,232.2 | 57,963.2 |
| Other assets | 43,138.1 | 42,618.8 | 41,752.7 | 39,179.4 | 37,771.7 | 39,825.9 | 40,792.5 | 38,815.1 |
| 537,237.6 | 558,563.3 | 591,910.7 | 607,192.3 | 475,068.3 | 489,279.4 | 498,525.2 | 512,220.6 | |
| Due to Banks | 3,698.4 | 12,254.3 | 13,474.0 | 14,194.2 | 14,353.8 | 7,942.9 | 4,045.0 | 4,893.9 |
| Due to other customers | 405,173.1 | 417,223.9 | 435,394.0 | 451,098.9 | 356,937.2 | 366,876.2 | 378,814.4 | 390,568.7 |
| Other borrowings | 46,797.1 | 47,958.5 | 54,684.5 | 53,997.5 | 42,166.3 | 53,509.6 | 50,258.5 | 47,435.6 |
| Subordinated liabilities | 10,512.1 | 10,934.5 | 11,250.1 | 11,056.8 | 1,006.2 | 1,039.3 | 1,072.6 | 1,106.0 |
| Other liabilities | 18,062.0 | 14,587.3 | 18,817.6 | 15,359.8 | 14,913.8 | 11,873.7 | 13,518.0 | 15,215.9 |
| Shareholders’ funds | 52,994.9 | 55,604.8 | 58,290.5 | 61,485.0 | 45,690.9 | 48,037.7 | 50,816.6 | 53,000.6 |
| 537,237.6 | 558,563.3 | 591,910.7 | 607,192.3 | 475,068.3 | 489,279.4 | 498,525.2 | 512,220.6 | |
| Bank | ||||||||
| Cash and cash equivalents | 17,345.6 | 17,231.6 | 12,434.9 | 14,261.5 | 18,756.6 | 15,288.1 | 14,619.5 | 19,732.8 |
| Placements with Banks | 18,392.4 | 1,657.1 | 4,949.3 | 4,131.8 | 8,930.8 | 13,640.8 | 17,421.8 | 16,163.0 |
| Other financial assets held for trading | 9,822.8 | 10,474.9 | 10,000.5 | 6,379.1 | 6,257.1 | 5,184.5 | 7,154.5 | 6,041.1 |
| Loans and receivables to Banks & other customers | 389,450.7 | 390,119.4 | 400,182.9 | 419,505.9 | 344,321.6 | 352,191.5 | 360,393.5 | 373,543.8 |
| Financial investments - Available-for-sale | 59,246.9 | 96,484.7 | 122,607.3 | 123,748.3 | 59,143.7 | 63,218.8 | 58,232.1 | 57,963.2 |
| Other assets | 42,627.0 | 42,143.8 | 41,314.9 | 38,580.5 | 37,348.7 | 39,480.3 | 40,437.5 | 38,298.8 |
| 536,885.3 | 558,111.5 | 591,489.7 | 606,607.1 | 474,758.5 | 489,004.1 | 498,259.0 | 511,742.7 | |
Due to Banks |
3,698.4 | 12,254.3 | 13,474.0 | 14,194.2 | 14,353.8 | 7,942.9 | 4,045.0 | 4,893.9 |
| Due to other customers | 405,246.7 | 417,282.8 | 435,469.3 | 451,152.9 | 357,048.3 | 366,958.1 | 378,851.0 | 390,611.5 |
| Other borrowings | 46,947.7 | 48,111.8 | 54,867.2 | 54,173.2 | 42,277.1 | 53,569.2 | 50,426.8 | 47,582.9 |
| Subordinated liabilities | 10,512.1 | 10,934.5 | 11,250.1 | 11,056.8 | 1,006.2 | 1,039.3 | 1,072.6 | 1,106.0 |
| Other liabilities | 17,922.0 | 14,371.9 | 18,581.2 | 15,085.9 | 14,809.1 | 11,751.9 | 13,352.7 | 14,971.4 |
| Shareholders’ funds | 52,558.4 | 55,156.2 | 57,848.0 | 60,944.0 | 45,264.0 | 47,742.8 | 50,511.0 | 52,577.0 |
| 536,885.3 | 558,111.5 | 591,489.7 | 606,607.1 | 474,758.5 | 489,004.1 | 498,259.0 | 511,742.7 | |
2. Stock Exchange Listing
The following securities of the Bank are listed on the Main Board of the CSE:
| Shares | Ordinary Shares Voting | |
| Ordinary Shares Non-Voting | ||
| Debentures | Fixed Rate | December 2006/16 |
| Floating Rate | December 2006/16 |
The Unaudited Interim Financial Statements for the first three quarters of 2013 were submitted to the CSE within 45 days from the respective quarter ends as required by the Rule No. 7.4 (a) (j) of the Listing Rules of the CSE. (The Bank duly complied with this requirement for 2012.)
The Unaudited Interim Financial Statements for the fourth quarter of 2013 was submitted to the CSE on February 25, 2014, as required by the Rule No. 7.4 (a) (j) of the Listing Rules of the CSE. (The Bank duly complied with this requirement for 2012.)
The Audited Income Statement for the year ended December 31, 2013 and the Audited Statement of Financial Position as at December 31, 2013 will be submitted to the CSE within three months from the year-end, which is well within the required deadline as required by the Rule No. 7.5 (a) of the Listing Rules of the CSE. (The Bank duly complied with this requirement for 2012.)
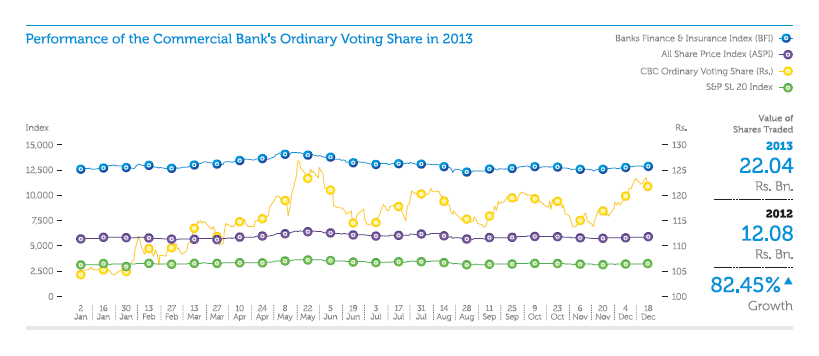
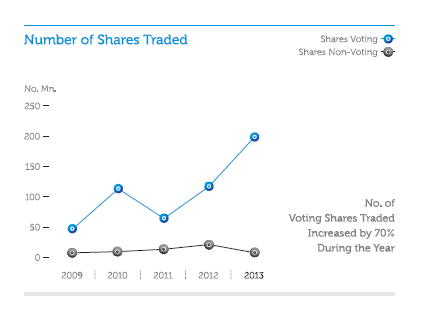
3. Information on Share Trading
| Ordinary Shares Voting | Ordinary Shares Non-Voting | |||
| 2013 | 2012 | 2013 | 2012 | |
Number of transactions |
18,733 | 17,214 | 5,341 | 9,137 |
| Number of shares traded | 198,501,282 | 117,120,816 | 6,769,927 | 21,436,592 |
| Value of Shares traded (Rs. Bn.) | 22.04 | 12.08 | 0.63 | 1.78 |

4. The Names, Number and Percentage of Shares held by Twenty Largest Shareholders [As Per Rule No. 7.6 (III) of the Listing Rules of the CSE]
| As at December 31, | 2013 | 2012* | |||
| Ordinary Shares Voting | No. of Shareholders |
% | No. of Shareholders |
% | |
1. |
DFCC Bank A/C 1 | 117,951,857 | 14.85 | 116,009,375 | 14.87 |
| 2. | Employees Provident Fund | 77,586,335 | 9.76 | 74,641,168 | 9.57 |
| 3. | HSBC International Nominees Ltd. - JPMLU - Franklin Templeton Investment Funds | 57,224,769 | 7.20 | 7,584,878 | 0.97 |
| 4. | Sri Lanka Insurance Corporation Ltd. - Life Fund | 40,219,594 | 5.06 | 39,557,241 | 5.07 |
| 5. | CB NY S/A International Finance Corporation | 39,756,210 | 5.00 | 47,476,548 | 6.09 |
| 6. | Mr. Y.S.H.I. Silva | 36,000,446 | 4.53 | 17,876,644 | 2.29 |
| 7. | Sri Lanka Insurance Corporation Ltd. - General Fund | 34,583,318 | 4.35 | 34,013,785 | 4.36 |
| 8. | HSBC International Nominees Ltd. - BPSS - LUX - Aberdeen Global - Emerging Markets Smaller Companies Fund | 18,546,949 | 2.34 | 15,827,650 | 2.03 |
| 9. | HSBC International Nominees Ltd. - BPSS - LUX - Aberdeen Global - Asian Smaller Companies Fund | 17,786,191 | 2.24 | 17,493,281 | 2.24 |
| 10. | Distilleries Company of Sri Lanka PLC | 17,348,809 | 2.18 | 17,063,102 | 2.19 |
| 11. | HSBC International Nominees Ltd. - SSBT- Wasatch Frontier - Emerging Small Countries Fund | 15,136,477 | 1.91 | 1,865,100 | 0.25 |
| 12. | Mrs. L.E.M. Yaseen | 11,675,901 | 1.47 | 10,257,456 | 1.32 |
| 13. | HSBC International Nominees Ltd. - BPSS - LUX - Aberdeen Global Asia Pacific Equity Fund | 10,736,297 | 1.35 | 10,559,487 | 1.35 |
| 14. | Mercantile Investments and Finance PLC | 10,244,517 | 1.29 | 10,075,806 | 1.29 |
| 15. | The Bank of New York Mellon SA/NV - CF Ruffer Total Return Fund | 8,071,609 | 1.02 | 7,938,683 | 1.02 |
| 16. | HSBC International Nominees Ltd. - SSBT - Morgan Stanley Asset Management SA Acting on behalf of Morgan Stanley Galaxy Fund | 7,398,991 | 0.93 | 7,729,057 | 0.99 |
| 17. | HSBC International Nominees Ltd. - SSBT - Aberdeen Institutional Commingled Funds, LLC | 6,960,323 | 0.88 | 12,560,004 | 1.62 |
| 18. | Northern Trust Co. S/A Harding Loevner Frontier Emerging Markets Portfolio | 6,850,000 | 0.86 | 1,666,000 | 0.21 |
| 19. | HSBC International Nominees Ltd. - BP2S London - Aberdeen Asia Smaller Companies Investment Trust | 6,672,683 | 0.84 | 6,562,795 | 0.84 |
| 20. | The Bank of New York Mellon SA/NV - CF Ruffer Absolute Return Fund | 6,089,109 | 0.77 | 5,988,831 | 0.77 |
| Sub total | 546,840,385 | 68.83 | 462,746,891 | 59.33 | |
| Other shareholders | 247,695,434 | 31.17 | 317,267,341 | 40.67 | |
| Total | 794,535,819 | 100.00 | 780,014,232 | 100.00 | |
As per Rule No. 7.6 (iv) of the Listing Rules of the CSE, percentage of public holding of voting shares as at December 31, 2013 was 85.01% (84.99% as at December 31, 2012).
*Comparative shareholdings as at December 31, 2012 of the twenty largest shareholders as at December 31, 2013.
| As at December 31, | 2013 | 2012* | |||
| Ordinary Shares Non-Voting | No. of Shareholders |
% | No. of Shareholders |
% | |
1. |
HSBC International Nominees Ltd. - JPMLU - Franklin Templeton Investment Funds | 3,286,705 | 6.03 | 3,222,260 | 6.03 |
| 2. | Citi Bank NY S/A Forward International Dividend Fund | 1,800,733 | 3.30 | 1,250,000 | 2.34 |
| 3. | GF Capital Global Ltd. | 1,516,962 | 2.78 | 1,413,199 | 2.64 |
| 4. | HINL - JPMCB - Butterfield Trust (Bermuda) Ltd. | 1,353,360 | 2.48 | 1,326,824 | 2.48 |
| 5. | Northern Trust Company S/A The Ashmoreemm Umbrella Fund Trust | 1,303,338 | 2.39 | – | – |
| 6. | Mr. J.D. Bandaranayake | 1,077,799 | 1.98 | 1,054,215 | 1.97 |
| 7. | Waldock Mackenzie Ltd. / Mr. S.N.P. Palihena and Mrs. A.S. Palihena | 1,000,000 | 1.83 | 1,000,000 | 1.87 |
| 8. | M.J.F. Exports Ltd. | 933,060 | 1.71 | 914,765 | 1.71 |
| 9. | Mas Capital (Pvt) Ltd. | 801,620 | 1.47 | 785,902 | 1.47 |
| 10. | Northern Trust Company S/A Polar Capital Funds PLC | 778,280 | 1.43 | 715,676 | 1.34 |
| 11. | Mr. M.F. Hashim | 689,800 | 1.26 | 653,749 | 1.22 |
| 12. | Saboor Chatoor (Pvt) Ltd. | 687,000 | 1.26 | 620,000 | 1.16 |
| 13. | Mr. M.A. Yaseen | 625,016 | 1.15 | 612,761 | 1.15 |
| 14. | Citi Bank NY S/A Forward Select EM Dividend Fund | 618,000 | 1.13 | 900,000 | 1.68 |
| 15. | Asian Alliance Insurance PLC - A/C 02 - Life Fund | 495,072 | 0.91 | 485,365 | 0.91 |
| 16. | Akbar Brothers (Pvt) Ltd. A/C 1 | 487,940 | 0.89 | 448,628 | 0.84 |
| 17. | Dr. A.K.A. Jayawardene | 481,472 | 0.88 | 472,032 | 0.88 |
| 18. | Mrs. L.V.C. Samarasinha | 457,144 | 0.84 | 395,233 | 0.74 |
| 19. | Mr. G.R. Mallawaaratchy / Mrs. B.G.P. Mallawaaratchy | 433,880 | 0.80 | 425,373 | 0.80 |
| 20. | Mr. W.R.H. Perera | 430,961 | 0.79 | 335,425 | 0.63 |
| Sub total | 19,258,142 | 35.31 | 17,031,407 | 31.85 | |
| Other shareholders | 35,285,080 | 64.69 | 36,442,341 | 68.15 | |
| Total | 54,543,222 | 100.00 | 53,473,748 | 100.00 | |
As per Rule No. 7.6 (iv) of the Listing Rules of the CSE, percentage of public holding of non-voting shares as at December 31, 2013 was 99.94% (99.96% as at December 31, 2012).
*Comparative shareholdings as at December 31, 2012 of the twenty largest shareholders as at December 31, 2013.
5. Directors’ Shareholding Including the Chief Executive Officer’s Shareholding [As Per Rule No. 7.6 (V) of the Listing Rules of the CSE]
| Ordinary Shares - Voting | Ordinary Shares - Non-Voting | |||
| As at December 31, | 2013 | 2012 | 2013 | 2012 |
Mr. D.S. Weerakkody - Chairman |
26,452 | 26,017 | 12,220 | 11,981 |
| Mr. K.G.D.D. Dheerasinghe - Deputy Chairman | 20,334 | 20,000 | Nil | Nil |
| Mr. W.M.R.S. Dias - CEO/MD | 696,594 | 685,123 | Nil | Nil |
| Prof. U.P. Liyanage | Nil | Nil | Nil | Nil |
| Mr. L. Hulugalle | Nil | Nil | Nil | Nil |
| Mr. M.P. Jayawardena | Nil | Nil | Nil | Nil |
| Mr. S. Swarnajothi | Nil | Nil | 8,332 | 8,169 |
| Mr. J. Durairatnam | 344,336 | 309,782 | Nil | Nil |
6. Material Foreseeable Risk Factors [As Per Rule No. 7.6 (VI) of the Listing Rules of The CSE]
Information pertaining to the material foreseeable risk factors, that require disclosures as per the Rule No. 7.6 (vi) of the Listing Rules of the CSE are discussed in the section on ‘Managing Risk at Commercial Bank’.
7. Material Issues Pertaining to Employees and Industrial Relations Pertaining to the Bank [As Per Rule No. 7.6 (VII) of the Listing Rules of the CSE]
There were no material issues pertaining to employees and industrial relations pertaining to the Bank that occurred during the year under review which needs to be disclosed.
8. Information on Movement in Number of Shares Represented by the Stated Capital [As Per Rule No. 7.6 (IX) of the Listing Rules of the CSE]
| No. of Shares | |||||||
| Year | Details | Basis | No. of Shares Issued/ (Redeemed) |
Ordinary Shares Voting |
Ordinary Shares Non-Voting |
Cumulative Redeemable Preference Shares |
|
| 1987 | As at December 31, 1987 | 3,000,000 | – | – | |||
| 1988 | Bonus Issue | Voting | 2 for 3 | 2,000,000 | 5,000,000 | – | – |
| 1990 | Bonus Issue | Voting | 1 for 1 | 5,000,000 | 10,000,000 | – | – |
| 1993 | Rights Issue | Voting | 1 for 4 | 2,500,000 | 12,500,000 | – | – |
| 1996 | Bonus Issue | Voting | 3 for 5 | 7,500,000 | 20,000,000 | – | – |
| Rights Issue | Voting | 1 for 4 | 5,000,000 | 25,000,000 | – | – | |
| Share Swap | Non-Voting | 894,275 | 25,000,000 | 894,275 | – | ||
| Bonus Issue | Non-Voting | 3 for 5 | 536,565 | 25,000,000 | 1,430,840 | – | |
| Rights Issue | Non-Voting | 1 for 4 | 357,710 | 25,000,000 | 1,788,550 | – | |
| 1998 | Bonus Issue | Voting | 3 for 10 | 7,500,000 | 32,500,000 | 1,788,550 | – |
| Bonus Issue | Non-Voting | 3 for 10 | 536,565 | 32,500,000 | 2,325,115 | – | |
| 2001 | Bonus Issue | Voting | 1 for 5 | 6,500,000 | 39,000,000 | 2,325,115 | – |
| Bonus Issue | Non-Voting | 1 for 5 | 465,023 | 39,000,000 | 2,790,138 | – | |
| Issue of Cumulative Redeemable Preference Shares | 90,655,500 | 39,000,000 | 2,790,138 | 90,655,500 | |||
| 2003 | Bonus Issue | Voting | 1 for 3 | 13,000,000 | 52,000,000 | 2,790,138 | 90,655,500 |
| Rights Issue | Voting | 1 for 4 | 13,000,000 | 65,000,000 | 2,790,138 | 90,655,500 | |
| Bonus Issue | Non-Voting | 1 for 3 | 930,046 | 65,000,000 | 3,720,184 | 90,655,500 | |
| Rights Issue | Non-Voting | 1 for 4 | 930,046 | 65,000,000 | 4,650,230 | 90,655,500 | |
| Issue of Cumulative Redeemable Preference Shares | 100,000,000 | 65,000,000 | 4,650,230 | 190,655,500 | |||
| 2004 | ESOP | Voting | 29,769 | 65,029,769 | 4,650,230 | 190,655,500 | |
| 2005 | ESOP | Voting | 1,361,591 | 66,391,360 | 4,650,230 | 190,655,500 | |
| Bonus Issue | Voting | 1 for 1 | 66,389,162 | 132,780,522 | 4,650,230 | 190,655,500 | |
| Bonus Issue | Non-Voting | 1 for 1 | 4,650,230 | 132,780,522 | 9,300,460 | 190,655,500 | |
| 2006 | ESOP | Voting | 737,742 | 133,518,264 | 9,300,460 | 190,655,500 | |
| Redemption of Cumulative Redeemable Preference Shares | (90,655,500) | 133,518,264 | 9,300,460 | 100,000,000 | |||
| 2007 | Rights Issue | Voting | 3 for 10 | 40,288,996 | 173,807,260 | 9,300,460 | 100,000,000 |
| Bonus Issue | Voting | 1 for 3 | 58,204,268 | 232,011,528 | 9,300,460 | 100,000,000 | |
| ESOP | Voting | 919,649 | 232,931,177 | 9,300,460 | 100,000,000 | ||
| Rights Issue | Non-Voting | 3 for 10 | 2,790,138 | 232,931,177 | 12,090,598 | 100,000,000 | |
| Bonus Issue | Non-Voting | 1 for 3 | 4,030,199 | 232,931,177 | 16,120,797 | 100,000,000 | |
| 2008 | Redemption of Cumulative Redeemable Preference Shares | (100,000,000) | 232,931,177 | 16,120,797 | – | ||
| ESOP | Voting | 350,049 | 233,281,226 | 16,120,797 | – | ||
| 2009 | ESOP | Voting | 540,045 | 233,821,271 | 16,120,797 | – | |
| 2010 | Share Split | Voting | 1 for 2 | 117,402,608 | 351,223,879 | 16,120,797 | – |
| Share Split | Non-Voting | 1 for 2 | 8,060,398 | 351,223,879 | 24,181,195 | – | |
| ESOP | Voting | 2,081,508 | 353,305,387 | 24,181,195 | – | ||
| 2011 | Scrip Issue for final dividend 2010 | Voting | 2,277,195 | 355,582,582 | 24,181,195 | – | |
| Scrip Issue for final dividend 2010 | Non-Voting | 255,734 | 355,582,582 | 24,436,929 | – | ||
| ESOP | Voting | 1,457,645 | 357,040,227 | 24,436,929 | – | ||
| Rights Issue | Voting | 1 for 14 | 25,502,433 | 382,542,660 | 24,436,929 | – | |
| Rights Issue | Non-Voting | 1 for 14 | 1,745,494 | 382,542,660 | 26,182,423 | – | |
| Share Split | Voting | 1 for 1 | 382,542,660 | 765,085,320 | 26,182,423 | – | |
| Share Split | Non-Voting | 1 for 1 | 26,182,423 | 765,085,320 | 52,364,846 | – | |
| 2012 | Scrip Issue for final dividend 2011 | Voting | 13,587,144 | 778,672,464 | 52,364,846 | – | |
| Scrip Issue for final dividend 2011 | Non-Voting | 1,108,902 | 778,672,464 | 53,473,748 | – | ||
| ESOP | Voting | 1,341,768 | 780,014,232 | 53,473,748 | – | ||
| 2013 | Scrip issue for final dividend 2012 | Voting | 13,076,189 | 793,090,421 | 53,473,748 | – | |
| Scrip issue for final dividend 2012 | Non-Voting | 1,069,474 | 793,090,421 | 54,543,222 | – | ||
| ESOP | Voting | 1,445,398 | 794,535,819 | 54,543,222 | – | ||
9. Distribution Schedule of the Number of Holders and Percentage of Holding in Each Class of Equity Securities [As Per Rule No. 7.6 (X) of the Listing Rules of the CSE]
| As at December 31, 2013 | As at December 31, 2012 | ||||||||
| No. of Shareholders |
% | No. of Shares | % | No. of Shareholders |
% | No. of Shares | % | ||
| Ordinary Shares Voting | |||||||||
| 1 - | 1,000 | 4,257 | 46.83 | 1,070,676 | 0.13 | 4,244 | 44.63 | 1,134,312 | 0.15 |
| 1,001 - | 10,000 | 3,028 | 33.31 | 11,127,681 | 1.40 | 3,335 | 35.07 | 12,108,082 | 1.55 |
| 10,001 - | 100,000 | 1,503 | 16.53 | 43,110,082 | 5.43 | 1,619 | 17.03 | 46,674,954 | 5.98 |
| 100,001 - | 1,000,000 | 229 | 2.52 | 63,934,905 | 8.05 | 242 | 2.54 | 65,737,603 | 8.43 |
| Over | 1,000,000 | 74 | 0.81 | 675,292,475 | 84.99 | 69 | 0.73 | 654,359,281 | 83.89 |
| Total | 9,091 | 100.00 | 794,535,819 | 100.00 | 9,509 | 100.00 | 780,014,232 | 100.00 | |
| Ordinary Shares Non-Voting | |||||||||
| 1 - | 1,000 | 2,274 | 52.44 | 604,911 | 1.11 | 2,268 | 52.15 | 614,606 | 1.15 |
| 1,001 - | 10,000 | 1,424 | 32.84 | 4,798,522 | 8.79 | 1,455 | 33.46 | 4,912,907 | 9.19 |
| 10,001 - | 100,000 | 534 | 12.32 | 14,655,746 | 26.87 | 530 | 12.19 | 14,785,750 | 27.65 |
| 100,001 - | 1,000,000 | 98 | 2.26 | 24,145,146 | 44.27 | 90 | 2.07 | 23,616,204 | 44.16 |
| Over | 1,000,000 | 6 | 0.14 | 10,338,897 | 18.96 | 6 | 0.13 | 9,544,281 | 17.85 |
| Total | 4,336 | 100.00 | 54,543,222 | 100.00 | 4,349 | 100.00 | 53,473,748 | 100.00 | |
10. Information on Ratios, Market Prices of Shares and Credit Ratings [As Per Rule No. 7.6 (XI) of the CSE]
(a) Information on Ratios
| 2013 | 2012 | |||
Dividend per Share (Rs.) |
Cash | First Interim Paid | 1.50 | 1.50 |
| Second Interim Paid | 1.00 | 1.00 | ||
| Final Proposed*/Paid | 2.00 | 2.00 | ||
| Total | 4.50 | 4.50 | ||
| Issue and Allotment of Shares | Final Proposed*/allotted | 2.00 | 2.00 | |
| Total Dividend | 6.50 | 6.50 | ||
| Dividend Payout Ratio (%) | Cash | 36.58 | 37.16 | |
| Total | 52.84 | 53.69 | ||
| Net Assets Value per Share (Rs.) | 71.78 | 63.08 |
* The Board of Directors of the Bank has recommended a final dividend of Rs. 4.00 per ordinary share, which consists of a cash dividend of Rs. 2.00 per share and the balance entitlement of Rs. 2.00 per share satisfied in the form of issue and allotment of new shares for both voting and non-voting shareholders of the Bank for the year ended December 31, 2013 for approval by the shareholders at the 45th Annual General Meeting (AGM), to be held on March 31, 2014. (The Bank declared a final dividend of Rs. 4.00 per share for the year ended December 31, 2012 which consists of a cash dividend of Rs. 2.00 per share and balance entitlement of Rs. 2.00 per share satisfied in the form of issue and allotment of new shares.)
(b) Market Prices
| Ordinary Shares Voting | Ordinary Shares Non-Voting | |||
| 2013 | 2012 | 2013 | 2012 | |
| Rs. | Rs. | Rs. | Rs. | |
Highest price |
126.00 | 119.50 | 102.00 | 99.50 |
| Date of the highest price | (21.05.2013) | (17.09.2012) | (21.05.2013) | (17.09.2012) |
| Lowest price | 103.20 | 96.80 | 87.00 | 73.00 |
| Date of the lowest price | (02.01.2013) | (25.07.2012) | (04.12.2013) | (06.07.2012) |
| Year-end price | 120.40 | 103.00 | 93.00 | 91.10 |
(c) Debenture Composition
| Fixed Interest Rate | Floating Interest Rate | |||||||
| 2013 | 2012 | 2013 | 2012 | |||||
Type of issue |
Private | Public | Private | Public | Public | Public | Public | Public |
| Debenture type | - N/A - | Type ‘A’ | - N/A - | Type ‘A’ | Type ‘B’ | Type ‘D’ | Type ‘D’ | Type ‘E’ |
| CSE listing | Not listed | Listed | Not listed | Listed | Listed | Listed | Listed | Listed |
| Issue date | May 2006 | Dec. 2006 | May 2006 | Dec. 2006 | Dec. 2006 | Dec. 2006 | Dec. 2006 | Dec. 2006 |
| Maturity date | May 2016 | Dec. 2016 | May 2016 | Dec. 2016 | Dec. 2013 | Dec. 2016 | Dec. 2016 | Dec. 2013 |
| Interest payable frequency | Annually | Annually | Annually | Annually | Annually | Annually | Annually | Annually |
| Offered interest rate | 13.25% p.a. | 14.00% p.a. | 13.25% p.a. | 14.00% p.a. | 13.75% p.a. | 12 Months
TB Rate (Gross) + 1% p.a. |
12 Months
TB Rate (Gross) + 1% p.a. |
12 Months
TB Rate (Gross) + 1% p.a. |
| Amount (Rs. Mn.) | 505.000 | 467.260 | 505.000 | 467.260 | 0.250 | 0.400 | 0.400 | 0.300 |
| Market values | ||||||||
| - Highest (Rs.) | - N/A - | Not traded during the year |
- N/A - | Not traded during the year |
Not traded during the year |
Not traded during the year |
Not traded during the year |
Not traded during the year |
| - Lowest (Rs.) | - N/A - | - N/A - | ||||||
| - Year-end (Rs.) | - N/A - | - N/A - | ||||||
| Interest rates | ||||||||
| - Coupon rate (%) | 13.25 | 14.00 | 13.25 | 14.00 | 13.75 | 13.99 | 11.34 | 11.34 |
| - Effective annual yield (%) | 13.25 | 14.00 | 13.25 | 14.00 | 13.75 | 13.99 | 11.66 | 11.66 |
| Interest rate of comparable government security |
8.85 | 9.10 | 11.70 | 11.50 | 11.40 | 10.20 | 13.65 | 13.65 |
| Other ratios as at date of last trade | ||||||||
| - Interest yield (%) | - N/A - | Not traded |
- N/A - | Not traded |
Not traded |
Not traded |
Not traded |
Not traded |
| - Yield to maturity (%) | - N/A - | - N/A - | ||||||
Twelve Months TB Rate (Gross) - Twelve months Treasury Bill rate before 10% withholding tax rate as published by the Central Bank of Sri Lanka immediately prior to the commencement of each interest period.
(d) Other Ratios
| 2013 | 2012 | |
Debt equity ratio (%) |
33.17 | 18.25 |
| Interest cover (Times) | 20.25 | 48.61 |
| Liquid assets ratio (%) (Minimum 20%) | 34.05 | 25.79 |
(e) Credit Ratings
- The Bank’s credit rating, AA(lka) was reaffirmed by Fitch Ratings Lanka Ltd. in 2013.
- The Bank’s credit rating, AA+ was reaffirmed by RAM Ratings (Lanka) Ltd. in 2013.
- The Bank’s Bangladesh Operation’s credit rating was reaffirmed as AAA by Credit Rating Information Services Ltd. in 2013.
(f) Credit Ratings - Debentures
- The credit rating of the Bank’s subordinated debentures, AA- (lka) too reaffirmed in 2013 by Fitch Ratings Lanka Ltd.
11. Information on Scrip Issues, Rights Issues and Share Splits
| Year/Month | Details |
2013 April |
Issue of ordinary shares to satisfy a part of the final dividend for 2012 of Rs. 2.00 per ordinary share |
| 2012 April | Issue of ordinary shares to satisfy a part of the final dividend for 2011 of Rs. 2.00 per ordinary share |
| 2011 September | Share split of one ordinary share for every one ordinary share held immediately after the right issue |
| 2011 August | Rights issue of one ordinary share for every fourteen ordinary shares held |
| 2011 April | Issue of ordinary shares to satisfy a part of the final dividend for 2010 of Rs. 2.00 per ordinary share |
| 2010 June | Share split of one ordinary share for every two ordinary shares held |
| 2007 June | Scrip issue of one ordinary share for every three ordinary shares held |
| 2007 April | Rights issue of three ordinary shares for every ten ordinary shares held |
| 2005 June | Scrip issue of one ordinary share for every one ordinary share held |
| 2003 October | Rights issue of one ordinary share for every four ordinary shares held |
| 2003 May | Scrip issue of one ordinary share for every three ordinary shares held |
| 2001 May | Scrip issue of one ordinary share for every five ordinary shares held |
| 1998 June | Scrip issue of three ordinary shares for every ten ordinary shares held |