Stakeholder Analysis
Together with Customers
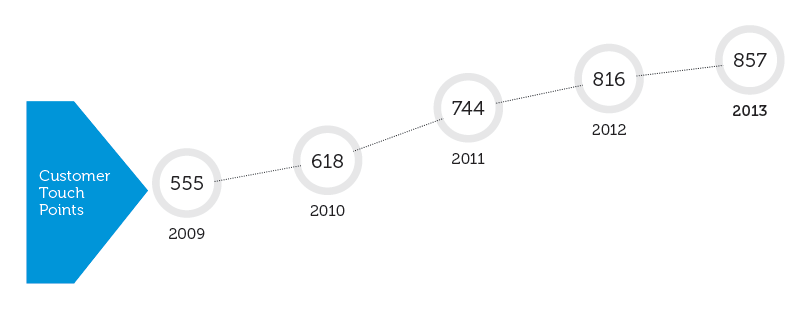
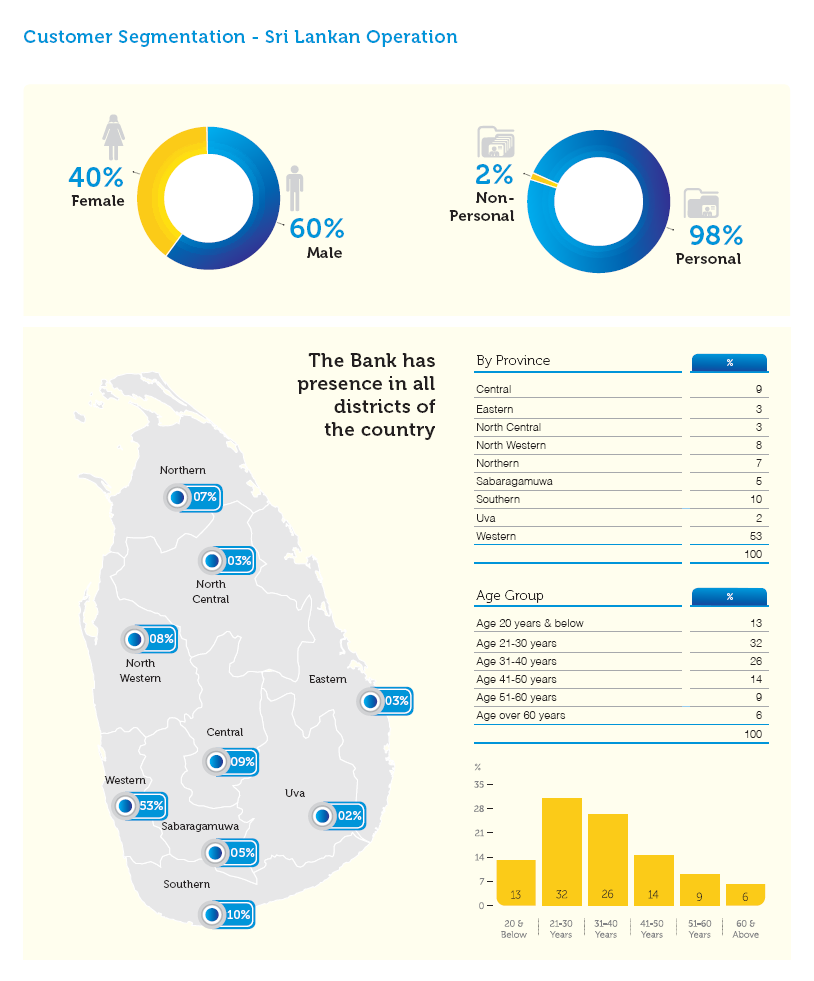
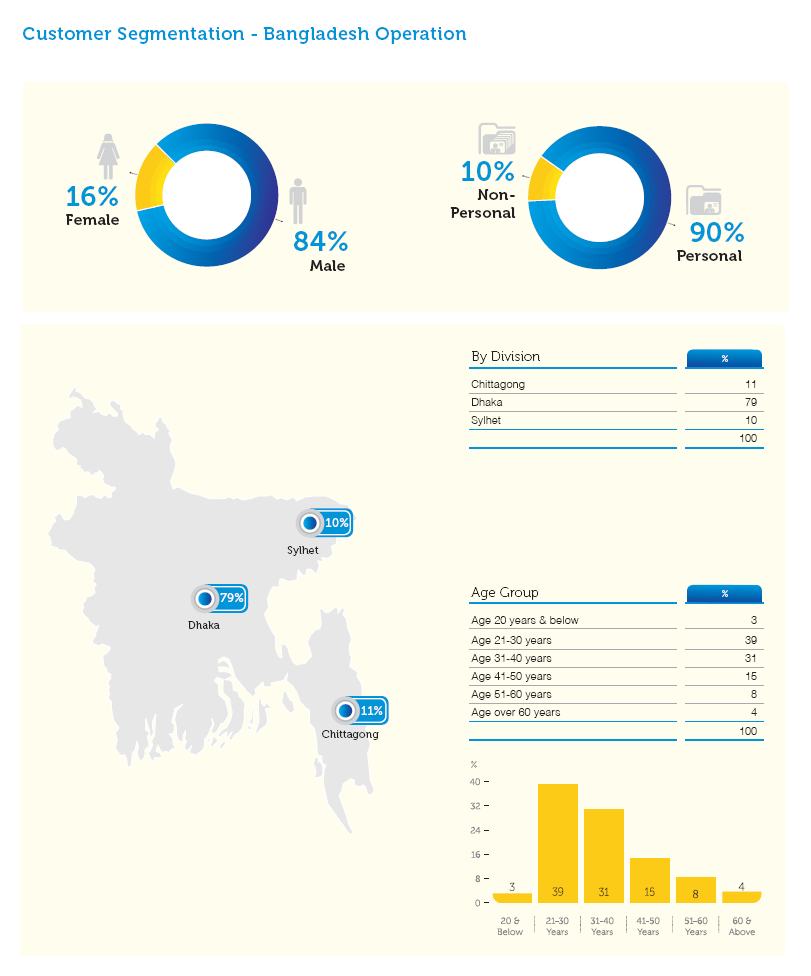
The world of banking is a highly competitive one. Customers are constantly being offered a plethora of products and services by many a bank. Ultimately they opt for the Bank that can provide the most favourable financial solutions, the greatest convenience, reputed safety and security and benchmarked service standards, among other criteria. Commercial Bank constantly strives to rise up to and meet these expectations...in turn, we are happy to welcome more and more customers who join us for the journey.
This is truly a journey taken together to prosperity.
Together with Employees
Profiling employee relationships with employers is much more complex than it has ever been...and that is a really good thing. Employee expectations have moved well beyond the contours of the job itself to areas such as job security, career growth and advancement, opportunities for skill enhancement and learning, working culture and more. The employer looks beyond the functional input of an employee, to loyalty, ‘ownership’ of their work and responsibility, productivity, happiness on the job, work and life balance and more. As an employer of choice, Commercial Bank aims always to meet its employees’ expectations as we journey together to prosperity.
The Bank as the benchmark private sector bank in the country employs over 4,700 permanent and full-time employees and over 650 employees on fixed term contract. As a policy, the Bank does not recruit employees on part-time basis. The Bank recognising the importance of its human resource capital makes every endeavour to support and uplift its standard by promoting a sound work environment, equal opportunity, training and skills development, freedom of association and to protect their human rights. A summary of total number of employees by employment contract, region and gender are given below.
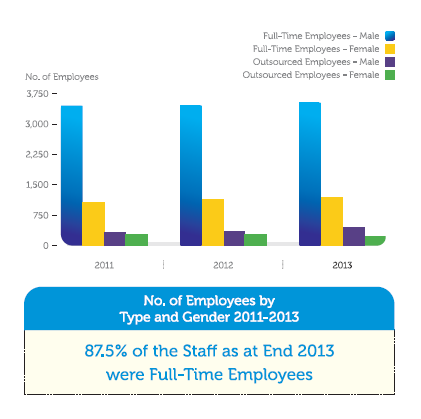
Total Number of Employees by Employment Contract and Gender
| No. of Employees | Composition of Employees (%) | |||||||
| Employee Type | 2013 | 2012 | 2011 | 2010 | 2013 | 2012 | 2011 | 2010 |
| Full-time employees - Male | 3,539 | 3,470 | 3,459 | 3,289 | 74.82 | 75.40 | 76.46 | 76.12 |
| Full-time employees - Female | 1,191 | 1,132 | 1,065 | 1,032 | 25.18 | 24.60 | 23.54 | 23.88 |
| Total | 4,730 | 4,602 | 4,524 | 4,321 | 100.00 | 100.00 | 100.00 | 100.00 |
| Outsourced employees - Male | 443 | 344 | 330 | 308 | 65.53 | 56.39 | 53.66 | 50.41 |
| Outsourced employees - Female | 233 | 266 | 285 | 303 | 34.47 | 43.61 | 46.34 | 49.59 |
| Total | 676 | 610 | 615 | 611 | 100.00 | 100.00 | 100.00 | 100.00 |
Total Workforce by Region and Gender
| 2013 | 2012 | 2011 | 2010 | |||||||||||||
| No. of Branches |
No. of Employees | No. of Branches |
No. of Employees | No. of Branches |
No. of Employees | No. of Branches |
No. of Employees | |||||||||
| Province/Departments and Other Business Units | Male | Female | Total | Male | Female | Total | Male | Female | Total | Male | Female | Total | ||||
| Central | 20 | 216 | 63 | 279 | 20 | 213 | 64 | 277 | 16 | 205 | 59 | 264 | 16 | 208 | 59 | 267 |
| Eastern | 9 | 87 | 11 | 98 | 9 | 82 | 13 | 95 | 9 | 80 | 19 | 99 | 6 | 66 | 17 | 83 |
| Northern | 15 | 130 | 66 | 196 | 14 | 124 | 67 | 191 | 12 | 113 | 61 | 174 | 10 | 91 | 57 | 148 |
| North-Central | 7 | 79 | 11 | 90 | 6 | 75 | 10 | 85 | 6 | 77 | 7 | 84 | 5 | 69 | 9 | 78 |
| North-Western | 19 | 211 | 46 | 257 | 19 | 188 | 40 | 228 | 16 | 197 | 41 | 238 | 14 | 188 | 32 | 220 |
| Sabaragamuwa | 14 | 139 | 17 | 156 | 14 | 146 | 15 | 161 | 14 | 147 | 14 | 161 | 12 | 140 | 13 | 153 |
| Southern | 23 | 245 | 74 | 319 | 23 | 248 | 70 | 318 | 22 | 251 | 64 | 315 | 20 | 245 | 62 | 307 |
| Uva | 8 | 79 | 10 | 89 | 8 | 75 | 9 | 84 | 8 | 74 | 13 | 87 | 6 | 65 | 7 | 72 |
| Western | 120 | 1,286 | 557 | 1,843 | 114 | 1,286 | 529 | 1,815 | 110 | 1,299 | 469 | 1,768 | 98 | 1,236 | 466 | 1,702 |
| Departments and Other Business Units |
900 | 292 | 1,192 | 875 | 271 | 1,146 | 859 | 277 | 1,136 | 819 | 271 | 1,090 | ||||
| Bangladesh | 18 | 167 | 44 | 211 | 17 | 158 | 44 | 202 | 17 | 157 | 41 | 198 | 17 | 162 | 39 | 201 |
| Total | 253 | 3,539 | 1,191 | 4,730 | 244 | 3,470 | 1,132 | 4,602 | 230 | 3,459 | 1,065 | 4,524 | 204 | 3,289 | 1,032 | 4,321 |
Total Number and Percentage of New Employees Hired by Age Group and Gender - Sri Lanka
| 2013 | 2012 | 2011 | ||||||||||
| New Employee Hired | (%)* | New Employee Hired | (%)* | New Employee Hired | (%)* | |||||||
| Category | Male | Female | Male | Female | Male | Female | Male | Female | Male | Female | Male | Female |
| Corporate Management | ||||||||||||
| Below 30 years | – | – | – | – | – | – | – | – | – | – | – | – |
| 30 - 50 years | – | – | – | – | – | – | – | – | 2 | – | 8.70 | – |
| 51 - 60 years | – | – | – | – | – | – | – | – | – | – | – | – |
| Executive Officers | ||||||||||||
| Below 30 years | 1 | 2 | 0.08 | 0.46 | – | 1 | – | 0.23 | 5 | 2 | 0.40 | 0.47 |
| 30 - 50 years | 1 | 1 | 0.08 | 0.23 | 2 | – | 0.16 | – | 1 | – | 0.08 | – |
| 51 - 60 years | – | – | – | – | – | – | – | – | – | – | – | – |
| Junior Executive Assistants and Allied | ||||||||||||
| Below 30 years | – | – | – | – | – | – | – | – | – | – | – | – |
| 30 - 50 years | 1 | 1 | 0.06 | 0.21 | – | – | – | – | – | – | – | – |
| 51 - 60 years | – | – | – | – | – | – | – | – | – | – | – | – |
| Banking Trainees | ||||||||||||
| Below 30 years | 206 | 95 | 67.76 | 43.58 | 106 | 101 | 22.70 | 61.96 | 291 | 52 | 53.99 | 44.07 |
| 30 - 50 years | – | – | – | – | – | – | – | – | – | – | – | – |
| 51 - 60 years | – | – | – | – | – | – | – | – | – | – | – | – |
| Office Assistants and Other | ||||||||||||
| Below 30 years | – | – | – | – | – | – | – | – | – | – | – | – |
| 30 - 50 years | – | – | – | – | – | – | – | – | – | – | – | – |
| 51 - 60 years | – | – | – | – | – | – | – | – | – | – | – | – |
| Total | 209 | 99 | 6.20 | 8.63 | 108 | 102 | 3.26 | 9.38 | 299 | 54 | 9.06 | 5.27 |
* As a % of total male/female staff in each employee category
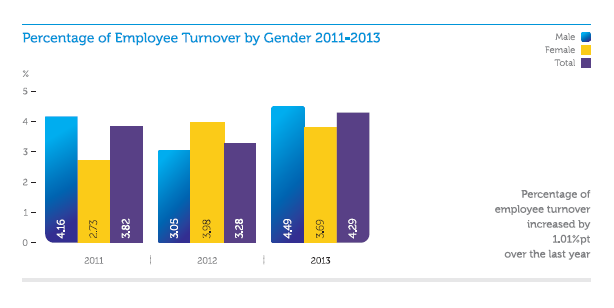
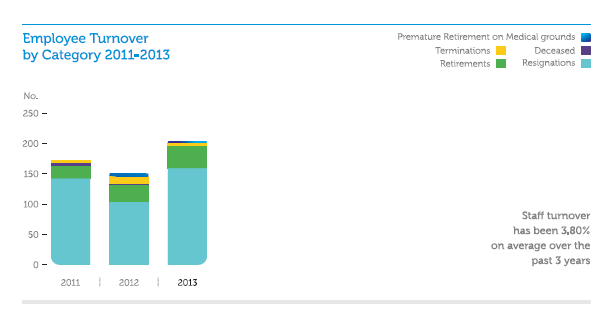
Total Number and Percentage of Employee Attrition by Age Group and Gender - Sri Lanka
| 2013 | 2012 | 2011 | ||||||||||
| Employee Attrition | (%)* | Employee Attrition | (%)* | Employee Attrition | (%)* | |||||||
| Category | Male | Female | Male | Female | Male | Female | Male | Female | Male | Female | Male | Female |
| Corporate Management | ||||||||||||
| Below 30 years | – | – | – | – | – | – | – | – | – | – | – | – |
| 30 - 50 years | – | – | – | – | – | – | – | – | 1 | – | 4.35 | – |
| 51 - 60 years | 3 | – | 0.14 | – | 3 | – | 13.64 | – | 1 | – | 4.35 | – |
| Executive Officers | ||||||||||||
| Below 30 years | 5 | 1 | 0.38 | 0.23 | 4 | 5 | 0.31 | 1.14 | 5 | 3 | 0.40 | 0.70 |
| 30 - 50 years | 20 | 4 | 1.53 | 0.90 | 16 | 5 | 1.25 | 1.14 | 9 | 2 | 0.72 | 0.47 |
| 51 - 60 years | 21 | 5 | 1.61 | 1.13 | 17 | 3 | 1.33 | 0.69 | 9 | 3 | 0.72 | 0.70 |
| Junior Executive Assistants and Allied | ||||||||||||
| Below 30 years | 34 | 9 | 2.07 | 1.87 | 19 | 9 | 1.33 | 1.86 | 26 | 5 | 1.90 | 1.05 |
| 30 - 50 years | 5 | 3 | 0.31 | 0.62 | 2 | 5 | 0.14 | 1.03 | 6 | 5 | 0.44 | 1.05 |
| 51 - 60 years | 4 | 4 | 0.24 | 0.83 | 1 | 3 | 0.07 | 0.62 | 8 | 1 | 0.58 | 0.21 |
| Banking Trainees | ||||||||||||
| Below 30 years | 49 | 14 | 16.12 | 6.42 | 23 | 9 | 4.93 | 5.52 | 47 | 6 | 8.72 | 5.08 |
| 30 - 50 years | – | – | – | – | 1 | – | 0.21 | – | – | – | – | – |
| 51 - 60 years | – | – | – | – | – | – | – | – | – | – | – | – |
| Office Assistants and Other | ||||||||||||
| Below 30 years | – | – | – | – | – | – | – | – | – | – | – | – |
| 30 - 50 years | – | – | – | – | 1 | – | 0.90 | – | 3 | – | 0.56 | – |
| 51 - 60 years | 8 | – | 8.00 | – | 9 | – | 8.11 | – | 7 | – | 1.30 | – |
| Total | 149 | 40 | 4.42 | 3.49 | 96 | 39 | 2.90 | 3.58 | 122 | 25 | 3.69 | 2.44 |
* As a % of total male/female staff in each employee category
Total Number and Percentage of New Employees Hired by age Group and Gender - Bangladesh
| 2013 | 2012 | 2011 | ||||||||||
| New Employee Hired | (%)* | New Employee Hired | (%)* | New Employee Hired | (%)* | |||||||
| Category | Male | Female | Male | Female | Male | Female | Male | Female | Male | Female | Male | Female |
| Corporate Management | ||||||||||||
| Below 30 years | – | – | – | – | – | – | – | – | – | – | – | – |
| 30 - 50 years | – | – | – | – | – | – | – | – | – | – | – | – |
| 51 - 60 years | – | – | – | – | – | – | – | – | – | – | – | – |
| Executive Officers | ||||||||||||
| Below 30 years | – | – | – | – | 1 | – | 0.98 | – | 1 | – | 1.01 | – |
| 30 - 50 years | 1 | – | 0.98 | – | 2 | – | 1.96 | – | 1 | 6 | 1.01 | 26.09 |
| 51 - 60 years | – | – | – | – | – | – | – | – | – | – | ||
| Junior Executive Assistants and Allied | ||||||||||||
| Below 30 years | 18 | 4 | 32.14 | 21.05 | 9 | 6 | 16.07 | 31.58 | 9 | 5 | 19.15 | 27.78 |
| 30 - 50 years | – | – | – | – | 2 | – | 3.57 | – | 1 | – | 2.13 | – |
| 51 - 60 years | – | – | – | – | – | – | – | – | – | – | – | – |
| Banking Trainees | ||||||||||||
| Below 30 years | – | – | – | – | – | – | – | – | – | – | – | – |
| 30 - 50 years | – | – | – | – | – | – | – | – | – | – | – | – |
| 51 - 60 years | – | – | – | – | – | – | – | – | – | – | – | – |
| Office Assistants and Other | ||||||||||||
| Below 30 years | – | – | – | – | – | – | – | – | – | – | – | – |
| 30 - 50 years | – | – | – | – | – | – | – | – | – | – | – | – |
| 51 - 60 years | – | – | – | – | – | – | – | – | – | – | – | – |
| Total | 19 | 4 | 11.38 | 9.09 | 14 | 6 | 8.86 | 13.64 | 12 | 11 | 7.64 | 26.83 |
* As a % of total male/female staff in each employee category
Total Number and Percentage of Employee Attrition by Age Group and Gender - Bangladesh
| 2013 | 2012 | 2011 | ||||||||||
| Employee Attrition | (%)* | Employee Attrition | (%)* | Employee Attrition | (%)* | |||||||
| Category | Male | Female | Male | Female | Male | Female | Male | Female | Male | Female | Male | Female |
| Corporate Management | ||||||||||||
| Below 30 years | – | – | – | – | – | – | – | – | – | – | – | – |
| 30 - 50 years | – | – | – | – | – | – | – | – | – | – | – | – |
| 51 - 60 years | – | – | – | – | – | – | – | – | – | – | – | – |
| Executive Officers | ||||||||||||
| Below 30 years | 9 | 3 | 8.82 | 12.00 | – | – | – | – | 1 | – | 1.01 | – |
| 30 - 50 years | 1 | 1 | 0.98 | 4.00 | 7 | 5 | 6.86 | 20.00 | 11 | 2 | 11.11 | 8.70 |
| 51 - 60 years | – | – | – | – | – | – | – | – | 1 | – | 1.01 | – |
| Junior Executive Assistants and Allied | ||||||||||||
| Below 30 years | – | – | – | – | – | – | – | – | 3 | – | 6.38 | – |
| 30 - 50 years | – | – | – | – | 3 | 1 | 5.36 | 5.26 | 6 | 2 | 12.77 | 11.11 |
| 51 - 60 years | – | – | – | – | – | – | – | – | – | – | – | – |
| Banking Trainees | ||||||||||||
| Below 30 years | – | – | – | – | – | – | – | – | – | – | – | – |
| 30 - 50 years | – | – | – | – | – | – | – | – | – | – | – | – |
| 51 - 60 years | – | – | – | – | – | – | – | – | – | – | – | – |
| Office Assistants and Other | ||||||||||||
| Below 30 years | – | – | – | – | – | – | – | – | – | – | – | – |
| 30 - 50 years | – | – | – | – | – | – | – | – | – | – | – | – |
| 51 - 60 years | – | – | – | – | – | – | – | – | – | – | – | – |
| Total | 10 | 4 | 6.33 | 9.09 | 10 | 6 | 6.33 | 13.64 | 22 | 4 | 14.01 | 9.76 |
* As a % of total male/female staff in each employee category
Employee Related Expenses
| 2013 | 2012 | 2011 | 2010 | 2009 | |
| Rs. ’000 | Rs. ’000 | Rs. ’000 | Rs. ’000 | Rs. ’000 | |
| Training & development cost | 54,903 | 47,453 | 47,522 | 36,471 | 24,592 |
| Health & Safety related cost | 277,955 | 219,673 | 163,738 | 166,967 | 144,641 |
| Total staff emoluments | 8,186,205 | 7,769,788 | 6,289,693 | 5,589,579 | 5,080,531 |
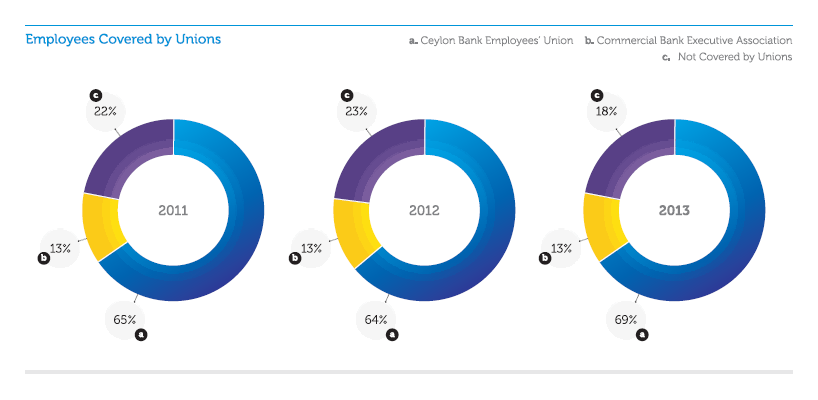
Percentage of Total Employees Covered by Employee Associations
| 2013 | 2012 | 2011 | 2010 | |||||
| Name of Employee Association | No. of Employees |
% | No. of Employees |
% | No. of Employees |
% | No. of Employees |
% |
| Ceylon Bank Employees’ Union | 3,102 | 69.04 | 2,928 | 63.62 | 2,803 | 64.75 | 2,608 | 63.25 |
| Commercial Bank Executive Association | 590 | 13.13 | 588 | 12.78 | 548 | 12.66 | 338 | 8.20 |
| Total | 3,692 | 82.17 | 3,516 | 76.40 | 3,351 | 77.41 | 2,946 | 71.45 |
Over 80% of the Bank’s permanent workforce has membership in either one of the two employee associations. The continuous and cordial engagement with the two employee associations has brought about many benefits to both employees and the Bank and has helped reaching amicable solutions. There are no employee associations in our operations in Bangladesh.
The Ratio of Basic Salary of Women to Men by Employee Category
| Ratio of Basic Salary Women to Men | |||
| Category | 2013 | 2012 | 2011 |
| Corporate Management | 1:0.87 | 1:0.97 | 1:1.10 |
| Executive Officers | 1:0.98 | 1:0.96 | 1:0.97 |
| Junior Executive Assistants and Allied | 1:0.85 | 1:0.88 | 1:0.88 |
| Banking Trainees | 1:0.98 | 1:1.06 | 1:0.96 |
| Office Assistants* | N/A | N/A | N/A |
*There are no Female Office Assistants
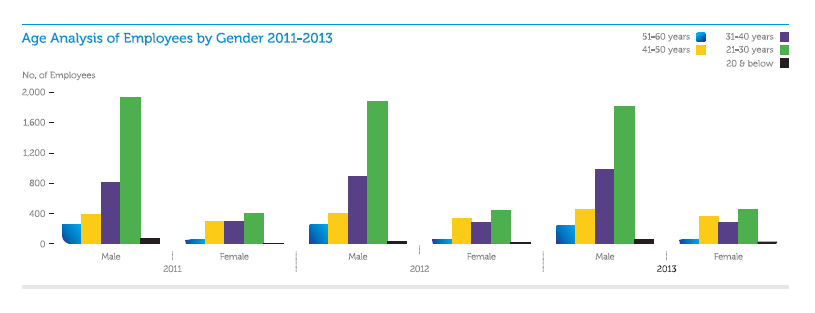
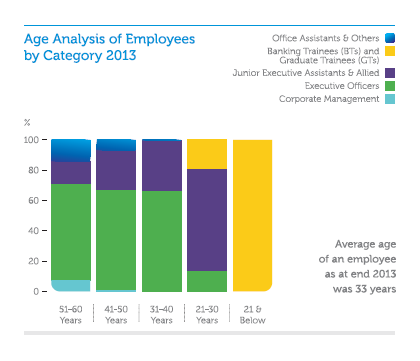
Composition of the Board and Employees by Employee Category
| Gender (%) | Age Group (%) | ||||
| Category | Male | Female | Below 30 years |
30-50 years |
Over 50 years |
| Board of Directors | 100.00 | 0.00 | 0.00 | 0.00 | 100.00 |
| Corporate Management | 87.50 | 12.50 | 0.00 | 33.33 | 66.67 |
| Executive Officers | 74.66 | 25.34 | 16.39 | 73.45 | 10.16 |
| Junior Executive Assistants and Allied | 77.27 | 22.73 | 69.36 | 28.64 | 2.00 |
| Banking Trainees | 58.24 | 41.76 | 100.00 | 0.00 | 0.00 |
| Office Assistants and Others | 100.00 | 0.00 | 0.00 | 58.00 | 42.00 |
together with Investors
The shareholder relationship...close…and at our core. Security of investment, remunerative returns and lucrative growth are top of mind for our shareholders. Commercial Bank has these needs clearly in focus as we set about creating prime value for them. We are fortunate indeed to enjoy the invaluable, long term trust and loyalty of our shareholder family. With such strong support, it is easy for the Bank to plan mutual growth...yet another great example of journeying together to prosperity!
Shareholder Base
| 2013 | 2012 | |
| No. of ordinary voting shareholders | 9,091 | 9,509 |
| No. of ordinary non-voting shareholders | 4,336 | 4,349 |
| Total | 13,427 | 13,858 |
Composition of Shareholders
| As at December 31, 2013 | As at December 31, 2012 | |||||||
| No. of Shareholders |
% | No. of Shares | % | No. of Shareholders |
% | No. of Shares | % | |
| Ordinary Shares Voting | ||||||||
| Resident | 8,789 | 96.68 | 511,640,873 | 64.39 | 9,203 | 96.78 | 497,768,042 | 63.82 |
| Non-resident | 302 | 3.32 | 282,894,946 | 35.61 | 306 | 3.22 | 282,246,190 | 36.18 |
| Total | 9,091 | 100.00 | 794,535,819 | 100.00 | 9,509 | 100.00 | 780,014,232 | 100.00 |
| Individuals | 8,546 | 94.01 | 142,086,949 | 17.88 | 8,934 | 93.95 | 130,953,368 | 16.79 |
| Institutions | 545 | 5.99 | 652,448,870 | 82.12 | 575 | 6.05 | 649,060,864 | 83.21 |
| Total | 9,091 | 100.00 | 794,535,819 | 100.00 | 9,509 | 100.00 | 780,014,232 | 100.00 |
| Ordinary Shares Non-Voting | ||||||||
| Resident | 4,233 | 97.62 | 42,218,874 | 77.40 | 4,251 | 97.75 | 41,852,800 | 78.27 |
| Non-resident | 103 | 2.38 | 12,324,348 | 22.60 | 98 | 2.25 | 11,620,948 | 21.73 |
| Total | 4,336 | 100.00 | 54,543,222 | 100.00 | 4,349 | 100.00 | 53,473,748 | 100.00 |
| Individuals | 4,119 | 95.00 | 32,321,004 | 59.26 | 4,127 | 94.90 | 32,479,975 | 60.74 |
| Institutions | 217 | 5.00 | 22,222,218 | 40.74 | 222 | 5.10 | 20,993,773 | 39.26 |
| Total | 4,336 | 100.00 | 54,543,222 | 100.00 | 4,349 | 100.00 | 53,473,748 | 100.00 |
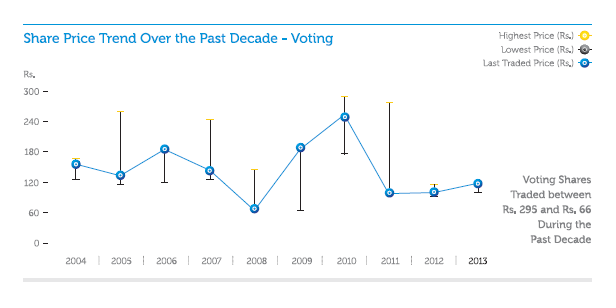
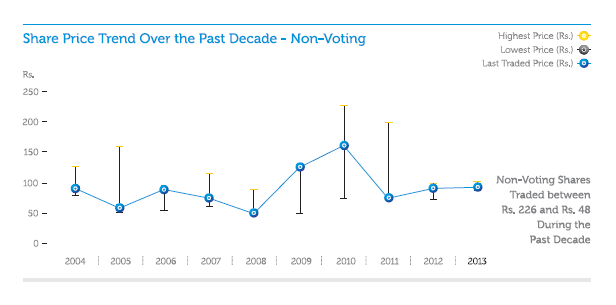
Share Price Trend Over Last Ten Years
| 2013 | 2012 | 2011 | 2010 | 2009 | 2008 | 2007 | 2006 | 2005 | 2004 | |
| Ordinary Shares Voting | ||||||||||
| Highest price (Rs.) | 126.00 | 119.50 | 284.00 | 295.00 | 192.00 | 149.75 | 250.00 | 192.50 | 269.00 | 170.00 |
| Lowest price (Rs.) | 103.20 | 96.80 | 97.00 | 178.00 | 66.00 | 66.25 | 128.00 | 123.00 | 120.00 | 130.00 |
| Last traded price (Rs.) | 120.40 | 103.00 | 100.00 | 259.90 | 189.50 | 67.00 | 147.00 | 190.00 | 135.50 | 159.75 |
| Ordinary Shares Non-Voting | ||||||||||
| Highest price (Rs.) | 102.00 | 99.50 | 200.00 | 226.00 | 131.25 | 89.50 | 114.50 | 90.00 | 160.00 | 126.00 |
| Lowest price (Rs.) | 87.00 | 73.00 | 69.10 | 75.00 | 48.25 | 48.00 | 60.00 | 54.00 | 51.00 | 80.00 |
| Last traded price (Rs.) | 93.00 | 91.10 | 74.50 | 162.00 | 124.75 | 49.00 | 74.50 | 89.00 | 57.50 | 90.00 |
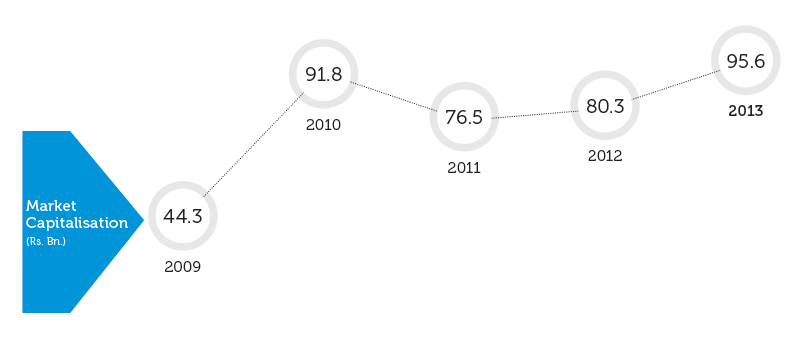
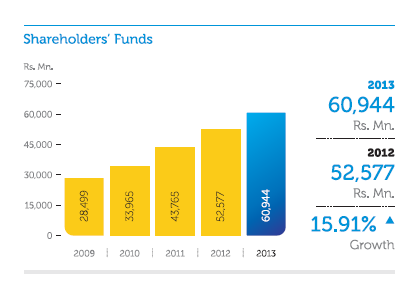
Information on Shareholders’ Funds and Market Capitalisation
| Shareholders’ Funds | Com Bank’s Market Capitalisation (*) |
Total Market Capitalisation of the CSE |
Com Bank's Market Capitalisation as a Percentage of CSE Market Capitalisation |
Com Bank’s Market Capitalisation Ranking |
|
| As at December 31, | Rs. Mn. | Rs. Mn. | Rs. Mn. | % | Rank |
| 2013 | 60,944 | 95,654 | 2,286,320 | 4.11 | 4 |
| 2012 | 52,577 | 80,341 | 2,167,581 | 3.71 | 5 |
| 2011 | 43,765 | 76,509 | 2,268,854 | 3.37 | 6 |
| 2010 | 33,965 | 91,824 | 2,280,874 | 4.03 | 4 |
| 2009 | 28,499 | 44,309 | 1,092,138 | 4.06 | 5 |
| 2008 | 25,891 | 15,630 | 488,813 | 3.20 | 4 |
| 2007 | 23,937 | 34,234 | 820,652 | 4.17 | 4 |
| 2006 | 15,843 | 25,368 | 834,763 | 3.04 | 5 |
| 2005 | 15,768 | 17,991 | 583,786 | 3.08 | 4 |
| 2004 | 13,911 | 10,389 | 381,913 | 2.72 | 6 |
* Commercial Bank’s Market Capitalisation includes only voting ordinary shares.
together with Government Institutions
We never lose sight of the role we play in the national scheme of things. The Bank maintains close and cordial relationships with all Government institutions, including legislators and regulators. We fully comply with all statutory and regulatory requirements in letter and spirit. Through such ethics and initiatives, the Bank stands together with the various institutions of Government as they strive to achieve the broader macroeconomic goals of the Nation.
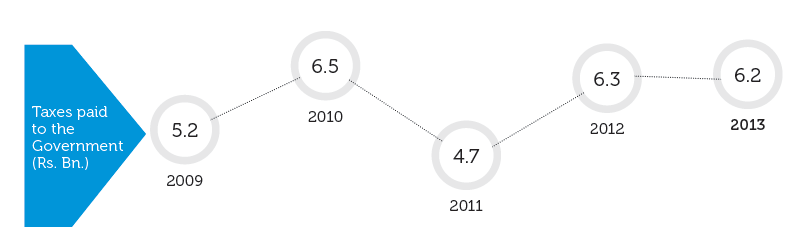
| Rs. ’000 | 2013 | 2012 | 2011 | 2010 | 2009 |
| Taxes to Governments | |||||
| Income Tax | 4,065,008 | 4,197,004 | 3,014,361 | 3,794,100 | 2,886,853 |
| VAT on Financial Services | 1,968,954 | 1,987,313 | 1,522,972 | 2,708,918 | 2,264,116 |
| Nation Building Tax | 81,883 | 73,513 | 155,681 | – | – |
| Crop Insurance levy | 75,737 | – | – | – | – |
| Sub total - Taxes to Governments | 6,191,582 | 6,257,830 | 4,693,014 | 6,503,018 | 5,150,969 |
| Taxes collected on behalf of Governments | |||||
| VAT | 674,270 | – | 102 | 201,792 | 518,527 |
| Stamp duty | 182,794 | 168,974 | 183,797 | 101,655 | 61,724 |
| Withholding tax on dividend | 120,876 | 452,386 | 315,040 | 169,915 | 131,736 |
| Sub total taxes collected | 977,940 | 621,360 | 498,939 | 473,362 | 711,987 |
Government Institutions for the Bank include the Central Bank of Sri Lanka, the Bangladesh Bank, the Department of Inland Revenue, the Ministry of Finance, the Registrar of Companies, the Colombo Stock Exchange, the Securities and Exchange Commission of Sri Lanka, the Sri Lanka Accounting and Auditing Standards Monitoring Board, professional organisations such as The Institute of Chartered Accountants of Sri Lanka, National Chamber of Commerce of Sri Lanka and other Government organisations.
Financial Assistance Received from Government
The Bank in the ordinary course of business granted several loans and advances to its customers and made several investments which are exempt from Income Tax under the Inland Revenue Act No. 10 of 2006 as detailed below:
- Interest Income on loans granted through Investment Fund Account created by the Bank - Section 13 (xxxxxx)
- Interest Income on loans granted to those companies which met the specified criteria - Section 13 (x) (i) & (ii), 13 (xx)
- Interest income and capital gains earned on investments in Sri Lanka Development Bonds and Sri Lanka Sovereign Bonds (SLDBs & SLSBs) issued by the Central Bank of Sri Lanka - Sections 13 (xxx) & 13 (xxxx) and 13 (xxxxx) (i) & (ii)
- Interest income from investments made outside Sri Lanka where such interest is remitted to Sri Lanka through a bank - Section 9 (m)
- Capital gain on sale of Shares - Section 13 (t)
- Fee and commission income earned in foreign currency - Section 13 (dddd)
The table below summarises the total tax savings earned by the Bank due to the above measures of the Government and also the notional tax credit claimed by the Bank on interest income earned on investments made in Government Treasury Bills and Bonds over the last five-year period.
| For the year ended December 31, (Rs. Mn.) | 2013 | 2012 | 2011 | 2010 | 2009 |
| Tax saving | 887.4 | 574.3 | 422.5 | 686.6 | 543.0 |
| Notional tax credit claimed | 903.6 | 329.9 | 350.0 | 572.9 | 332.5 |
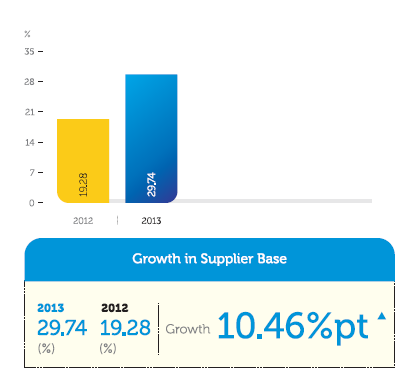
together with Suppliers & Business Partners
Every link across the Bank’s supply chain is invaluable. We are committed to a furtherance of mutual prosperity as we first establish, then strengthen and grow relationships with an ever-widening supplier base who share our values in terms of long term sustainability. We are committed to march together to prosperity.
Bank’s supply chain plays a key role as they provide various goods and services required for running the business of the Bank. Following are the various types of suppliers that comprise the Bank’s supply chain.
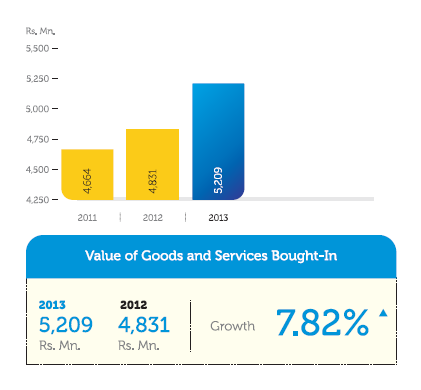
Value of Goods and Services Bought-in by Types of Suppliers
| Rs. Mn. | 2013 | 2012 | 2011 |
| Utility Service Providers Energy (Electricity and Fuel), Telecommunication (Data connections) |
597.53 | 526.10 | 411.81 |
| Material Suppliers Suppliers of various materials including Paper, IT and other stationery items |
355.25 | 328.00 | 334.91 |
| Assets Suppliers Vehicle suppliers, IT equipment/Software vendors, furniture/equipment suppliers |
969.00 | 996.74 | 1,149.50 |
| Premises Providers Individual building owners, Firms renting office space, Supermarket chains |
767.83 | 638.86 | 573.25 |
| Maintenance IT equipment/software maintenance companies, Office equipment maintenance companies, Janitorial Services |
711.30 | 606.90 | 547.49 |
| Human Resource Suppliers of Outsourced Employees Including Security Services |
529.47 | 477.21 | 414.61 |
| Staff Welfare Water suppliers, Food & Beverage providers, Trainers & Consultants |
45.82 | 35.72 | 35.30 |
| Communication Media, General Post, Telecommunication (Voice connections) |
549.80 | 494.60 | 491.25 |
| Services Insurance Companies, Lawyers & Law Firms, Auditors, Valuers |
224.06 | 187.43 | 157.35 |
| Travel and Transportation Courier Services (Inland and International), Cash Transporters, Goods Transporters, Rent-a-Car Companies, Air Travel including support services such as Ticketing Agencies |
459.27 | 452.96 | 428.44 |
| Contractors Building, Interior decoration and partitioning, Wiring & Plumbing |
– | 86.89 | 120.45 |
| Waste Management Waste paper management agents/companies, Waste food management agents/companies, Used Furniture/Equipment management agents/companies |
– | – | – |
| Emergency Aid Fire Brigade, Police |
– | – | – |
| Total | 5,209.33 | 4,831.40 | 4,664.37 |
Together with Society & Environment
Without a society to serve and an environment within which we may put down roots and grow, the Bank will cease to be. Achieving congruence with society and the environment is crucial to mutual well-being. There is no question but that we march as one towards mutual prosperity.
Bank’s Contribution Towards Enhancing Employability
| 2013 | 2012 | 2011 | 2010 | 2009 | |
| Graduates recruited | 6 | 14 | 37 | 31 | 40 |
| No. of interns | 188 | 46 | 10 | ||
| No. of interns awarded with certificates | 28 | 4 |
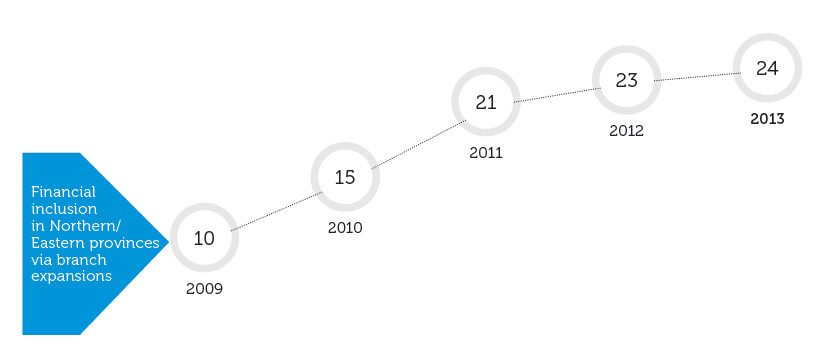
Access Points in Low-Populated or Economically Disadvantaged Areas
Sri Lanka’s 30-year war cut off a significant part of the country from key economic activities. The Northern and the Eastern Provinces in particular were not able to benefit from opportunities available to the rest of the country. Since the end of the war, we have expanded Bank’s operations in the two provinces by opening 14 new branches, revitalising communities and helping the disadvantaged to revive their prospects. The following table summarises the number of branches in operation and business volumes, underlining the Bank’s contribution to these recovering communities.
| 2013 | 2012 | 2011 | 2010 | upto end 2009 |
|
| Northern Province | |||||
| Number of branches | 15 | 15 | 13 | 12 | 7 |
| Deposits (Rs. Mn.) | 24,573 | 21,907 | 18,475 | 16,564 | 15,114 |
| Advances (Rs. Mn.) | 7,914 | 10,459 | 10,002 | 4,311 | 1,656 |
| Eastern Province | |||||
| Number of branches | 9 | 8 | 8 | 5 | 3 |
| Deposits (Rs. Mn.) | 4,870 | 4,501 | 4,337 | 3,970 | 3,730 |
| Advances (Rs. Mn.) | 3,596 | 3,873 | 3,792 | 2,376 | 1,561 |
Products Designed to Benefit Society
Over the past year Commercial Bank arranged financial facilities through a group-lending model for micro-entrepreneurs and agriculturists who are unable to secure conventional loans because of a lack of acceptable collateral. Financial assistance was provided through both bank-funded and refinance loan programmes.
Following are the loan amounts granted during 2013 under the above initiative:
| Product Line | No of Beneficiaries |
Amount Rs. Mn. |
|
| Microfinance | 1,870 | 300 | |
| New Comprehensive Rural Credit Scheme | 2,721 | 369 |