Financial Review
Your Bank, a systemically important bank in the country today, has established its name as the benchmark private sector bank as evident from numerous awards and accolades it has been bestowed with consistently over a long period. No organisation would be bestowed with such an array of awards consistently unless it generates results unparalleled to its peers, from the perspective of all stakeholders. It has inculcated the top of the mind recall among general public in terms of transparency, good governance, accountability, ethical practices etc. over the last several years.
The Bank which initially catered to a specific market segment by providing trade finance facilities has now firmly established its presence in the retail banking arena. The following indicators demonstrate the success story, the Bank has achieved over the last decade.
| Indicator | For the Year/ As at December 31, 2003 |
For the Year/ As at December 31, 2013 |
Growth | CAGR* for 10 Years (%) |
| Post tax profits (Rs. Mn.) | 1,477.5 | 10,445.5 | 8,968.0 | 21.60 |
| Deposits (Rs. Bn.) | 75.2 | 451.2 | 376.0 | 19.62 |
| Advances (Rs. Bn.) | 68.0 | 379.2 | 311.2 | 18.75 |
| Interest earning assets (Rs. Bn.) |
98.8 | 553.0 | 454.2 | 18.79 |
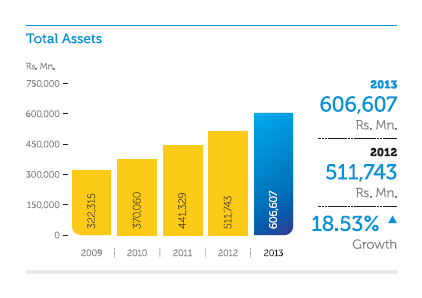
| Total assets (Rs. Bn.) | 110.3 | 606.6 | 496.3 | 18.59 |
| No. of Branches | 120 | 253 | 133 | – |
| No. of ATMs | 166 | 604 | 438 | – |
| No. of Employees | 2,648 | 4,730 | 2,082 | – |
* Compound Annual Growth Rate
As evident from the above table, Year on Year, the Bank recorded improved results in terms of profits, business volumes and also expanded its operations to have its presence in all districts in the country besides its presence in Bangladesh. Presently, the Bank holds a market share of around 10%-12% of banking sector assets, deposits and net advances.
The Bank moved to 2013 with this rich background of history which requires a sensible approach to sail the rough seas represented by stiff competition prevailing in the banking industry in Sri Lanka. The Corporate Plan and the Budget which provides direction to the Bank, set ambitious targets at the beginning of the year. The Bank leveraged all its resources and focused the attention with added vigor and achieved some of its budgeted targets through the organic growth during the year. A detailed analysis of the financial performance during the year is given in this section.
Disclosures have been made based on the SLFRS/LKASs. Nevertheless, a few areas were analysed based on the management accounts prepared by the Bank based on CBSL guidelines to bring about a fair understanding of some of the areas. Except the data for 2012 and 2013 which were based on SLFRS/LKASs, data for all the other prior years are based on previous Accounting Standards.
Profitability
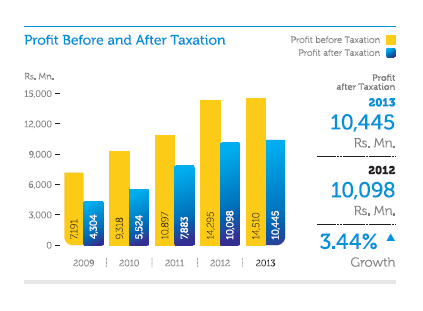
The Bank performed exceptionally well and recorded over Rs. 10.0 Bn. in post tax profits for the second consecutive year amidst challenges, that prevailed in the banking industry as evident from the slow credit growth and substantial increase in non-performing advances during the year. As per the Financial Statements for the nine months period ended September 30, 2013, your Bank recorded the highest profits among all banks operating in the country.
The pre and post tax profits for the year 2013 compared to that of the last year are given below:
| For the Year Ended | Growth Over 2012 | |||
| 2013 | 2012 | |||
| Rs. Mn. | Rs. Mn. | Rs. Mn. | % | |
| Pre tax profits | 14,510.5 | 14,295.3 | 215.2 | 1.51 |
| Post tax profits | 10,445.5 | 10,098.3 | 347.2 | 3.44 |
The Bank prepared interim Financial Statements based on SLFRSs for the first time during the year. Despite the drop experienced in foreign exchange income, the quarterly profits earned by the Bank recorded a consistent growth as shown below; The drop in foreign exchange income was mainly due to the substantial gains on revaluation of retained profits of the Off-Shore Banking Centre due to the sharp depreciation of Sri Lankan Rupee against the US $ in 2012.
| 2013 | ||||
| Quarter ended | March 31 |
June 30 |
September 30 |
December 31 |
| Pre tax profits (Rs. Mn.) | 3,229.9 | 3,277.9 | 3,896.3 | 4,106.4 |
| Growth over 2012 (%) | (19.77) | (5.84) | 23.59 | 12.95 |
| Post tax profits (Rs. Mn.) | 2,240.9 | 2,230.8 | 2,762.3 | 3,211.5 |
| Growth over 2012 (%) | (20.09) | (5.81) | 20.99 | 21.54 |
Both fund and fee-based operations of the Bank contributed towards the growth in profits during the year. The Bank had to re-price its product portfolio several times to be in line with the decline in market interest rates during the year.
Net interest income, the principal source of income from fund-based operations of the Bank reached Rs. 25,308.2 Mn., an increase of Rs. 2,453.2 Mn. or 10.73% compared to Rs. 22,855.0 Mn. recorded in 2012. This was mainly achieved due to the growth recorded in interest income which reached Rs. 62,187.0 Mn., a growth of Rs. 9,501.5 Mn., or 18.03% compared to the previous year. The growth in volumes of interest earning assets contributed in achieving this substantial growth. A similar trend was observed in interest expenses too, which recorded an increase of Rs. 7,048.4 Mn. or 23.63% compared to that of the last year. This was mainly due to the increase in volumes of interest bearing liabilities and average rate of interest thereon.
An analysis on net interest income due to change in average volume and average rate compared to the last year is given below:
| Interest Impact | Interest Impact due to change in average volumes Rs. Mn. |
Interest Impact due to change in average rates Rs. Mn. |
| Interest income | 10,909.0 | (1,407.4) |
| Interest expenses | (6,136.9) | (911.4) |
| Net interest income | 4,772.1 | (2,318.8) |
| Rs. Mn. | |
| Increase in net interest income | 2,453.2 |
Fund Based Operations
The Bank recorded satisfactory growth in volumes of both deposits and advances which exceeded the average industry growth during the year. The Bank recorded a monthly average growth of over Rs. 5.0 Bn. and Rs. 2.5 Bn. for deposits and advances respectively during the year.
| As at December 31 | Growth Over 2012 | |||
| 2013 Rs. Mn. |
2012 Rs. Mn. |
Rs. Mn. | % | |
| Deposits | 451,152.9 | 390,611.5 | 60,541.4 | 15.50 |
| Loans and advances (gross) | 379,252.9 | 343,797.0 | 35,455.9 | 10.31 |

The Bank was able to maintain the Current and Savings Accounts (CASA) to total deposits ratio almost at the same level as at the end of 2012.
| As at December 31 | ||
| 2013 | 2012 | |
| CASA ratio (%) | 43.51 | 44.52 |

The Bank raised US $ 75.0 Mn. by way of subordinated term debt which qualifies for Tier II capital from International Finance Corporation (IFC) to further supplement the deposits growth during the year. Due to the sluggish advances growth experienced by the industry, the advances to deposits ratio reduced to 82.1% at the end of 2013 compared to 87.1% at end of 2012.
| For the Year Ended | Growth Over 2012 | |||
| 2013 | 2012 | |||
| Rs. Bn. | Rs. Bn. | Rs. Bn. | % | |
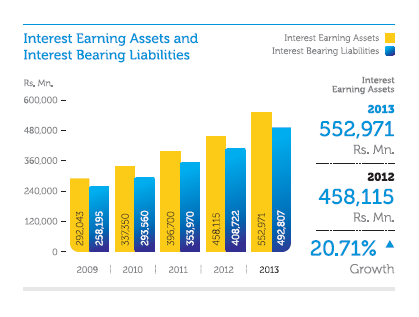
| Interest earning assets | 553.0 | 458.1 | 94.9 | 20.72 |
| Interest bearing liabilities | 492.8 | 408.7 | 84.1 | 20.58 |
The total assets of the Bank grew to Rs. 606.6 Bn. at the end of 2013 compared to Rs. 511.7 Bn. in 2012, which represented a growth of Rs. 94.9 Bn. or 18.54%, largely due to the aforementioned developments.
Fee Based Operations
The Bank recorded a growth of Rs. 651.3 Mn. or 18.10% in net fees and commission income compared to the last year. Fees and commission income relating to cards, trade finance, remittances and deposits recorded noteworthy growths compared to the last year.
The Bank utilised part of its Foreign Currency (FCY) borrowing by swapping the US $ funds to Sri Lankan Rupees (LKR) and invested in Government securities on a fully-hedged basis. The premiums paid by the Bank on these transactions are recognised as an exchange loss during the year under net gains/losses from trading in the Income Statement.
The corresponding gain from Government securities on the funds converted to LKR is included under interest income and the mark to market gain thereon is recognised either as other income in the Income Statement or under available-for-sale in Other Comprehensive Income.
The Bank also recorded substantial growth in gains during the year due to disposal of government securities and equities held under available-for-sale basis.
Other operating income of the Bank recorded over 50% growth mainly due to the net revaluation gains on foreign currency denominated assets and liabilities, which were recorded under revaluation of foreign exchange income. However, the Bank experienced a drop in translation gain on account of retained profits of Off-Shore Banking Centre as a result of lower depreciation of Rupee against the US $ during the year compared to that of the previous year.
The income from loan recoveries which were either written off or provided for has also recorded a substantial increase when compared with the last year. This was mainly due to the effective and efficient recovery procedures adopted by the Bank. As a result of the above developments, the income from total non-fund based operations of the Bank increased to Rs. 10.345 Bn., a modest growth compared to Rs. 10.161 Bn. recorded in the previous year. Therefore, the growth of Rs. 2,637.5 Mn. or 7.99 % in total operating income of the Bank during the year was mainly attributable to the growth recorded in net interest income of the Bank.
Impairment Charges on Loans and Advances
The Bank moved from time based provisioning to incurred loss methodology with the implementation of SLFRSs in 2012. The new methodology consists of two main components namely individual and collective impairment. The Bank decides a threshold limit for loans and advances and facilities which are above the limit are subject to individual impairment. These loans and advances are evaluated against the pre-determined impairment indicators decided by a steering committee. All loans which are not subject to individual impairment are categorised into groups based on homogeneous risk characteristics of each product and are subject to collective impairment based on the historical loss experience of each product portfolio expressed in terms of Probability of Default (PD) and Loss Given Default (LGD).
During the year, the Bank revised the threshold upwards and methodology for individual impairment of loans and advances after a careful analysis. The present threshold covers a substantial percentage of total loans and advances, both performing and non-performing of the Bank.
| For the Year Ended December 31, |
Change Over 2012 | |||
| 2013 | 2012 | |||
| Rs. Mn. | Rs. Mn. | Rs. Mn. | % | |
| Individual impairment | 3,021.4 | 1,296.7 | 1,724.7 | 133.00 |
| Collective impairment | 1,479.9 | 1,856.7 | (376.8) | (20.29) |
| Total impairment charge | 4,501.3 | 3,153.4 | 1,347.9 | 42.74 |
Reflecting the general market conditions that prevailed in the country, the individual impairment recorded a substantial increase compared to that of the last year. In addition, some of the loans which were subject to collective impairment got shifted to individual impairment in the current year due to the revision of the threshold limit and the methodology adopted in selecting the loans and advances for individual impairment. The above developments resulted in reducing the provision for collective impairment during the year. The impairment provision for 2013 when compared with the loan loss provision made based on the previous time based provisioning policy of the CBSL, is given herein:
| For the Year Ended December 31, |
||
| 2013 | 2012 | |
| Rs. Mn. | Rs. Mn. | |
| Total impairment charge | 4,501.3 | 3,153.4 |
| Total loan loss provision | 3,765.7 | 2,966.7 |
| Excess of impairment over loan loss provision | 735.6 | 186.7 |
Net operating income after charging the impairment provision amounted to Rs. 31,026.3 Mn., an increase of Rs. 1,206.9 Mn. or 4.05 % compared to Rs. 29,819.3 Mn. recorded in 2012.
Total operating expenses which consists of staff emoluments and other expenses recorded an increase of Rs. 1,010.1 Mn. or 7.46% compared to the last year. However, the Bank was able to curtail the growth in personnel expenses below the rate of inflation in the country. Other expenses recorded a growth over 10% mainly due to the increases reported in establishment and other administration charges during the year. Cost incurred to increase the delivery points and the increase in rentals on premises occupied by the Bank, also attributed to increase in other expenses.
As a result of the above developments, the Bank could post a marginal growth in operating profit before VAT, as detailed below:
| For the Year Ended December 31, |
Growth Over 2012 | |||
| 2013 | 2012 | |||
| Rs. Mn. | Rs. Mn. | Rs. Mn. | % | |
| Pre VAT profits | 16,479.5 | 16,282.6 | 196.9 | 1.21 |
| Post VAT profits | 14,510.5 | 14,295.3 | 215.2 | 1.51 |
Both Financial VAT on profit and income tax recorded drops during the year resulting in an improvement in post tax profits of the Bank. The Bank recorded substantial improvement in unrealised gains on treasury bills and bonds held under available-for-sale category which is recorded under Other Comprehensive Income and thereby reported a noteworthy growth in total comprehensive income for the year.
| For the Year Ended December 31, |
Growth Over 2012 | |||
| 2013 | 2012 | |||
| Rs. Mn. | Rs. Mn. | Rs. Mn. | % | |
| Total comprehensive income | 12,233.7 | 11,389.8 | 843.9 | 7.41 |
Ratios
Credit Quality Ratios
As discussed earlier, the Bank makes impairment provisions on its loans and advances portfolio which comprises of both individual and collective impairment. Ratios calculated based on the impairment are detailed below:
| 2013 (Dec.) |
2012 (Dec.) |
Variance | |
| Individual impairment as a % of total loans and advances | 1.11 | 0.99 | 0.12%pt |
| Collective impairment as a % of total loans and advances | 3.05 | 2.94 | 0.11%pt |
| Total impairment as a % of total loans and advances | 4.16 | 3.93 | 0.23%pt |
| Individual impairment as a % of individually impaired loans and advances | 61.81 | 56.98 | 4.83%pt |
| Collective impairment as a % of loans and advances subject to collective impairment | 3.11 | 2.99 | 0.12%pt |
Non-Performing Advances (NPA) Ratio
The Bank’s core banking system continues to operate under the previous time based CBSL provisioning policy to classify non-performing advances without any manual intervention. Our provisioning policy is more stringent than the basic principles stipulated by the CBSL.
The entire banking industry experienced an increasing trend in non-performing advances during the year as detailed under the banking industry at the beginning of this analysis. Nevertheless, the Bank was able to curtail the increase in NPA due to the proactive approach adopted by the branches with the support received from the Central Recoveries Department which is discussed in detail towards the end of this Review.
| As at December 31 | ||
| 2013 | 2012 | |
| Non-performing loans and advances (Rs. Mn.) | 14,040.6 | 11,169.5 |
| Gross NPA ratio (%) | 3.88 | 3.37 |
| Provision cover (%) | 45.41 | 45.46 |
| Open credit exposure ratio (%) | 11.69 | 12.35 |

The Bank is gradually improving its provision cover to be in line with figures of reputed international banks. The provision cover has improved to 45.41% from 28.53.% in 2009, by 16.88% during the last five years.

Profitability Ratios
Return on Assets (ROA) and Return on Equity (ROE)
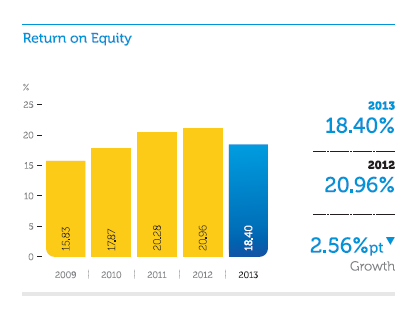
The growth reported by the Bank in assets and equity was well above the growth in profits resulting in decreases in Return on Assets (ROA) and Return on Equity (ROE) as shown below; However, the ratios of the Bank continue to remain well above the industry average ratios.
| 2013 | 2012 | |
| ROA (%) (after tax) | 1.87 | 2.12 |
| ROE (%) (after tax) | 18.40 | 20.96 |
Efficiency Ratios
Cost to Income Ratio
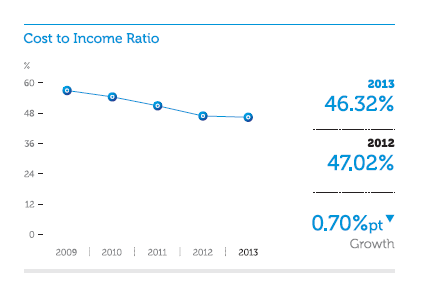
Commercial Bank is recognised as the best private sector bank in the country today. One of the main contributory factors for this success was the exemplary operational excellence the Bank has portrayed consistently over a long period of time, which was achieved through optimum and lean cost structures adopted by the Bank. Despite the increase recorded in operational expenses, the Cost to Income ratio recorded a marginal improvement when compared to the last year.
| 2013 | 2012 | |
| Cost to income ratio (%) | 46.32 | 47.02 |
Equity
The shareholders’ funds of the Bank improved by Rs. 8,367.0 Mn. or 15.91% during the year. Main contributory factors for this increase are the plough back of profits with the payment of dividend and Rs. 2/- per share satisfied in the form of issue and allotment of new shares as part of the final dividend for 2012 paid in 2013. Furthermore, funds transferred to Investment Fund Account, from savings on income tax and financial VAT also helped in swelling the capital base of the Bank. Total shareholders’ funds stood at Rs. 60,944.0 Mn. as at December 31, 2013.
The aforementioned developments in the capital base increased the free capital of the Bank to Rs. 5,519.2 Bn. and as a result, the single borrower limit applicable to the Bank also rose to Rs. 17,789.4 Mn. for individual customers and Rs. 19,568.4 Mn. for group of customers, one of the highest in the banking industry.
Capital Adequacy Ratio (CAR)
The Bank’s CAR recorded an improvement mainly due to the increase in capital as described above as well as due to the subordinated term debt raised from International Finance Corporation during the year which is eligible to be treated under Tier II capital of the Bank.
| CAR | As at December 31 | ||
| 2013 | 2012 | Minimum Ratio | |
| % | % | % | |
| Tier I | 13.27 | 12.64 | 5.00 |
| Tier I & II | 16.91 | 13.85 | 10.00 |
Statutory Liquid Assets Ratio (SLAR)
The Bank’s liquid assets ratio stood above 30% during most parts of the year. The deposit mobilisation efforts have brought handsome rewards to the Bank. However, the banking industry has not experienced the desired levels of credit growth during the year which resulted in an increase in the liquidity position across the industry. Similarly the Bank also recorded relatively higher levels of liquidity throughout the year. The Bank is well aware of the trade-off between profitability and liquidity in managing the operations of the Bank.
Group Performance
The Commercial Bank group which consists of the Bank, Commercial Development Company (CDC), ONEzero Company and Commex S.R.L., the subsidiaries of the Bank and Commercial Insurance Brokers (Pvt) Ltd. and Equity Investments Lanka Ltd., the associates of the Bank recorded satisfactory results during the year. The details of operations of these companies are not elaborated in detail since they are not material in terms of their contribution to the results and the financial position of the Group. Nevertheless, the group recorded a pre and post tax profits of Rs. 14,692.8 Mn. and Rs. 10,573.4 Mn. respectively, compared to Rs. 14,312.9 Mn. and Rs. 10,081.2 Mn. recorded in 2012, recording growths of 2.65% and 4.88% respectively.
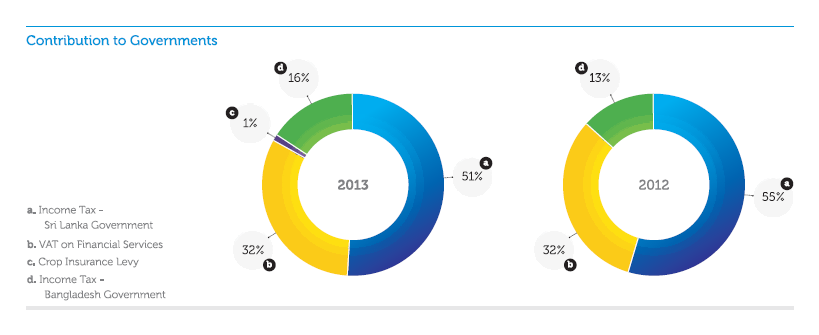
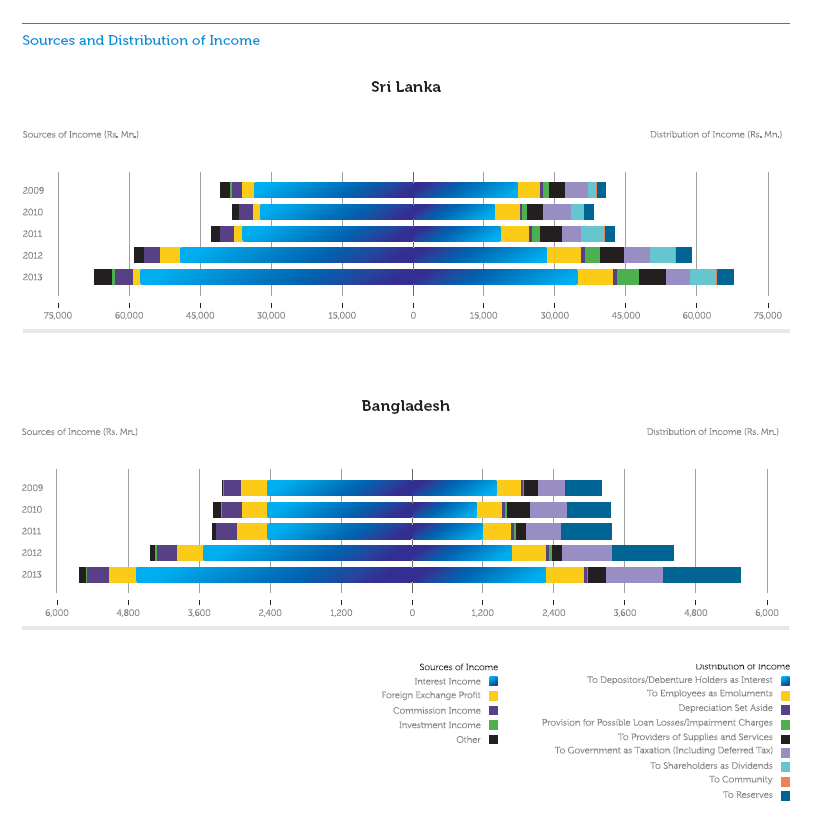
Direct Economic Value Generated and Distributed
The data provided below covers the last five-year period reflecting the Bank’s contribution to the economy.
| Sri Lankan Operation | Bangladesh Operation | |||||||||
| 2013 Rs. Mn. |
2012 Rs. Mn. |
2011 Rs. Mn. |
2010 Rs. Mn. |
2009 Rs. Mn. |
2013 Rs. Mn. |
2012 Rs. Mn. |
2011 Rs. Mn. |
2010 Rs. Mn. |
2009 Rs. Mn. |
|
Source of income |
||||||||||
| Interest income | 57,534 | 49,169 | 35,914 | 32,293 | 33,479 | 4,653 | 3,516 | 2,442 | 2,447 | 2,446 |
| Foreign exchange profit | 1,541 | 4,246 | 1,811 | 1,329 | 2,532 | 455 | 448 | 510 | 412 | 430 |
| Commission income | 3,876 | 3,253 | 2,977 | 2,886 | 2,227 | 374 | 345 | 348 | 334 | 303 |
| Investment income | 873 | 103 | 81 | 188 | 215 | 14 | 16 | – | 19 | 4 |
| Other | 3,722 | 2,201 | 1,715 | 1,468 | 2,084 | 118 | 98 | 61 | 146 | 21 |
| 67,546 | 58,972 | 42,498 | 38,164 | 40,537 | 5,614 | 4,423 | 3,361 | 3,358 | 3,204 | |
Distribution of income |
||||||||||
| To depositors/debenture holders as interest | 34,617 | 28,148 | 18,452 | 17,241 | 22,087 | 2,262 | 1,682 | 1,198 | 1,087 | 1,428 |
| To employees as emoluments | 7,555 | 7,190 | 5,834 | 5,162 | 4,685 | 631 | 580 | 456 | 426 | 396 |
| Depreciation set aside | 881 | 987 | 699 | 485 | 466 | 55 | 48 | 49 | 54 | 40 |
| Provision for possible loan losses/ impairment charges |
4,606 | 3,155 | 1,763 | 1,163 | 1,513 | 21 | 42 | 45 | 29 | 21 |
| To providers of supplies & services | 5,629 | 5,046 | 4,661 | 3,402 | 3,381 | 297 | 183 | 167 | 377 | 238 |
| To government as taxation | 5,149 | 5,357 | 3,946 | 5,885 | 4,703 | 961 | 827 | 596 | 630 | 456 |
| - Income tax | 3,104 | 3,370 | 2,418 | 3,164 | 2,431 | 961 | 827 | 596 | 630 | 456 |
| - VAT on Financial Services | 1,969 | 1,987 | 1,523 | 2,709 | 2,264 | – | – | – | – | – |
| - Crop insurance levy | 76 | – | – | – | – | – | – | – | – | – |
| - Debits tax | – | – | 5 | 12 | 8 | – | – | – | – | – |
| To shareholders as dividends | 5,519 | 5,418 | 4,905 | 2,642 | 1,749 | – | – | – | – | – |
| To community | 51 | 51 | 110 | 57 | 22 | – | 1 | – | 1 | – |
| To reserves | 3,539 | 3,620 | 2,128 | 2,127 | 1,931 | 1,387 | 1,060 | 850 | 754 | 625 |
| 67,546 | 58,972 | 42,498 | 38,164 | 40,537 | 5,614 | 4,423 | 3,361 | 3,358 | 3,204 | |
Note:
The data for 2011, 2012 and 2013 have been extracted from the Audited Financial Statements prepared based on Sri Lanka Accounting Standards (SLFRS/LKAS) and
data for 2009 and 2010 have been extracted from the Audited Financial Statements prepared based on Sri Lanka Accounting Standards (SLAS)