|
|
 |
| |
Commercial Bank has in the past decade outpaced the market growth consistently and with increasing momentum. It has been a record of an all-round growth encompassing new avenues, market shares as well as balance sheet and profitability. Thus, the pursuit of growth and the practice of prudence have featured prominently and co-existed in harmony. This philosophy that has held us in good stead will be held fast in the ensuing years.
Following are the cornerstones of this strategy:
Maintaining a Quality Portfolio of Advances and Deposits.
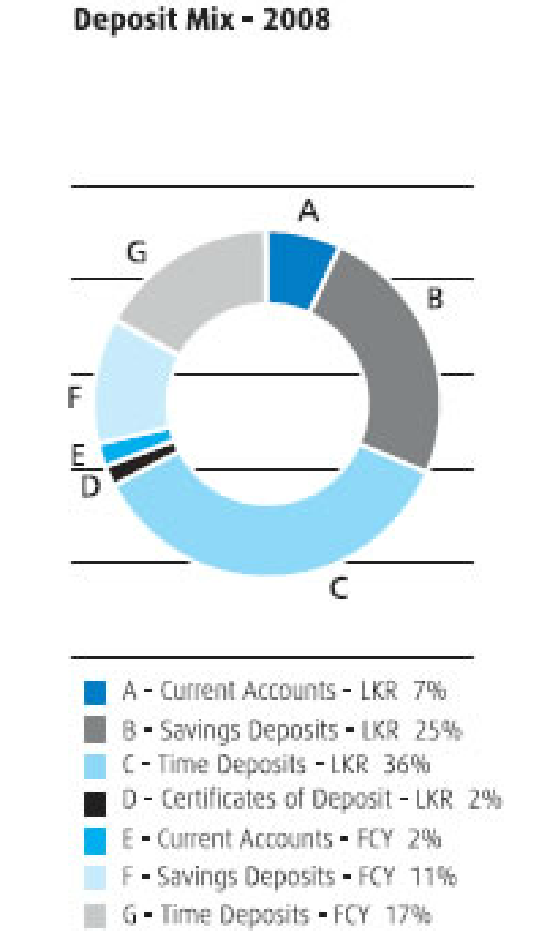
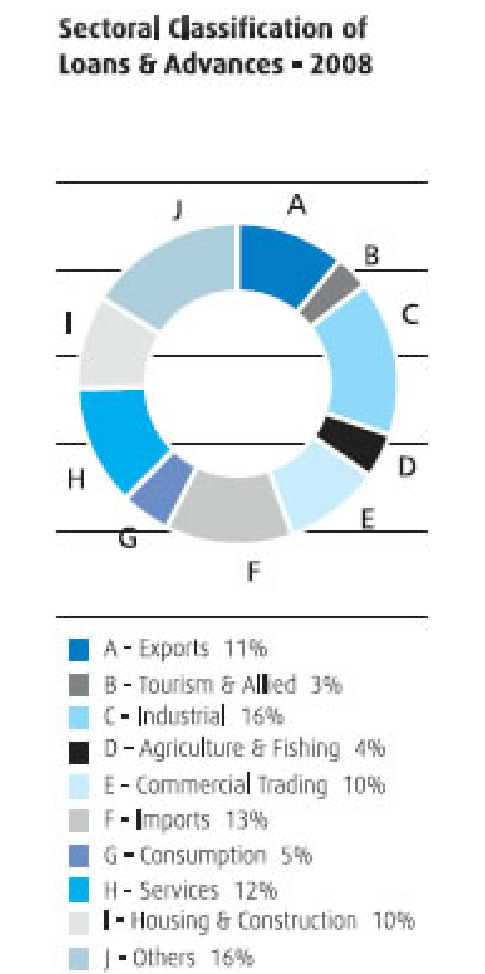
Our loan portfolio and deposit portfolio
is widely diverse across sectors and across instruments. We have one of
the lowest non-performing loan ratios in the industry despite our dominant market share in advances.
Stringent Corporate Governance
A comprehensive set of responsibilities and practices exercised by the Board and Executive Management ensure that risks are managed appropriately and the Bank’s resources are used responsibly. More information on this area is found in the Section on ‘Stewardship’ on pages 46 to 77 of this Annual Report.
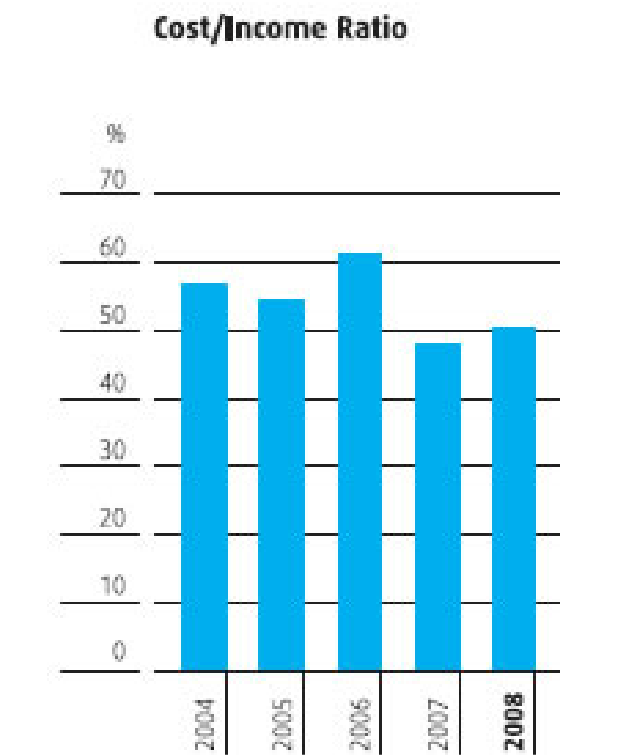
Cost Containment
Commercial Bank has maintained one of the lowest cost/income ratios in the industry. Our cost/income ratio as at
the year end stood at 50.46%. This is even more significant given that Commercial Bank was the growth
leader in the last decade.
|
Investing in New Technology
The Bank continued to make investments in IT and in upgrading its systems and processes. In 2008 it invested Rs. 552.060 Mn to upgrade its systems and add new ones. Over the past five years, the Bank has invested Rs. 1.728 Bn in IT: an average of Rs. 345.664 Mn per year.
In 2008, in partnership with the International Finance Corporation (IFC) the Bank commissioned an external review in order to develop an ‘Information Technology Road Map’. Based on the outcome of this initiative, the Bank is now designing a two-year investment plan to address the areas that need development.
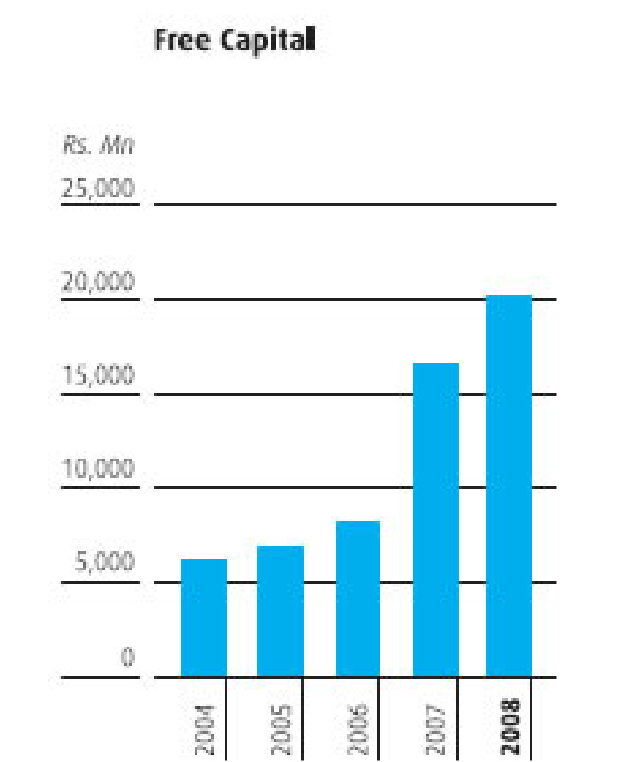
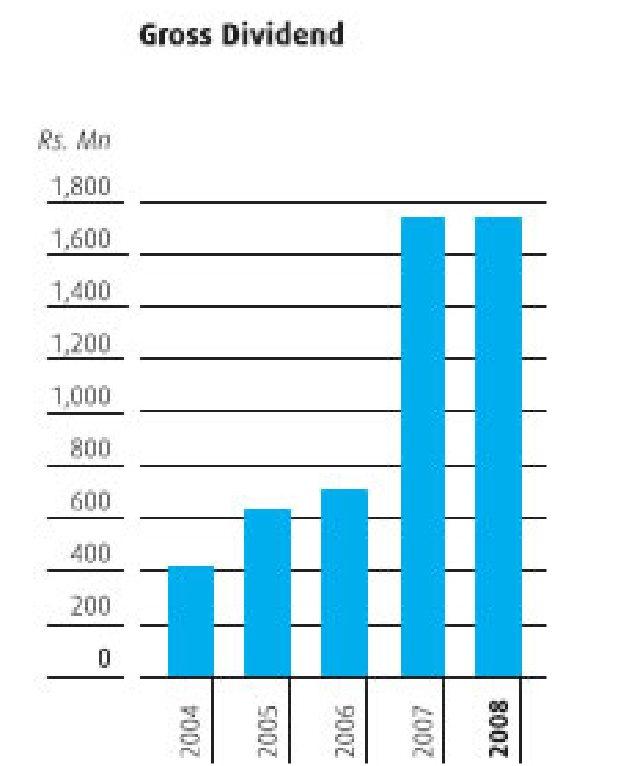
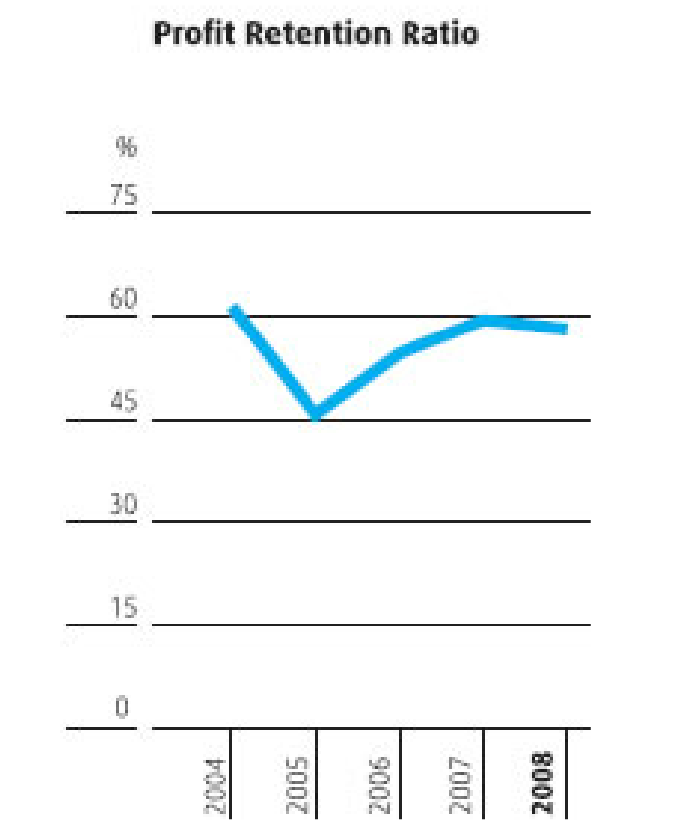
The following indicators are a testimony of our growth record. They are also the ones that we will track to
measure prudent growth in the ensuing years.
| Value Growth |
|
|
|
|
| |
2004 |
2008 |
5-year compounded annual growth –
Commercial Bank (%) |
| Assets (Rs. Bn) |
138.473 |
281.214 |
15.22 |
| Deposits (Rs. Bn) |
98.730 |
199.881 |
15.15 |
| Advances (Rs. Bn) |
90.721 |
180.401 |
15.24 |
| Profit after tax (Rs. Bn) |
1.685 |
4.268 |
20.43 |
| Profit per employee (Rs. Mn) |
0.589 |
1.056 |
12.41 |
| ATM transactions per day
by value (Rs. Mn) |
93.451 |
285.048 |
24.99 |
|
| |
| Volume Growth |
|
|
|
|
| |
2004 |
2008 |
5-year compounded annual growth –
Commercial Bank (%) |
| No. of delivery points |
129 |
181 |
3.44 |
| No. of ATMs |
188 |
346 |
6.29 |
| ATM transactions per day
by volume |
25,055 |
73,732 |
24.09 |
|
| |
| Quality of Growth |
|
|
|
|
| |
2004 |
2008 |
|
| Non-performing loans ratio (%) |
4.43 |
5.19 |
|
| Cost Income ratio (%) |
56.78 |
50.46 |
|
| Total Capital Adequacy
Ratio (%) |
13.16 |
13.13 |
|
|
|
|
|
|
| Value Addition |
|
|
|
|
| |
2008 |
|
2007 |
|
| |
Rs. ’000 |
% |
Rs. ’000 |
% |
| Value Added |
|
|
|
|
| Income from Banking Services |
43,236,404 |
|
34,782,698 |
|
| Cost of Services |
(26,828,388) |
|
(20,128,239) |
|
| Value Added by Banking Services |
16,417,041 |
|
14,654,459 |
|
| Non-Banking Income |
878,845 |
|
440,220 |
|
| Loan Losses and Provisions |
(2,278,212) |
|
(1,777,476) |
|
| |
15,008,649 |
|
13,317,203 |
|
|
|
|
|
|
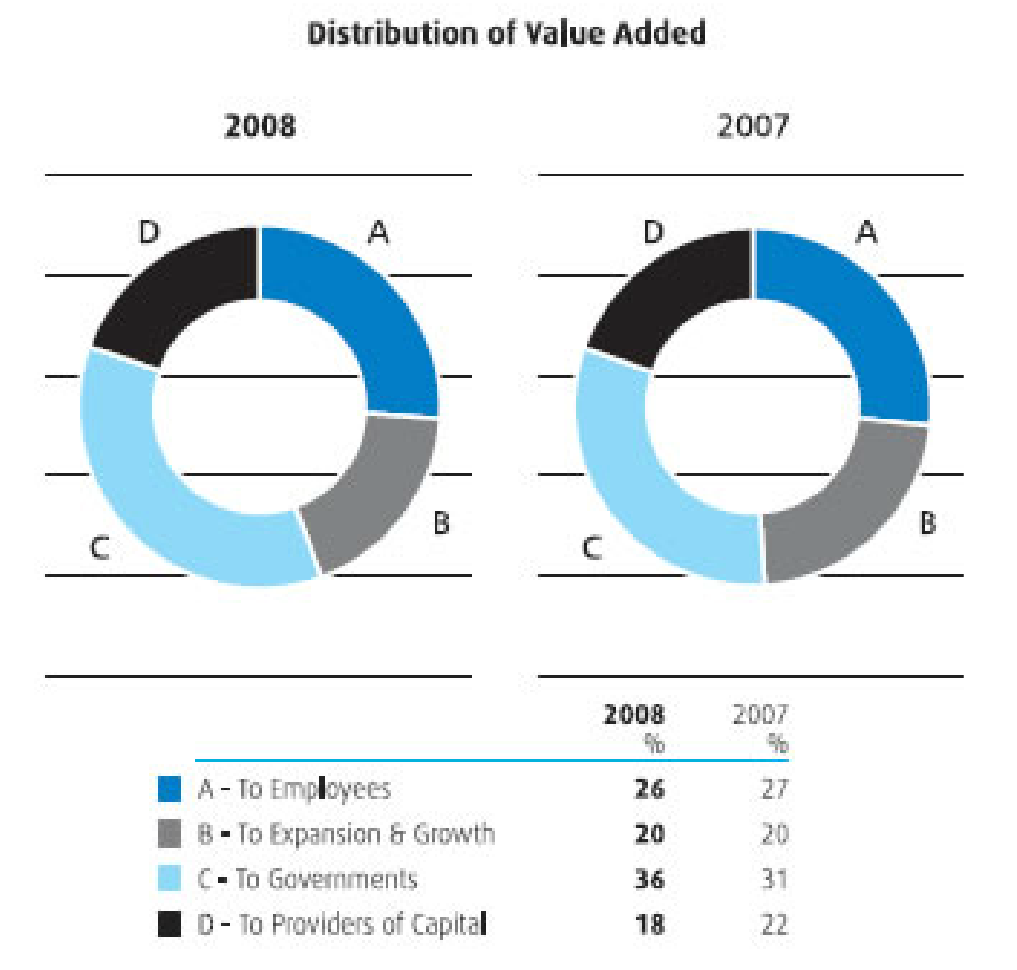
| Distribution of Value Added |
|
|
|
|
| To Employees |
|
|
|
|
| Salaries and other benefits |
3,926,397 |
26.16 |
3,538,518 |
26.57 |
|
|
|
|
|
| To Providers of Capital |
|
|
|
|
| Dividends to Shareholders |
1,786,498 |
|
1,855,626 |
|
| Interest to Debenture holders |
977,881 |
|
1,104,753 |
|
| |
2,764,379 |
18.42 |
2,960,379 |
22.23 |
|
|
|
|
|
| To Governments |
|
|
|
|
| Income Tax |
3,260,795 |
|
2,629,177 |
|
| Value Added Tax |
2,091,468 |
|
1,551,762 |
|
| Debits Tax |
9,150 |
|
6,045 |
|
|
5,361,413 |
35.72 |
4,186,984 |
31.44 |
|
|
|
|
|
| To Expansion and Growth |
|
|
|
|
| Retained profit |
2,481,874 |
|
2,247,939 |
|
| Depreciation |
483,611 |
|
411,396 |
|
Deferred Taxation
|
(9,025) |
|
(28,013) |
|
| |
2,956,460 |
19.70 |
2,631,322 |
19.76 |
| |
15,008,649 |
100.00 |
13,317,203 |
100.00 |
Economic Value Added
Economic Value Added (EVA) is a measure of profitability which takes into consideration the cost of total invested equity.
| |
2004 |
2005 |
2006 |
2007 |
2008 |
| |
Rs. ’000 |
Rs. ’000 |
Rs. ’000 |
Rs. ’000 |
Rs. ’000 |
| Invested Equity |
|
|
|
|
|
| Shareholders’ Funds |
12,004,962 |
13,861,828 |
14,842,841 |
22,936,037 |
25,891,229 |
| Add : Cumulative Loan Loss Provision |
2,053,828 |
2,192,293 |
2,536,465 |
3,557,301 |
4,954,774 |
|
14,058,790 |
16,054,121 |
17,379,306 |
26,493,338 |
30,846,003 |
| Earnings |
|
|
|
|
|
Profit after Taxation and Dividends
on Preference Shares |
1,454,362 |
2,133,888 |
1,815,210 |
3,991,065 |
4,227,688 |
| Add : Loan Losses and Provisions |
699,200 |
414,864 |
655,070 |
1,777,476 |
2,278,212 |
| Less : Loan Losses Written Off |
(9,138) |
(5,011) |
(7,698) |
(1,836) |
(5,141) |
|
2,144,424 |
2,543,741 |
2,462,582 |
5,766,705 |
6,500,759 |
Cost of Equity based on 12 months
Weighted Average Treasury Bill Rate
plus 2% for the Risk Premium |
9.65% |
10.87% |
12.91% |
18.07% |
20.92% |
| Cost of Average Equity |
1,230,614 |
1,636,637 |
2,158,128 |
3,963,893 |
5,997,695 |
| Economic Value Added |
913,810 |
907,104 |
304,454 |
1,802,812 |
503,064 |
At Commercial Bank we are deeply conscious of delivering value to all our stakeholders consistently. We still remain one of the very few companies in Sri Lanka that has embraced EVA as a measure of performance.
In EVA terms, we have created Rs. 503.064 Mn during the year 2008 and over Rs. 4.400 Bn over the past 5 years. |
|
|
|