|
 |
| |
Despite the unfavourable macro economic conditions that prevailed in the country, the Bank was successful in improving overall performance during the year. It has to be mentioned that the moderate growth achieved was not a patch on the growth margins posted in 2007. Commercial Bank continued to maintain its position as the premier Bank in the country and continues to be the most profitable and financially robust. The Bank operates in a highly competitive arena where 22 commercial banks and 14 specialised banks compete for a share in the financial market. Commercial Bank now commands 13% of the market share in deposits, advances as well as in total banking assets of the country, based on results published up to September 30, 2008.
More emphasis has been placed on risk assessment considering the turbulent economic environment in which its clients operate. However, the Bank experienced deterioration in its asset quality as a result of general downturn of the economic environment amidst a high inflationary condition. It was further aggravated with the new provisioning policies of the Central Bank which came into effect during the course of 2008. Nevertheless the prudent measures taken in the past few years enabled the Bank to remain robust in these extremely challenging times.
Bank’s Profitability
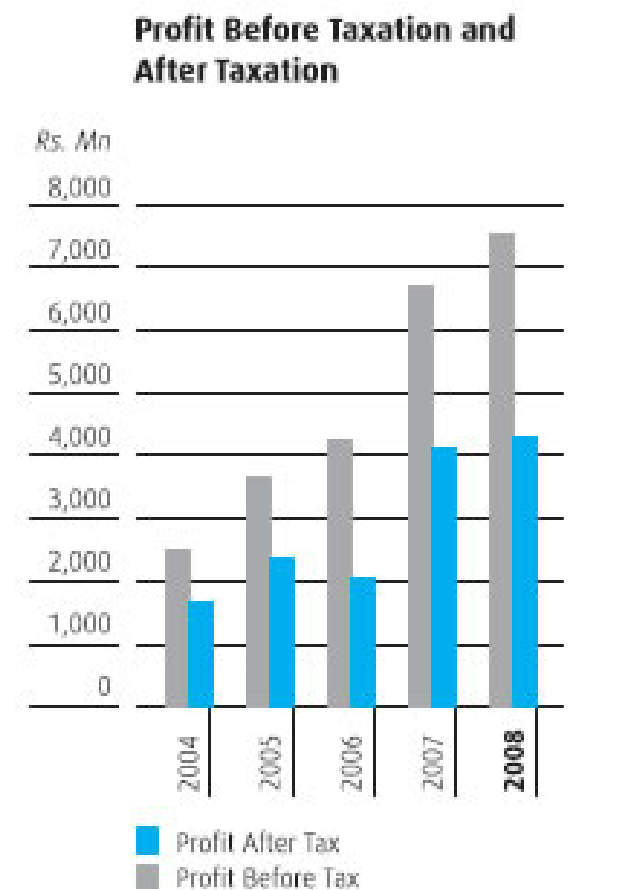
The Bank recorded moderate results during the year. Pre-tax profit of the Bank was up by Rs. 0.815 Bn to Rs. 7.520 Bn in 2008, a 12.16% growth over the previous year. Provision for taxation recorded a higher increase of 25.01% mainly due to an amendment introduced to the basis of calculation of Financial VAT. The profit after tax reached Rs. 4.268 Bn compared to Rs. 4.104 Bn in 2007, recording a lower growth of 4.02% over the previous year. It is pertinent to mention that the pre-tax profit of the Bank reported above
has been arrived at after charging
Rs. 692.162 Mn being payments made on account of oil hedging transactions with two customers of the Bank and after recognising Rs. 405.531 Mn being the profit made on sale of Bank’s stake in the shares of Commercial Leasing Company PLC, one of the former Associates of the Bank. Once discounted for the effects of these two abnormal items the normalised pre-tax profit of the Bank would amount to Rs. 7.529 Bn and on this basis the normalised pre-tax profit for 2008 would have recorded a growth of Rs. 0.825 Bn
or 12.31% over 2007. Further, the normalised post tax profit of the Bank would have recorded a growth of only
Rs. 0.007 Bn or 0.17%.
Business Volumes
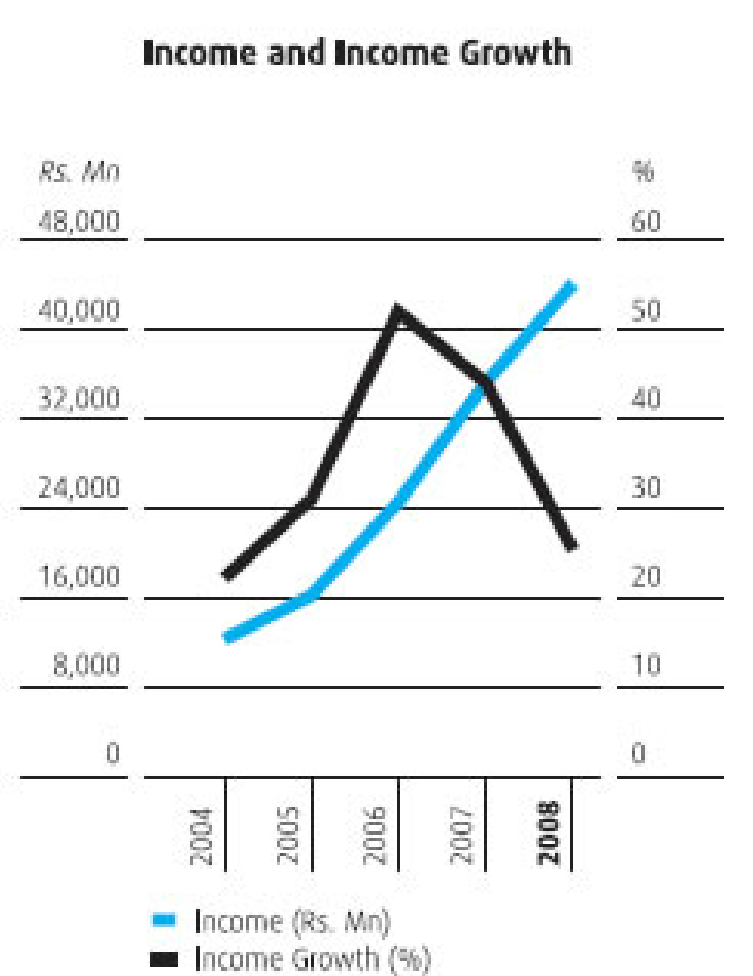
Moderate growth in business volumes, stiff competition amidst a volatile interest rate environment which squeezed margins and substantial increases in non-performing advances as a result of inflationary conditions, contributed to recording a lower growth in net interest income compared to previous years. Deposits recorded
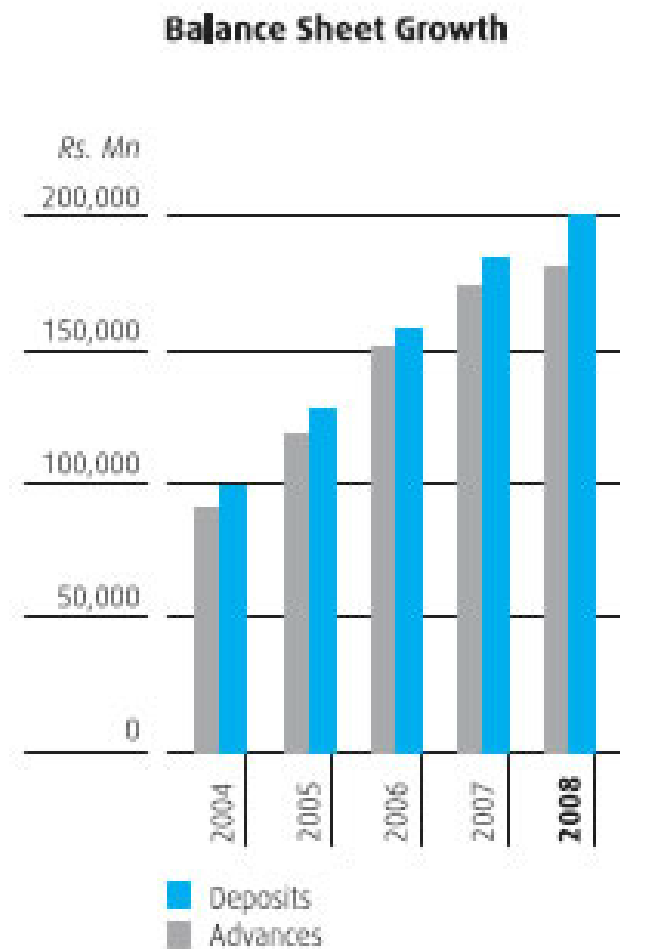
an increase of 9.16% to reach
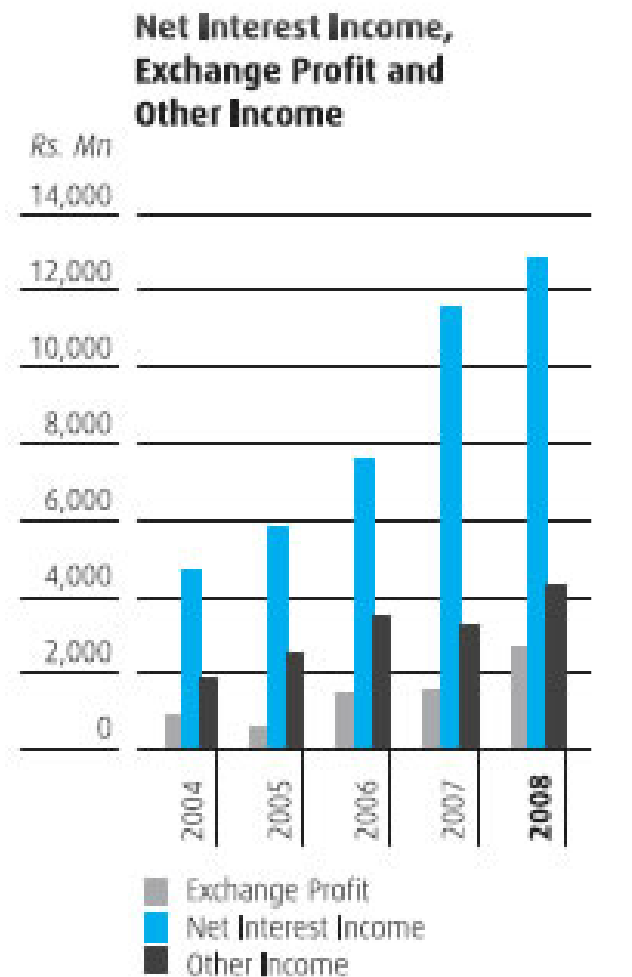
Rs. 199.881 Bn while total net advances recorded an increase of 3.49% to reach Rs. 180.401 Bn over the previous year. The total interest earning assets of the Bank amounted to Rs. 254.006 Bn in 2008 versus Rs. 240.833 Bn in 2007 representing a growth of Rs. 13.173 Bn or 5.47% over the previous year while the total interest bearing liabilities grew by 6.04% to Rs. 224.955 Bn in 2008 compared to Rs. 212.143 Bn in 2007. Nevertheless the increase in volumes along with prudent fund management measures adopted, helped the Bank reach Rs. 12.853 Bn in net interest income recording an increase of
Rs. 1.301 Bn or 11.26% over the previous year. The Bank continued to witness a shift in the deposits mix from low cost deposits to high cost deposits due to the high interest rate regime that prevailed during the year. The Bank duly redeemed the preference shares and debentures totalling to Rs. 3.244 Bn during the year.
Provisions and NPLs
The pre-and post-tax profits of the Bank reported above, were achieved after providing Rs. 2.278 Bn on account of possible loan losses in 2008. The provision for bad debts increased by 28.17% or
Rs. 0.501 Bn to Rs. 2.278 Bn as compared to Rs. 1.777 Bn provided in 2007. This increase was primarily attributable to the adverse macroeconomic conditions that prevailed in the country and additional provisions made consequent to the new guidelines issued by the Central Bank of Sri Lanka on classification of non-performing loans. Despite the substantial increase recorded in the non-performing advances, the Bank’s Net NPL ratio of 5.19% is considered to be one of the lowest reported by a local commercial bank based on the results published up to September 30, 2008. As a result of the increase in non-performing advances, the Provision Cover and the Open Credit Exposure ratio of the Bank deteriorated to 35.46 % and 21.39% respectively as at December 31, 2008 from 51.07% and 9.61% recorded as at December 31, 2007.
Non Fund Based Income
Foreign exchange profits recorded a phenomenal growth of 70.46% to reach Rs. 2.633 Bn mainly due to higher gains realised from forward foreign exchange deals transacted during the year. The growth was boosted further by the gain recognised on revaluation of the Offshore Banking Centre’s retained profits maintained in US dollars. Foreign exchange trading and turnover too recorded substantial increases over the previous year. The LKR/US$ rate was volatile during the year before ending at Rs. 112.80. On a year-to-year basis, the LKR recorded a depreciation of 3.96% against the US$ in 2008 compared to 0.93% a year ago.
Fees and commission-based income increased by 13.96% compared to the previous year. Other income recorded an increase of almost 100% over the previous year. This was mainly due to the profit made on disposal of shares of Commercial Leasing Company PLC as mentioned earlier. The other notable factor that contributed for this increase was the higher recoveries made during the year.
Operating Expenses
Operating expenses grew by 28.14% mainly due to high inflationary conditions prevailed in 2008 and an increase in Financial VAT arising as a result of an amendment introduced to the basis of calculation of Financial VAT in 2008. This also includes a payment made on oil hedging contracts for which the Bank is yet to be paid. Discounting the payment made on oil hedging transactions, the normalised operating expenses recorded a growth of 20.91%. As a result, the Cost to Income ratio of 50.46 % (normalised 46.96%) recorded a moderate increase compared to the ratio of 47.87% reported a year ago. It is pertinent to mention that the Cost to Income ratio of
the Bank is considered to be one of the lowest reported by a local commercial bank, based on the results published up to September 30, 2008.
Group Performance
The Commercial Bank Group made a pre-tax profit of Rs. 7.416 Bn in 2008 as against Rs. 6.790 Bn recorded in 2007,
recording a lower growth of Rs. 0.625 Bn
or 9.21%. The post-tax profit of the Group amounted to Rs. 4.120 Bn in 2008 compared to Rs. 4.152 Bn recorded in 2007. This recorded a marginal decrease of 0.77%. The main contributory factor for this decrease was the profits recognised on sale of shares of Commercial Leasing Company PLC in the Group accounts being lower than that of the Bank. This was due to the recognition of part of that profit in equity of the Group prior to its disposal.
Moving to Basel II
In 2007, the Bank successfully carried out a parallel run to compute
the Capital Adequacy Ratios (CAR) under Basel II. The Bank migrated to the
Basel II, in March 2008 in which the ‘Standardised Approach’ was used to risk weight the Credit and Market risks while the ‘Basic Indicator Approach’ was used to risk weight the Operational risk. The Bank did not observe any significant variances in the reported ratios in 2008 compared to that of 2007.
The Bank depended on the retention of profits to supplement the enhanced capital requirements consequent to the increase in the asset base of the Bank. As a result, the Bank witnessed a deteriorating CAR during the last few years. This situation has further
been aggravated due to the lower
growth reported in post tax profits of the Bank. The Tier I and Tier I & II CAR as at December 31, 2008 stood at 10.51% and 13.09% respectively.
Bank’s Assets
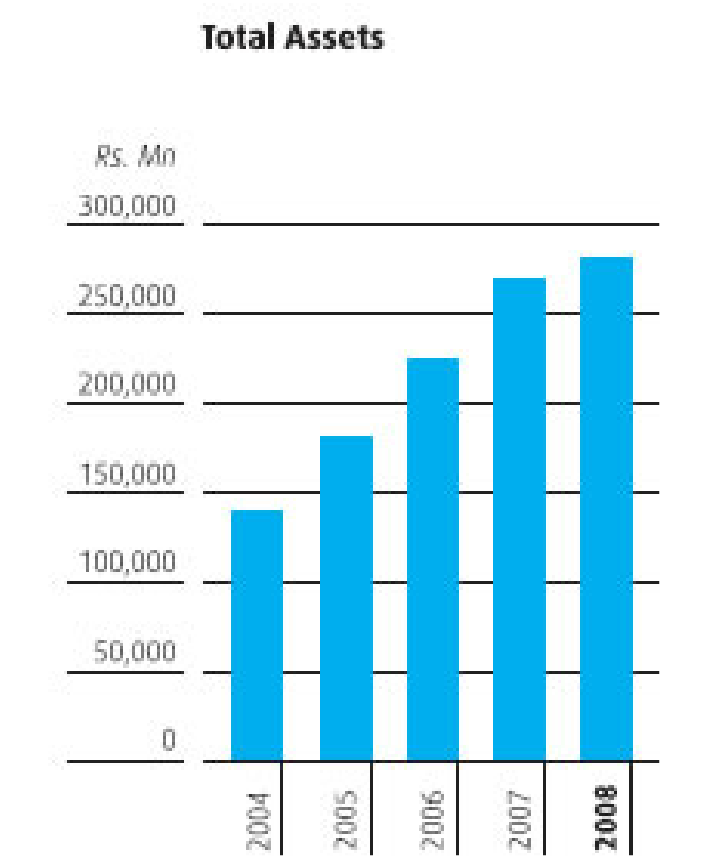
Total assets of the Bank grew by 4.95% to reach Rs. 281.214 Bn in 2008, as against Rs. 267.940 Bn reported in 2007.
Overseas operations in Bangladesh continued to boost the overall performance of the Bank and has greatly contributed in reducing the over-dependence on the Sri Lankan market. The Pre-tax and Post-tax profits of
Rs. 1.019 Bn and Rs. 0.539 Bn earned during the year respectively by this operation, substantiates the growth potential of this market.
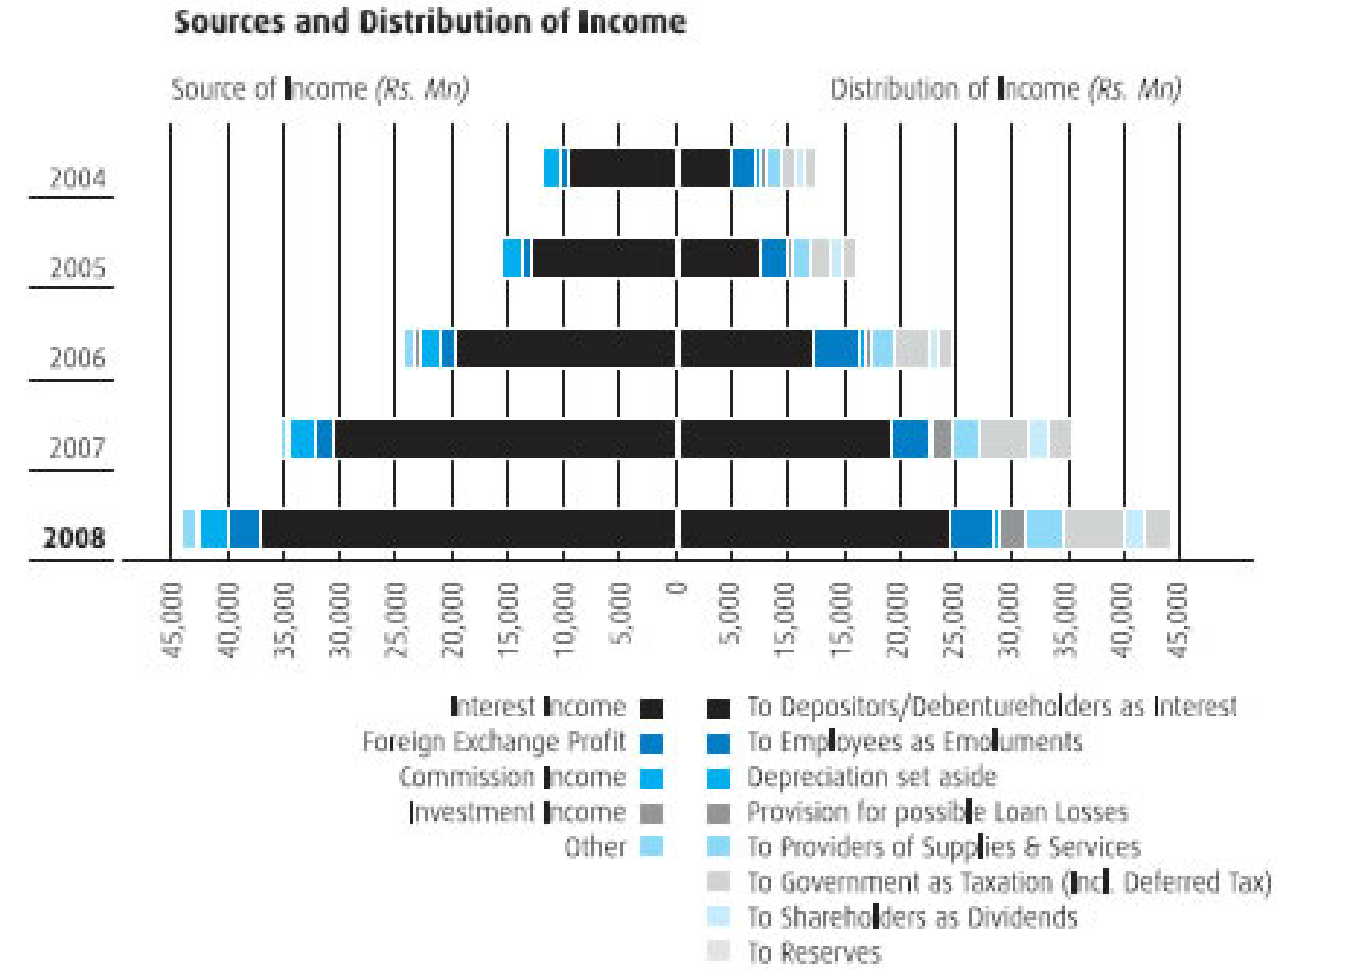
Sources and Distribution of Income
| |
2004 |
2005 |
2006 |
2007 |
2008 |
| For the year ended December 31, |
Rs. Mn |
Rs. Mn |
Rs. Mn |
Rs. Mn |
Rs. Mn |
| Source of Income |
|
|
|
|
|
| Interest Income |
9,584 |
13,033 |
19,532 |
30,503 |
37,188 |
| Foreign Exchange Profit |
874 |
587 |
1,439 |
1,545 |
2,633 |
| Commission Income |
1,377 |
1,760 |
2,011 |
2,383 |
2,715 |
| Investment Income |
217 |
441 |
305 |
310 |
359 |
| Other |
238 |
279 |
1,182 |
482 |
1,220 |
| |
12,290 |
16,100 |
24,469 |
35,223 |
44,115 |
| Distribution of Income |
|
|
|
|
|
| To Depositors/Debenture holders as Interest |
4,878 |
7,226 |
11,955 |
18,951 |
24,336 |
| To Employees as Emoluments |
2,132 |
2,364 |
4,374 |
3,539 |
3,926 |
| Depreciation set aside |
260 |
299 |
376 |
411 |
421 |
| Provision for possible Loan Losses |
699 |
415 |
655 |
1,777 |
2,278 |
| To Providers of Supplies and Services |
1,373 |
1,527 |
1,919 |
2,282 |
3,534 |
| To Government as Taxation (Incl. Deferred Tax) |
1,264 |
1,905 |
3,178 |
4,159 |
5,352 |
| - Income Tax |
819 |
1,278 |
2,201 |
2,601 |
3,252 |
| - Financial VAT |
441 |
623 |
971 |
1,552 |
2,091 |
| - Debits Tax |
4 |
4 |
6 |
6 |
9 |
| To Shareholders as Dividends |
650 |
869 |
911
|
1,856 |
1,786 |
| To Reserves |
1,034 |
1,495 |
1,101 |
2,248 |
2,482 |
| |
12,290 |
16,100 |
24,469 |
35,223 |
44,115 |
Market Capitalisation
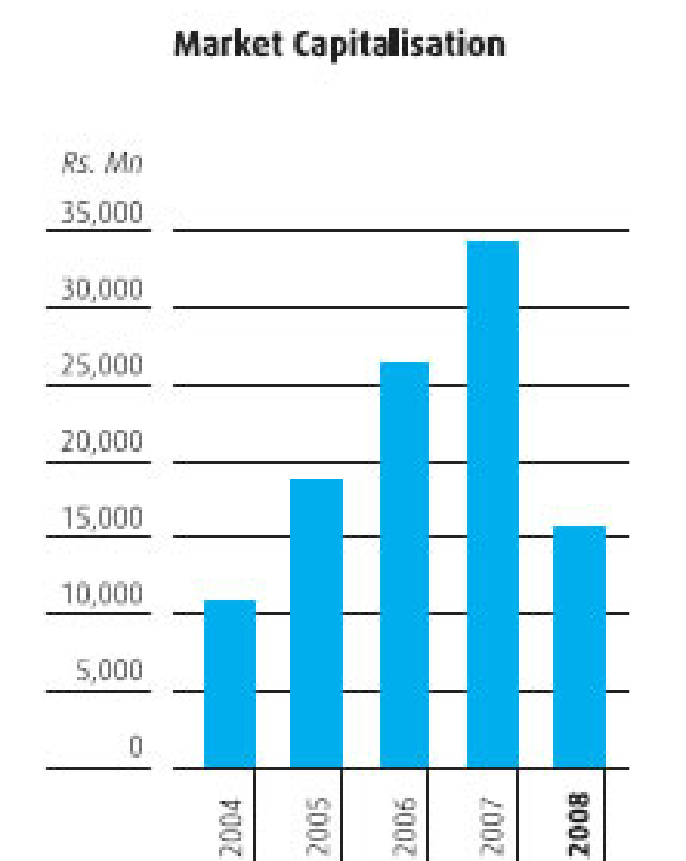
Commercial Bank recorded
the largest market capitalisation of
Rs. 15.630 Bn among all listed banks and financial institutions in Sri Lanka to rank No. 4 (No. 4 in 2007) among all listed companies on the Colombo Stock Exchange at end of 2008. This however recorded a sharp decrease compared to the market capitalisation of Rs. 34.234 Bn recorded at December 31, 2007 mainly due to the dampened market activities as evidenced by the year-to-year drops of 40.85% and 50.44% recorded in the All Share Price Index (ASPI) and Milanka Price Index respectively. This was mainly due to adverse economic conditions that prevailed in the country as well as by the effects of the global financial crisis.
Dividends
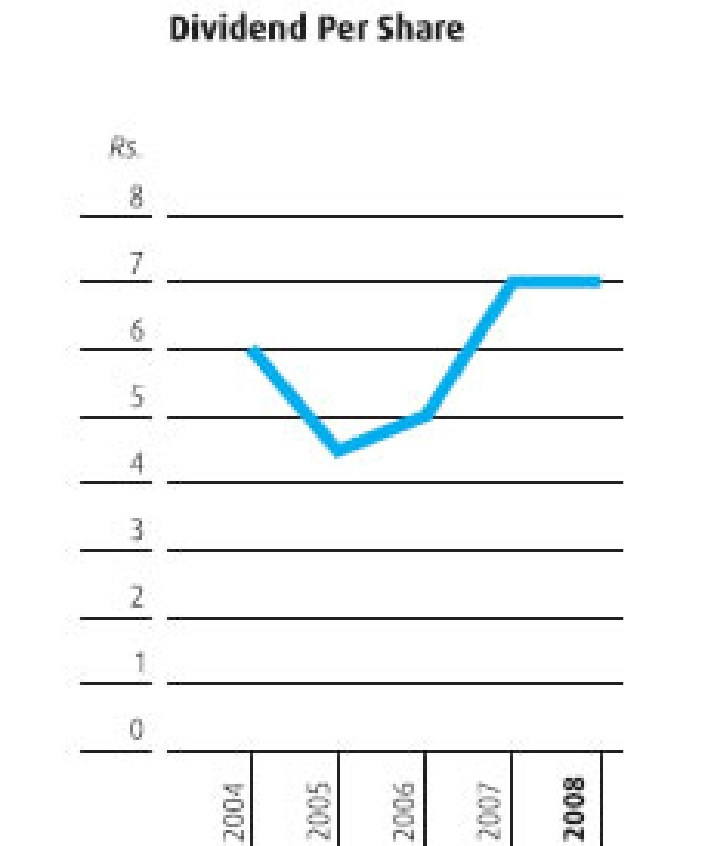
The Directors have recommended a final dividend of Rs. 4.00 per share to be paid on April 06, 2009. This together with the two interim dividends already paid in 2008 totalling to Rs. 3.00 per share, will add up to a total dividend of Rs. 7.00 per share for the year 2008 (Rs. 7.00 in 2007). Thus, the Bank has declared a total dividend of Rs. 1.745 Bn to its ordinary shareholders for 2008. This amounted to a Dividend payout ratio of 41.27% which is well above the minimum prescribed rate of 25.00% under the Deemed Dividend tax rule.
|
|
|
| Key Objectives |
2008 Actual |
2008 Budget |
2007 Actual |
| Total Revenue (Rs. Mn) |
44,115.2 |
44,308.4 |
35,222.9 |
| Pre-Tax Profit (Rs. Mn) |
7,520.1 |
8,723.7 |
6,704.7 |
| Post-Tax Profit (Rs. Mn) |
4,268.3 |
5,004.3 |
4,103.6 |
| Ratios |
|
|
|
| Return on Average Shareholders’ Funds |
17.13% |
20.16% |
20.63% |
| Return on Average Assets |
1.55% |
1.70% |
1.67% |
| Earnings per Share |
16.96 |
21.31 |
16.84 |
| Cost/Income Ratio |
50.46% |
46.16% |
47.87% |
| Net Non-Performing Advances |
5.19% |
4.58% |
2.96% |
| Capital Adequacy Tier I |
10.51% |
10.19% |
10.57% |
| Tier I & II |
13.09% |
12.47% |
13.69% |
| Deposits (Rs. Mn) |
199,880.9 |
212,204.3 |
183,110.1 |
| Advances (Rs. Mn) |
186,885.5 |
210,847.7 |
178,878.2 |
An analysis of the profits and business volumes made by the four broad business divisions of the Bank namely Corporate Banking, Personal Banking, International Operations and the Treasury is summarised below:
| |
2008 |
|
2007 |
|
| |
Rs. Mn |
% |
Rs. Mn |
% |
| Profit before Tax: |
|
|
|
|
| - Corporate Banking |
1,527.02 |
20.31 |
2,185.47 |
32.60 |
| - Personal Banking |
3,049.92 |
40.56 |
2,833.46 |
42.26 |
| - Treasury |
1,185.17 |
15.76 |
635.48 |
9.47 |
| - Overseas Operations |
1,758.03 |
23.37 |
1,050.32 |
15.67 |
| Total |
7,520.14 |
100.00 |
6,704.73 |
100.00 |
| Loans and Advances (Gross): |
|
|
|
|
| - Corporate Banking |
74,905.45 |
40.08 |
77,039.71 |
43.07 |
| - Personal Banking |
96,506.77 |
51.64 |
89,229.81 |
49.88 |
| - Overseas Operations |
15,473.31 |
8.27 |
12,608.71 |
7.05 |
| Total |
186,885.53 |
100.00 |
178,878.23 |
100.00 |
|
|
|
|
|
| Deposits: |
|
|
|
|
| - Corporate Banking |
28,587.64 |
14.30 |
29,221.07 |
15.96 |
| - Personal Banking |
150,670.54 |
75.38 |
137,715.13 |
75.21 |
| - Overseas Operations |
20,622.80 |
10.32 |
16,173.93 |
8.83 |
| Total |
199,880.98 |
100.00 |
183,110.13 |
100.00 |
|
|