Share Price Trend
Ordinary Voting Shares
| Year |
2008 |
2007 |
2006 |
2005 |
2004 |
2003 |
2002 |
2001 |
2000 |
1999 |
| Highest Price (Rs.) |
149.75 |
250.00 |
192.50 |
269.00 |
170.00 |
226.00 |
230.00 |
155.00 |
120.00 |
121.00 |
| Lowest Price (Rs.) |
66.25 |
128.00 |
123.00 |
120.00 |
130.00 |
130.00 |
120.00 |
70.50 |
70.50 |
90.00 |
| Last traded Price (Rs.) |
67.00 |
147.00 |
190.00 |
135.50 |
159.75 |
144.00 |
200.00 |
127.00 |
93.00 |
115.00 |
Information on Movement in Share Capital
|
|
|
|
No. of Shares |
| Year |
Issue |
Basis |
No. of Shares Issued/(Redeemed) |
Voting -
Ordinary |
Non-Voting - Ordinary |
Cumulative
Redeemable
Preference |
| 1987 |
As at 31st December 1987 |
– |
3,000,000 |
– |
– |
|
| 1988 |
Bonus Issue Voting 2 for 3 |
|
2,000,000 |
5,000,000 |
– |
– |
| 1990 |
Bonus Issue Voting |
1 for 1 |
5,000,000 |
10,000,000 |
– |
– |
| 1993 |
Rights Issue Voting |
1 for 4 |
2,500,000 |
12,500,000 |
– |
– |
| 1996 |
Bonus Issue Voting |
3 for 5 |
7,500,000 |
20,000,000 |
– |
– |
|
Rights Issue Voting |
1 for 4 |
5,000,000 |
25,000,000 |
– |
– |
|
Share Swap Non-Voting |
– |
894,275 |
25,000,000 |
894,275 |
– |
|
Bonus Issue Non-Voting |
3 for 5 |
536,565 |
25,000,000 |
1,430,840 |
– |
|
Rights Issue Non-Voting |
1 for 4 |
357,710 |
25,000,000 |
1,788,550 |
– |
| 1998 |
Bonus Issue Voting |
3 for 10 |
7,500,000 |
32,500,000 |
1,788,550 |
– |
|
Bonus Issue Non-Voting |
3 for 10 |
536,565 |
32,500,000 |
2,325,115 |
– |
| 2001 |
Bonus Issue Voting |
1 for 5 |
6,500,000 |
39,000,000 |
2,325,115 |
– |
|
Bonus Issue Non-Voting |
1 for 5 |
465,023 |
39,000,000 |
2,790,138 |
– |
|
Issue of Cumulative
Redeemable Preference Shares
|
|
90,655,500 |
|
2,790,138 |
90,655,500 |
| 2003 |
Bonus Issue Voting |
1 for 3 |
13,000,000 |
52,000,000 |
2,790,138 |
90,655,500 |
|
Rights Issue Voting |
1 for 4 |
13,000,000 |
65,000,000 |
2,790,138 |
90,655,500 |
|
Bonus Issue Non-Voting |
1 for 3 |
930,046 |
65,000,000 |
3,720,184 |
90,655,500 |
|
Rights Issue Non-Voting |
1 for 4 |
930,046 |
65,000,000 |
4,650,230 |
90,655,500 |
|
Issue of Cumulative
Redeemable Preference Shares
|
|
100,000,000 |
65,000,000 |
4,650,230 |
190,655,500 |
| 2004 |
ESOP |
– |
29,769 |
65,029,769 |
4,650,230 |
190,655,500 |
| 2005 |
ESOP |
– |
1,361,591 |
66,391,360 |
4,650,230 |
190,655,500 |
|
Bonus Issue Voting |
1 for 1 |
66,389,162 |
132,780,522 |
4,650,230 |
190,655,500 |
|
Bonus Issue Non-Voting |
1 for 1 |
4,650,230 |
132,780,522 |
9,300,460 |
190,655,500 |
| 2006 |
ESOP |
– |
737,742 |
133,518,264 |
9,300,460 |
190,655,500 |
|
Redemption of Cumulative
Redeemable Preference Shares
|
– |
(90,655,500) |
133,518,264 |
|
100,000,000 |
| 2007 |
Rights Issue Voting |
3 for 10 |
40,288,996 |
173,807,260 |
9,300,460 |
100,000,000 |
| |
Bonus Issue Voting |
1 for 3 |
58,204,268 |
232,011,528 |
9,300,460 |
100,000,000 |
| |
ESOP – |
|
919,649 |
232,931,177 |
9,300,460 |
100,000,000 |
| |
Rights Issue Non-Voting |
3 for 10 |
2,790,138 |
232,931,177 |
12,090,598 |
100,000,000 |
| |
Bonus Issue Non-Voting |
1 for 3 |
4,030,199 |
232,931,177 |
16,120,797 |
100,000,000 |
| 2008 |
Redemption of Cumulative
Redeemable Preference |
|
|
|
|
|
| |
Shares – |
|
(100,000,000) |
232,931,177 |
16,120,797 |
– |
| |
ESOP – |
|
350,049 |
233,281,226 |
16,120,797 |
– |
| |
|
|
|
|
|
|
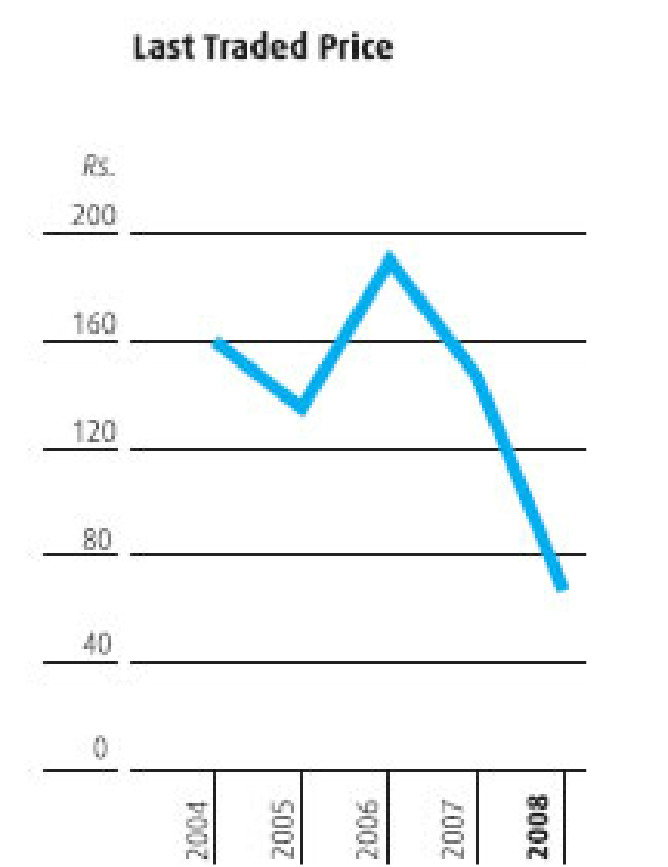
The Bank’s AA+ credit rating was
reconfirmed by Fitch Rating Lanka Ltd.
in 2008 and in Bangladesh the Bank was upgraded to a AA+ rating by Credit Rating Information Services Ltd. The Bank’s share was subject to huge variations as a result of a volatile market in Sri Lanka and fluctuated between a low of Rs. 66.25 in December 2008 to a high of Rs. 149.75 in January 2008. It ended the year at Rs. 67.00.
‘Best Bank’ for 10 Years Running
For a record 10th year running, the Bank was ranked as Sri Lanka’s ‘Best Bank’ by one of the world’s most respected financial publications, ‘Global Finance’
of USA.
The ranking is based on a comprehensive evaluation of the Bank’s performance including growth in assets, profitability, strategic relationships, customer service, competitive pricing and innovative products. Among the other indicators the publication looked at were market share, return on equity and earnings, key capabilities and services offered, geographical range, recent or planned significant developments such as new launches, customer service endorsements and the use of cutting edge technology.
In the ‘Top 1,000’ Banks
The Bank also became the first Sri Lankan Bank to be ranked among the Top 1,000 Banks of the world on the basis of capital adequacy and soundness.
The Bank was ranked at No. 950 based on its Tier One Capital, a significant benchmark for assessing the stability of a bank. For ‘Financial Soundness’, the Bank was ranked 155th. The ranking was compiled by ‘The Banker’, a premier magazine for the world’s investment, retail and commercial banking sectors.
‘Best Annual Report’
The Bank’s Annual Report 2007 was the joint winner of the Best Annual Report in the Overall Category in 2008 organised by The Institute of Chartered Accountants of Sri Lanka.
In addition the Bank won a Gold for the Best Report in the Banking Sector and a Silver (Joint) for the Best Management Commentary.
At the Annual SAFA Awards, the Bank’s Annual Report won a Platinum Award (Joint) in the Overall Category and a Gold in the Banking Sector category. |
|
|
| |
|
|
|